Devpost
Participate in our public hackathons
Devpost for Teams
Access your company's private hackathons
Grow your developer ecosystem and promote your platform
Drive innovation, collaboration, and retention within your organization
By use case
Blog
Insights into hackathon planning and participation
Customer stories
Inspiration from peers and other industry leaders
Planning guides
Best practices for planning online and in-person hackathons
Webinars & events
Upcoming events and on-demand recordings
Help desk
Common questions and support documentation
Sort by:
we are predicting whether the person is having heart disease or not by using age,gender,chest pain type,blood pressure etc.
Make You Feel Hand Gestures to Speech Conversion Again.
Get the optimal price for your used car.
GiveConnect helps us in curbing malnutrition one place at a time. It gives us the ability to see where the affected places, the number of people affected and the NGOs active there so we can donate.
The practice of dividing a company’s customers into group similar in specific ways relevant to marketing such as age, gender, interests, and spending habits into Customer Segmentation.
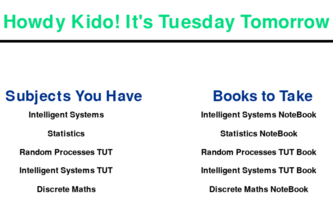
Now students won't forget what books to take and what subjects they have in school tomorrow. Thanks to 'Books for School' Project.
A neurofeedback device that adjusts difficulty on a psychometric test of working memory based on real-time EEG Alpha/Beta ratio (ABR) feedback during the encoding phase
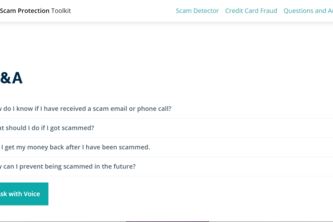
Together, we can fight digital scams. Over $300 million total has been lost to digital scams each year. Explore ways you can protect you and your loved ones from online scams using this toolkit.
This birthday, gift yourself you.
Our project is on sorting data of cancer patients in a neat, arranged format in the form of line graphs. We also will calculate the average of the values given.
An analysis of data on cardiovascular disease through the comparison of factors affecting it or correlating with it for women and men
Our project allows individuals to access complex HIV data and view it in a user-friendly manner. Users can see graphical illustrations of the data and see a correlation between different variables.
Conserve water for a more sustainable future!
Mosey is a machine learning-driven interactive Esri tool which improves the accessibility of pedestrian-friendly streetscapes for healthier, more sustainable neighborhoods.
A dashboard depicting AIS-tracked marine vessels merged with satellite data on SAR-identified ones in order to spot unregulated, i.e. 'dark,' vessels along regions on the U.S coastline.
A Pre-sales Management and Sales forecasting tool
A short tagline
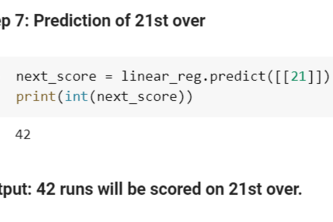
Cricket scores prediction using Linear Regression | Machine Learning | Data Science
Want to see interactive plots to represent International COVID-19 Cases Data? This project contains 6 plots to help you do so!
With students falling behind on school curriculum due to the aftermath of COVID, tutoring has become vital. Yet, it is not always accessible. This program's goal is to counteract these limitations.
Olym-python
Often organisations are facing issues with certificates/tickets for events they organize. However, the certificates can easily be forged. This application is a prototype for solving those problems.
People think that the weather is something random, or is it? My weather forecaster uses weather data in certain locations/cities around the world to determine the weather.
A machine learning based stock predictor that uses time series methods to provide trend and seasonal analysis.