-
-
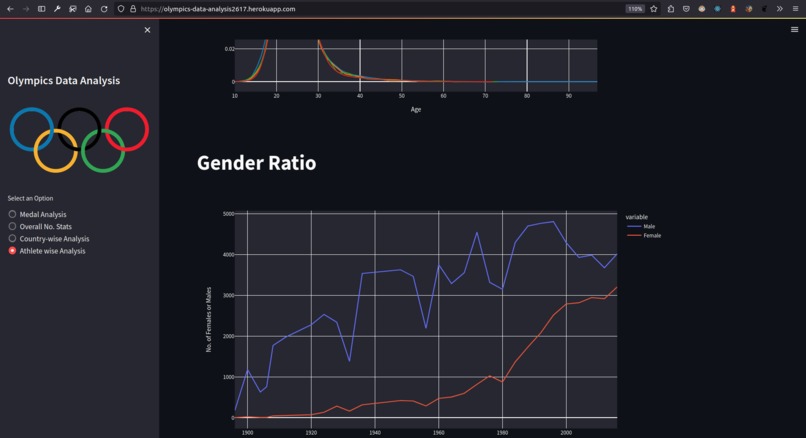
Athlete-Wise Analysis
-

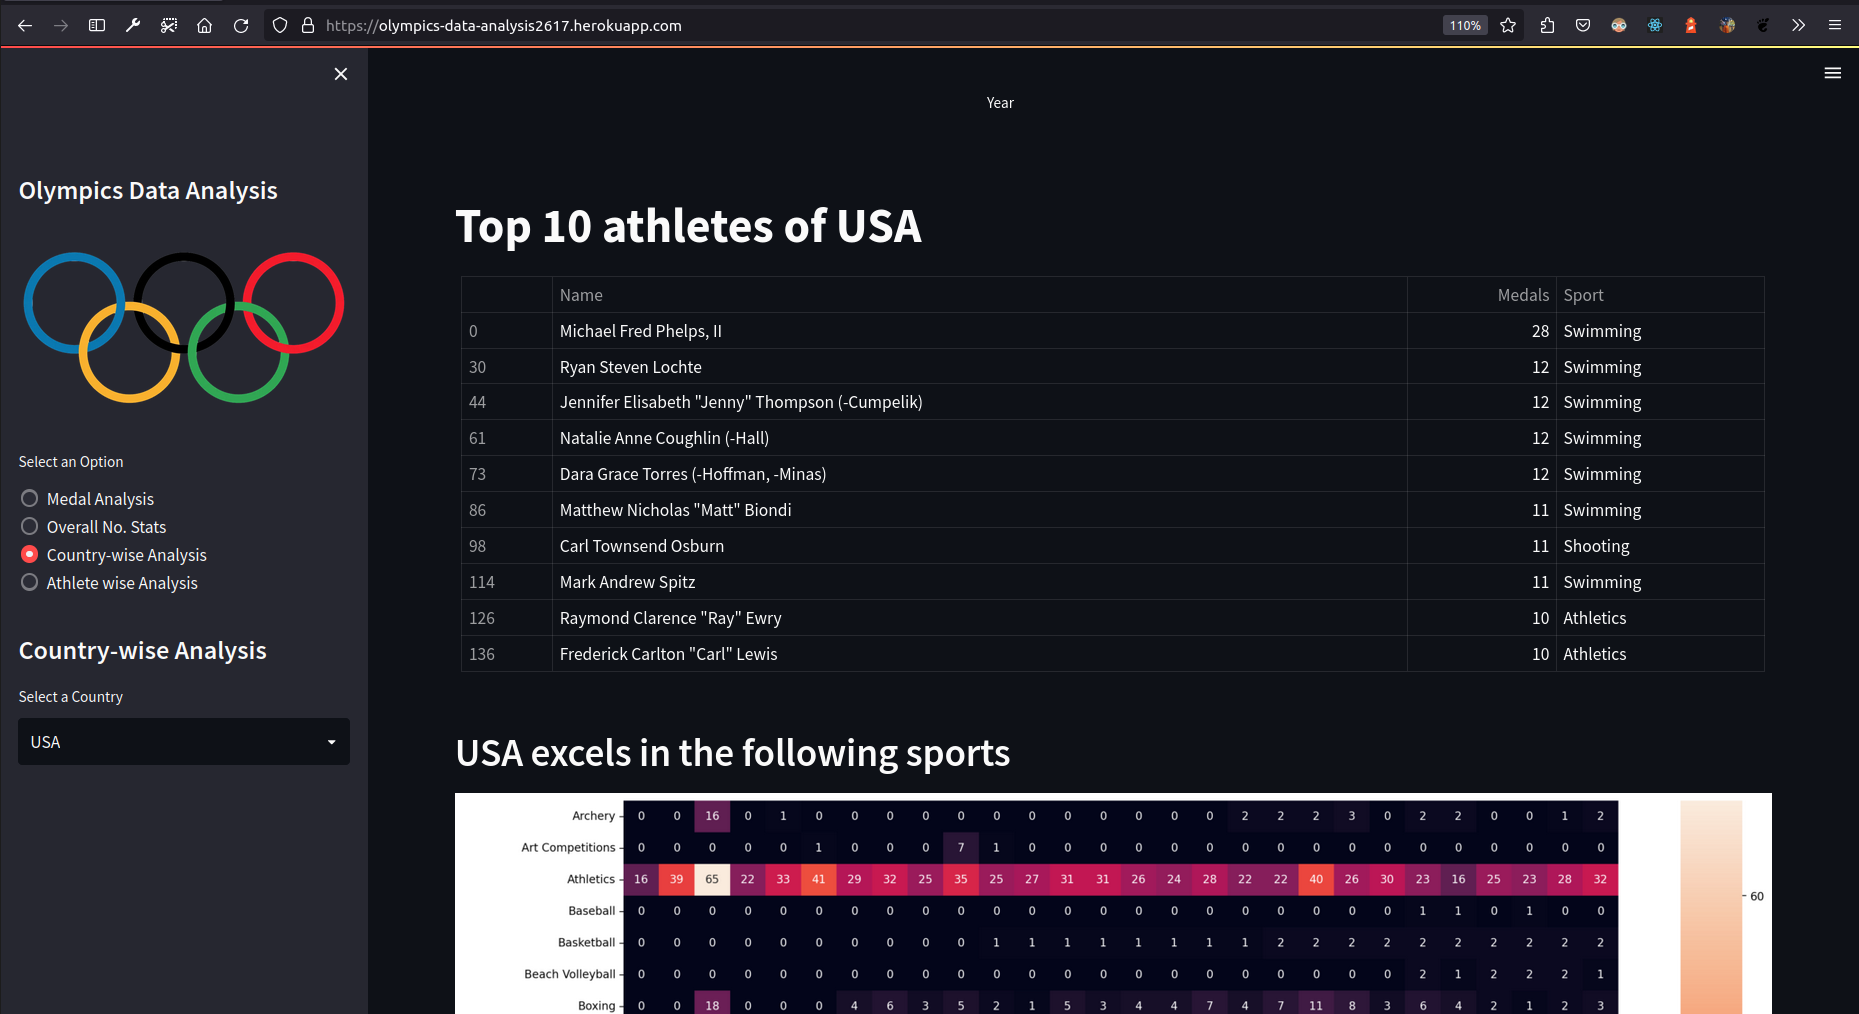
Country wise Analysis
-
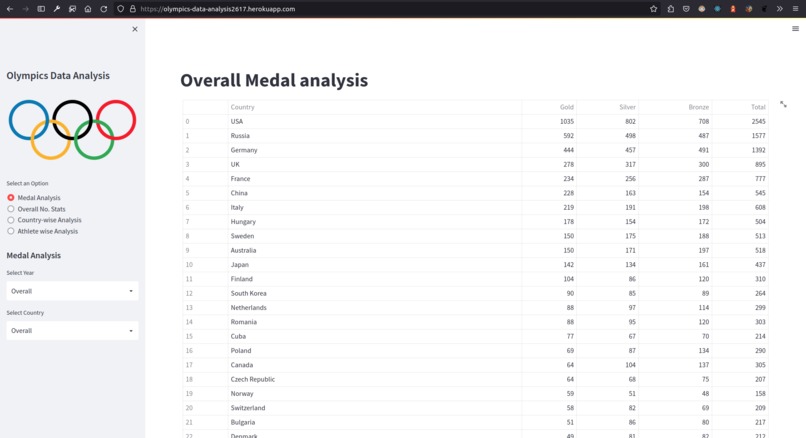
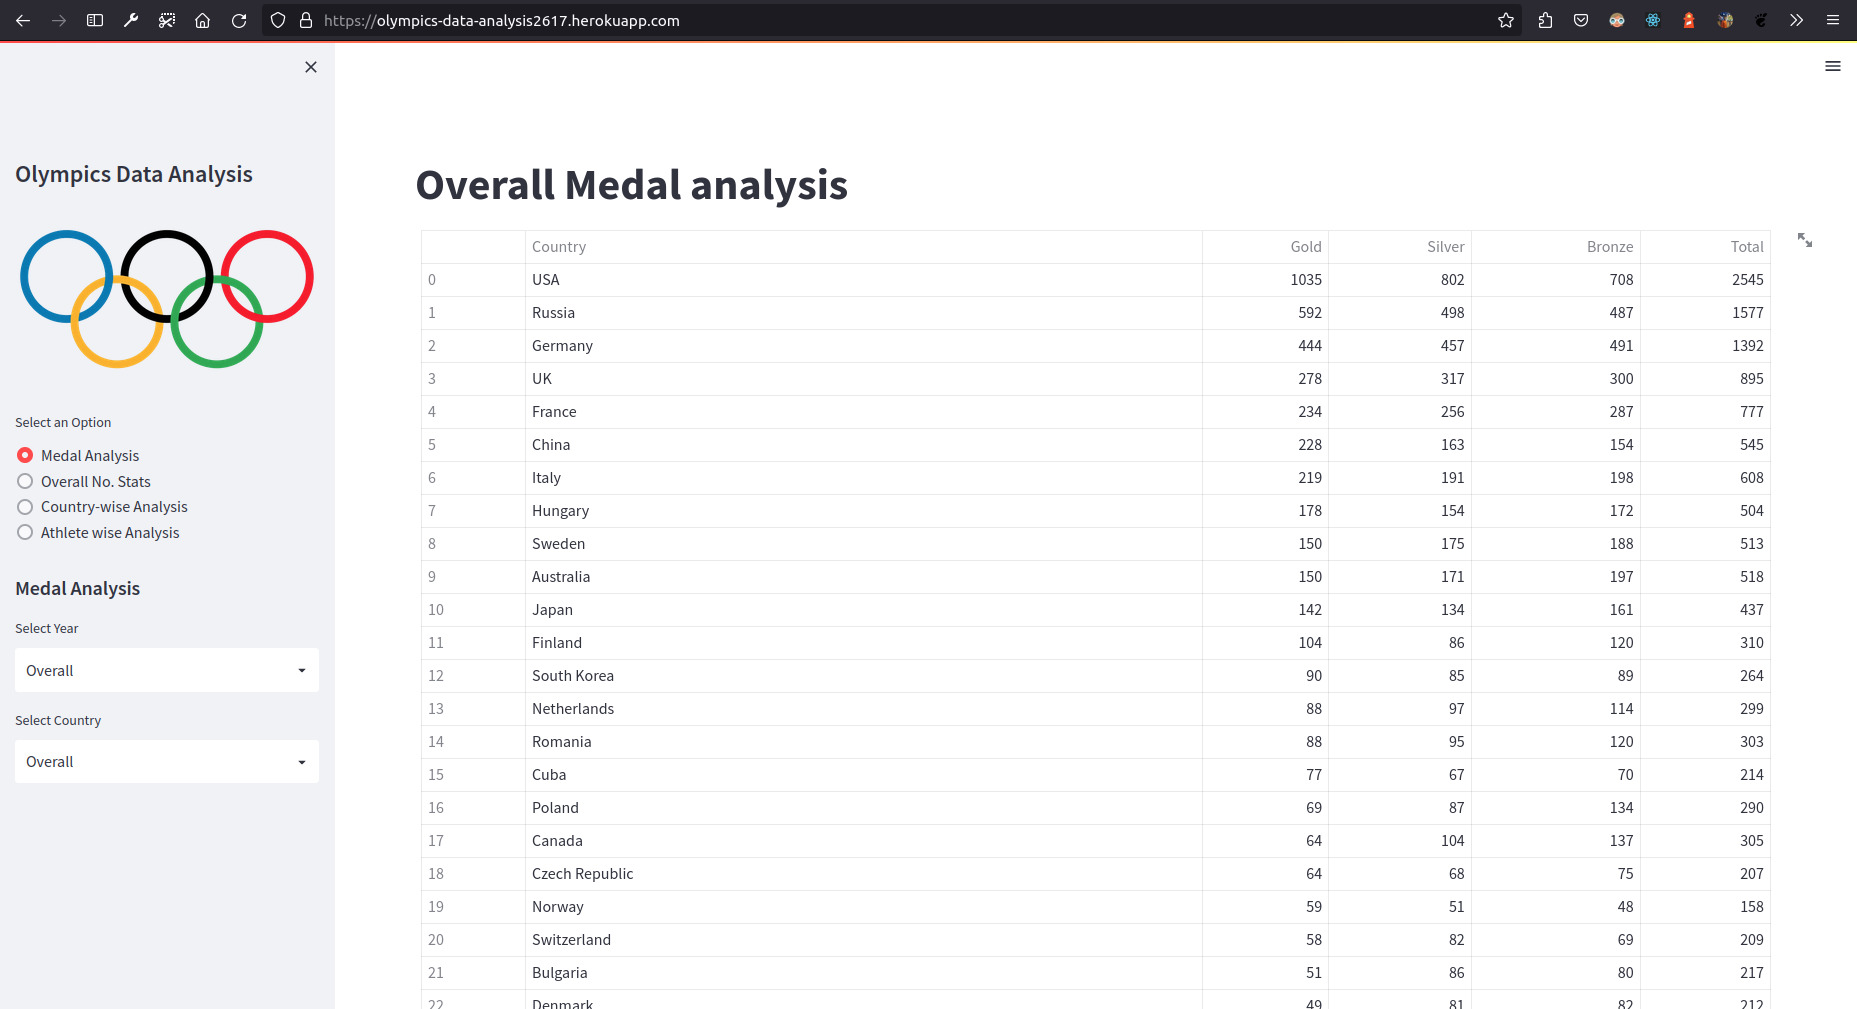
Overall Medal Analysis
-
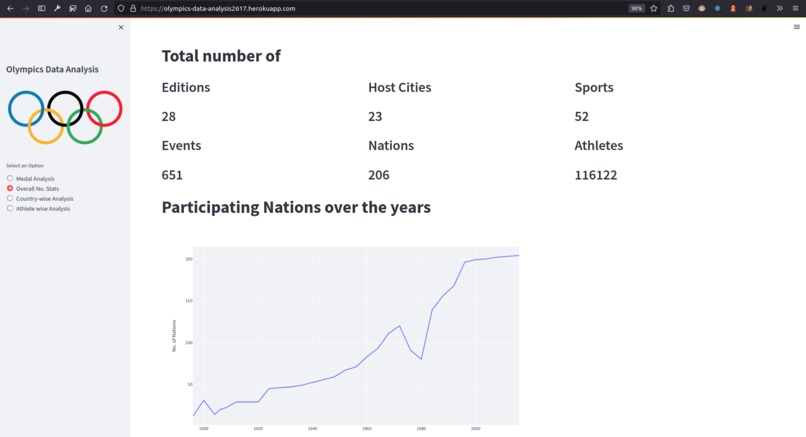
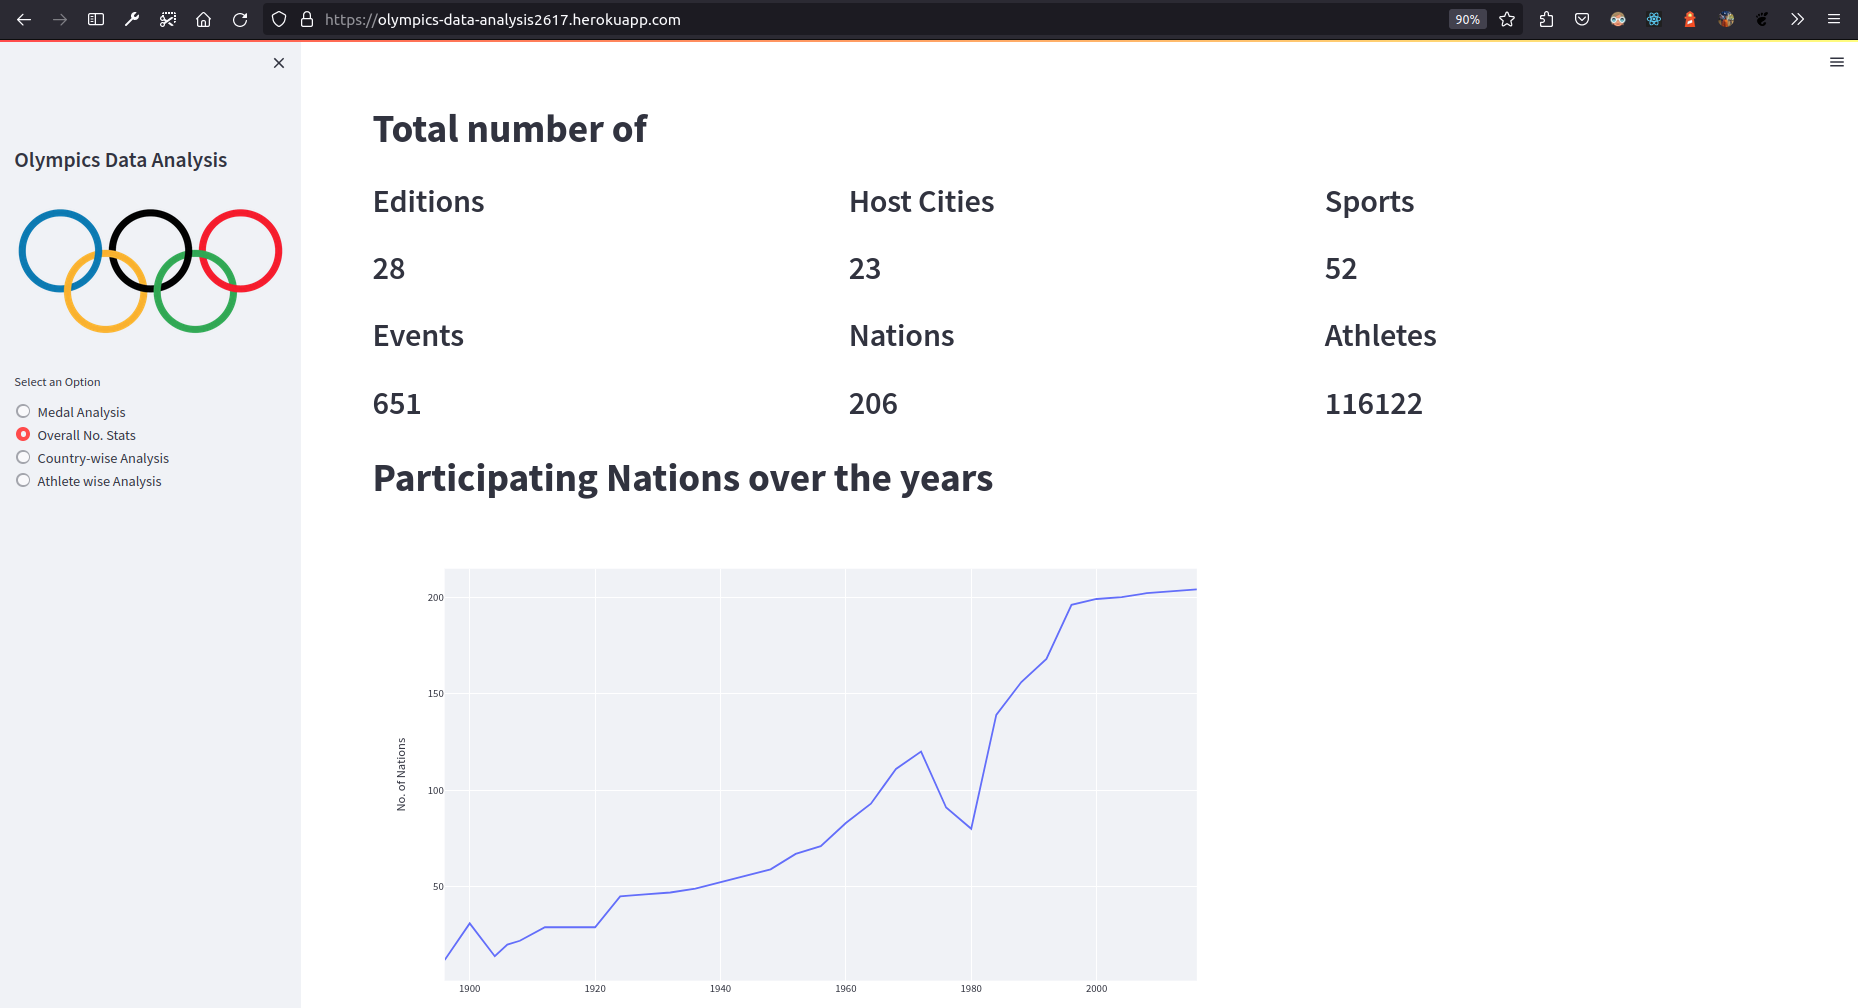
Overall No. Stats

Inspiration
With The World Games currently going on and the world bracing itself for the Summer Olympic Games which will take place in 2024, we thought it would be great to make a project on the data analysis of 120 years of the history of the Olympics for this hackathon.
What it does
The project is a data analysis of 120 years of history of the Olympic games, filtered on the basis of medals won by each of the participating countries from 1896 to 2016, also providing country-wise, athlete-wise and overall statistics of the games. It then visualizes the output in terms of graphs, heatmaps or tables.
How we built it
- We used this Kaggle dataset to filter out the data we needed using Pandas for Summer Olympics.
- From the new data we acquired, we checked for any null values and used the dropna() method to replace the null values with zero or as required.
- After the dataset was completely ready with the required data, we performed the required analysis of the data based on medals won by each participating country over the course of 120 years.
- For overall medal analysis we dropped the redundant columns like the year, host city, event, etc. and segregated the data on basis of total medals, total gold, silver and bronze medals and then sorted the data on the basis of gold medals. In the case of countries like Sweden and Australia, however, the number of gold medals was the same so the sorting is done based on silver medals.
- Finally, the output was in terms of visualization of the data we had with the use of graphs, heatmaps and tables generated using Seaborn, Matplotlib & Plotly
- We worked on the data on Jupyter Notebook first. Then once the output was extracted we shifted the code to PyCharm IDE where we installed Streamlit, which we used to integrate the data to a front-end.
Challenges we ran into
This was the first time we worked on a data analysis project, so we did not have any experience with extracting data from a dataset, or using libraries like Seaborn, Matplotlib or Plotly to generate the heatmaps and graphs.
Accomplishments that we're proud of
We could successfully complete the hack in time and deploy it on Heroku app.
What we learned
We learned how to use various Python libraries and extraction of data from a dataset since this was our first data analysis project.
- We learnt how to extract data from a Kaggle dataset using Pandas library and then cleaning the data as per our requirements.
- We learnt to analyse the given data to segregate it based on different aspects and then sort it accordingly.
- We learnt how to visualize the output for the data we have and learned to generate heatmaps and graphs, and resizing of the same.
What's next for Olympics Data Visualizer
We are planning to add a separate section for Winter Olympics data as well and update newer data from year 2020.

Log in or sign up for Devpost to join the conversation.