Devpost
Participate in our public hackathons
Devpost for Teams
Access your company's private hackathons
Grow your developer ecosystem and promote your platform
Drive innovation, collaboration, and retention within your organization
By use case
Blog
Insights into hackathon planning and participation
Customer stories
Inspiration from peers and other industry leaders
Planning guides
Best practices for planning online and in-person hackathons
Webinars & events
Upcoming events and on-demand recordings
Help desk
Common questions and support documentation
Sort by:
An interactive Supply Chain Analytics System built using TigerGraph database, plotly, graphistry and python
Blueprinting the future of transport
Ability to predict danger, hazards and distractions in advance before they do any damage is no longer a distant fantasy. Subject of surveillance has shown world new ways of predicting hazards ahead.
Your Search Engine for Education to put Concepts in Context!
Since a crisis is linked to a country and all countries are connected, we need to build a graph to see how much the crisis in one country will affect the others.
E-Commerce management
Change the world one match at a time using graph
A cancer variant ANalyser is a graph data lineage that shows the mutations that have happened within normal genes and which peptide position
Introducing a more efficient way to gather personalised marketing data for businesses through targeted sentiment analysis.
This project helps foster critical thinking by showing bias/accuracy of all news sources and also helps users explore news with differing view points from their usual idealogies..
RepoLinks is a graph for better collaboration. It connects developers and provides a window into an organization's technology stack.
Using Graph Analytics to exploit the genome
Reduce the Noise!
Every Point-of-Degree Matters : Extra 0.5C in Global Warming expected to impact around 10.4 million people.
Computer tools can analyze women's speeches by measuring key metrics of their presentation styles that affect how others perceive their skills and their confidence levels.
News articles with the same content are identified and associated with each other in order to prevent inflation of information importance.
Dashboard build with tiger graph to check and monitor the Health Care System of a region/area.
An eclectic news search engine that helps with deduplication of news articles and enriches your reading experience.
P2P app that connects users to mobile money agents
Built with the ultimate goal of increasing the percentage of women in STEM workforces, SHEqual is a tool built to connect women with each other and with opportunities that are great fits for them.
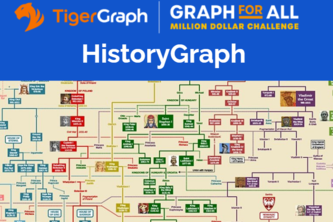
Game-changing genealogy research approach allowing us to understand complex interpersonal historical relationships using TigerGraph graph database.
A graph-based crowdsourcing platform connecting refugees with those who can help, optimizing limited and scattered resources. Designed to be simple to use and maintain for rapidly changing workflows.
The first graphical analysis product in the market based on rich financial scenarios and business analysis, making Graph the most efficient tool for financial knowledge management.
Multi-language/multi platform fact checking powered by TigerGraph and AI. Real-time fact extraction from multiple sources into a massive knowledge graph of more than 25 million facts (and growing)!