-
-
Slide-1
-
Slide-2
-
Slide-3
-
Slide-4
-
Slide-5
-
Slide-6
-
Slide-7
-
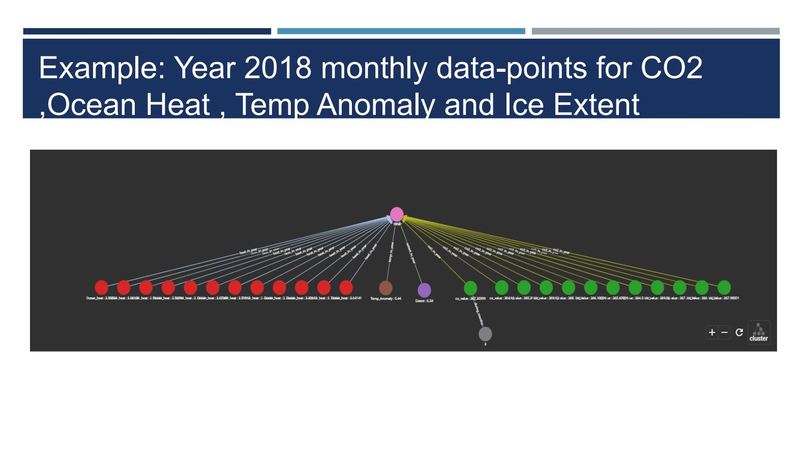
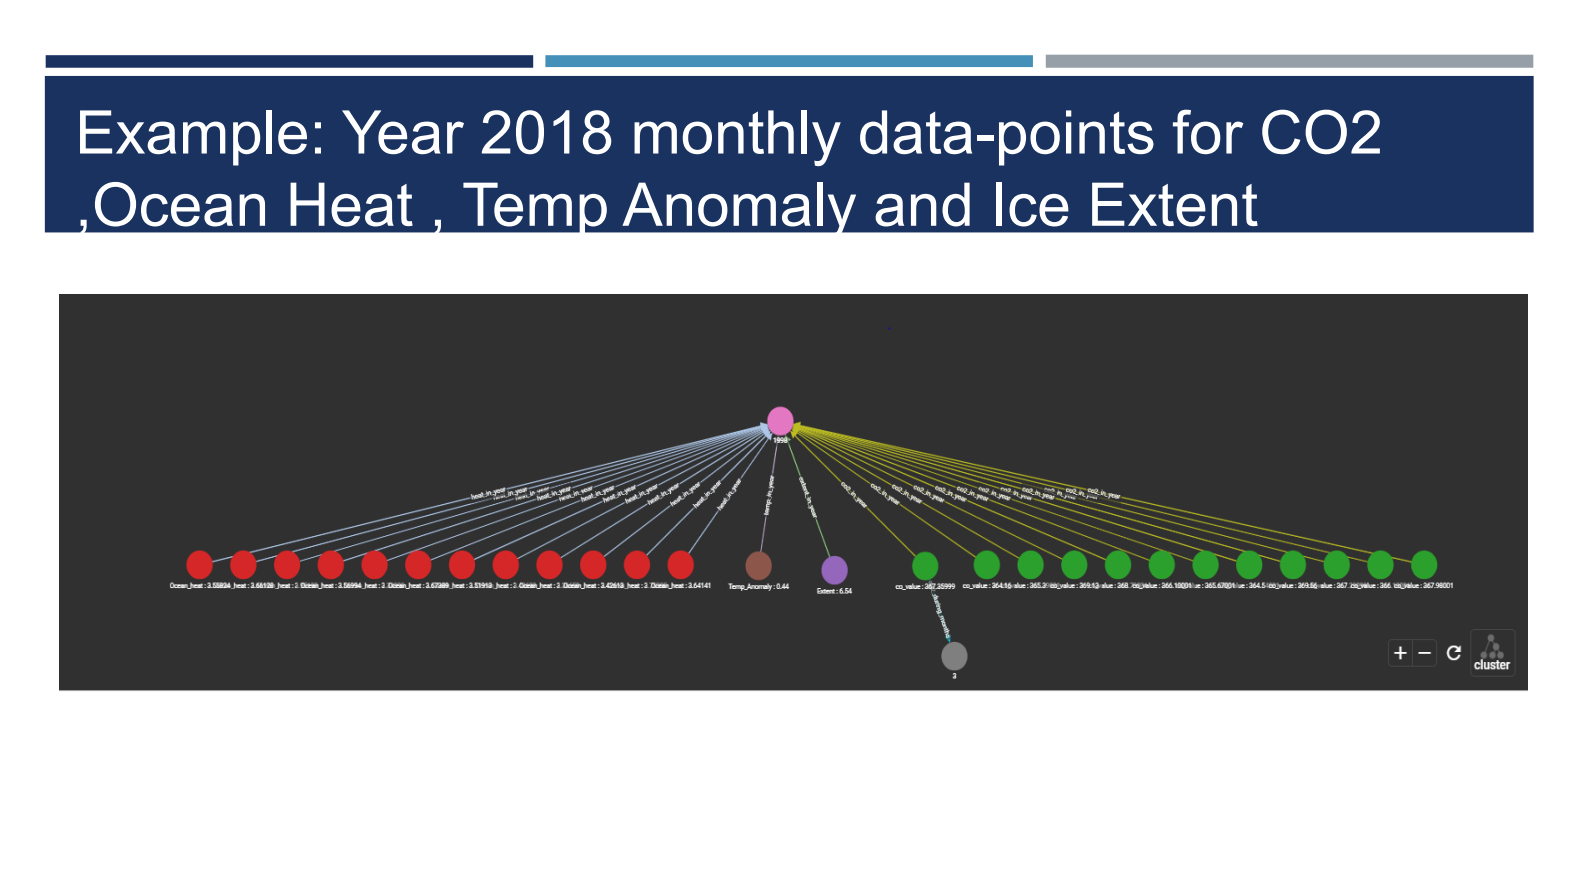
Example: Year 2018 monthly data-points for CO2 ,Ocean Heat , Temp Anomaly and Ice Extent
-
Slide-8
-
Slide-9
-
Slide-10
-
Slide-11
-
Slide-12
-

Slide-13

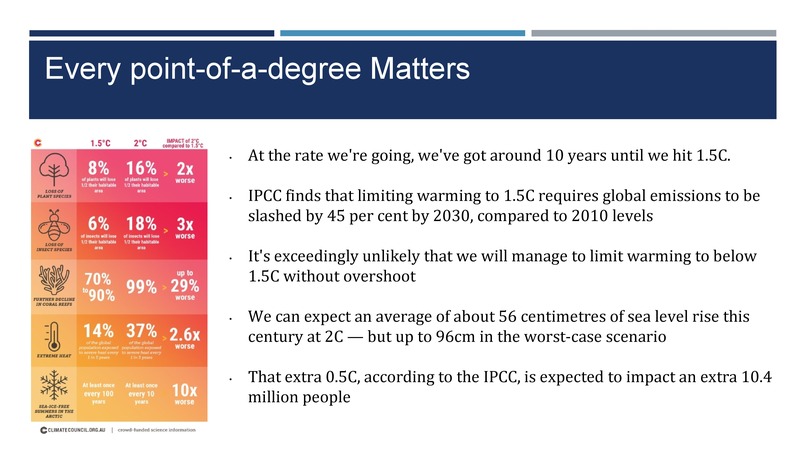
Inspiration
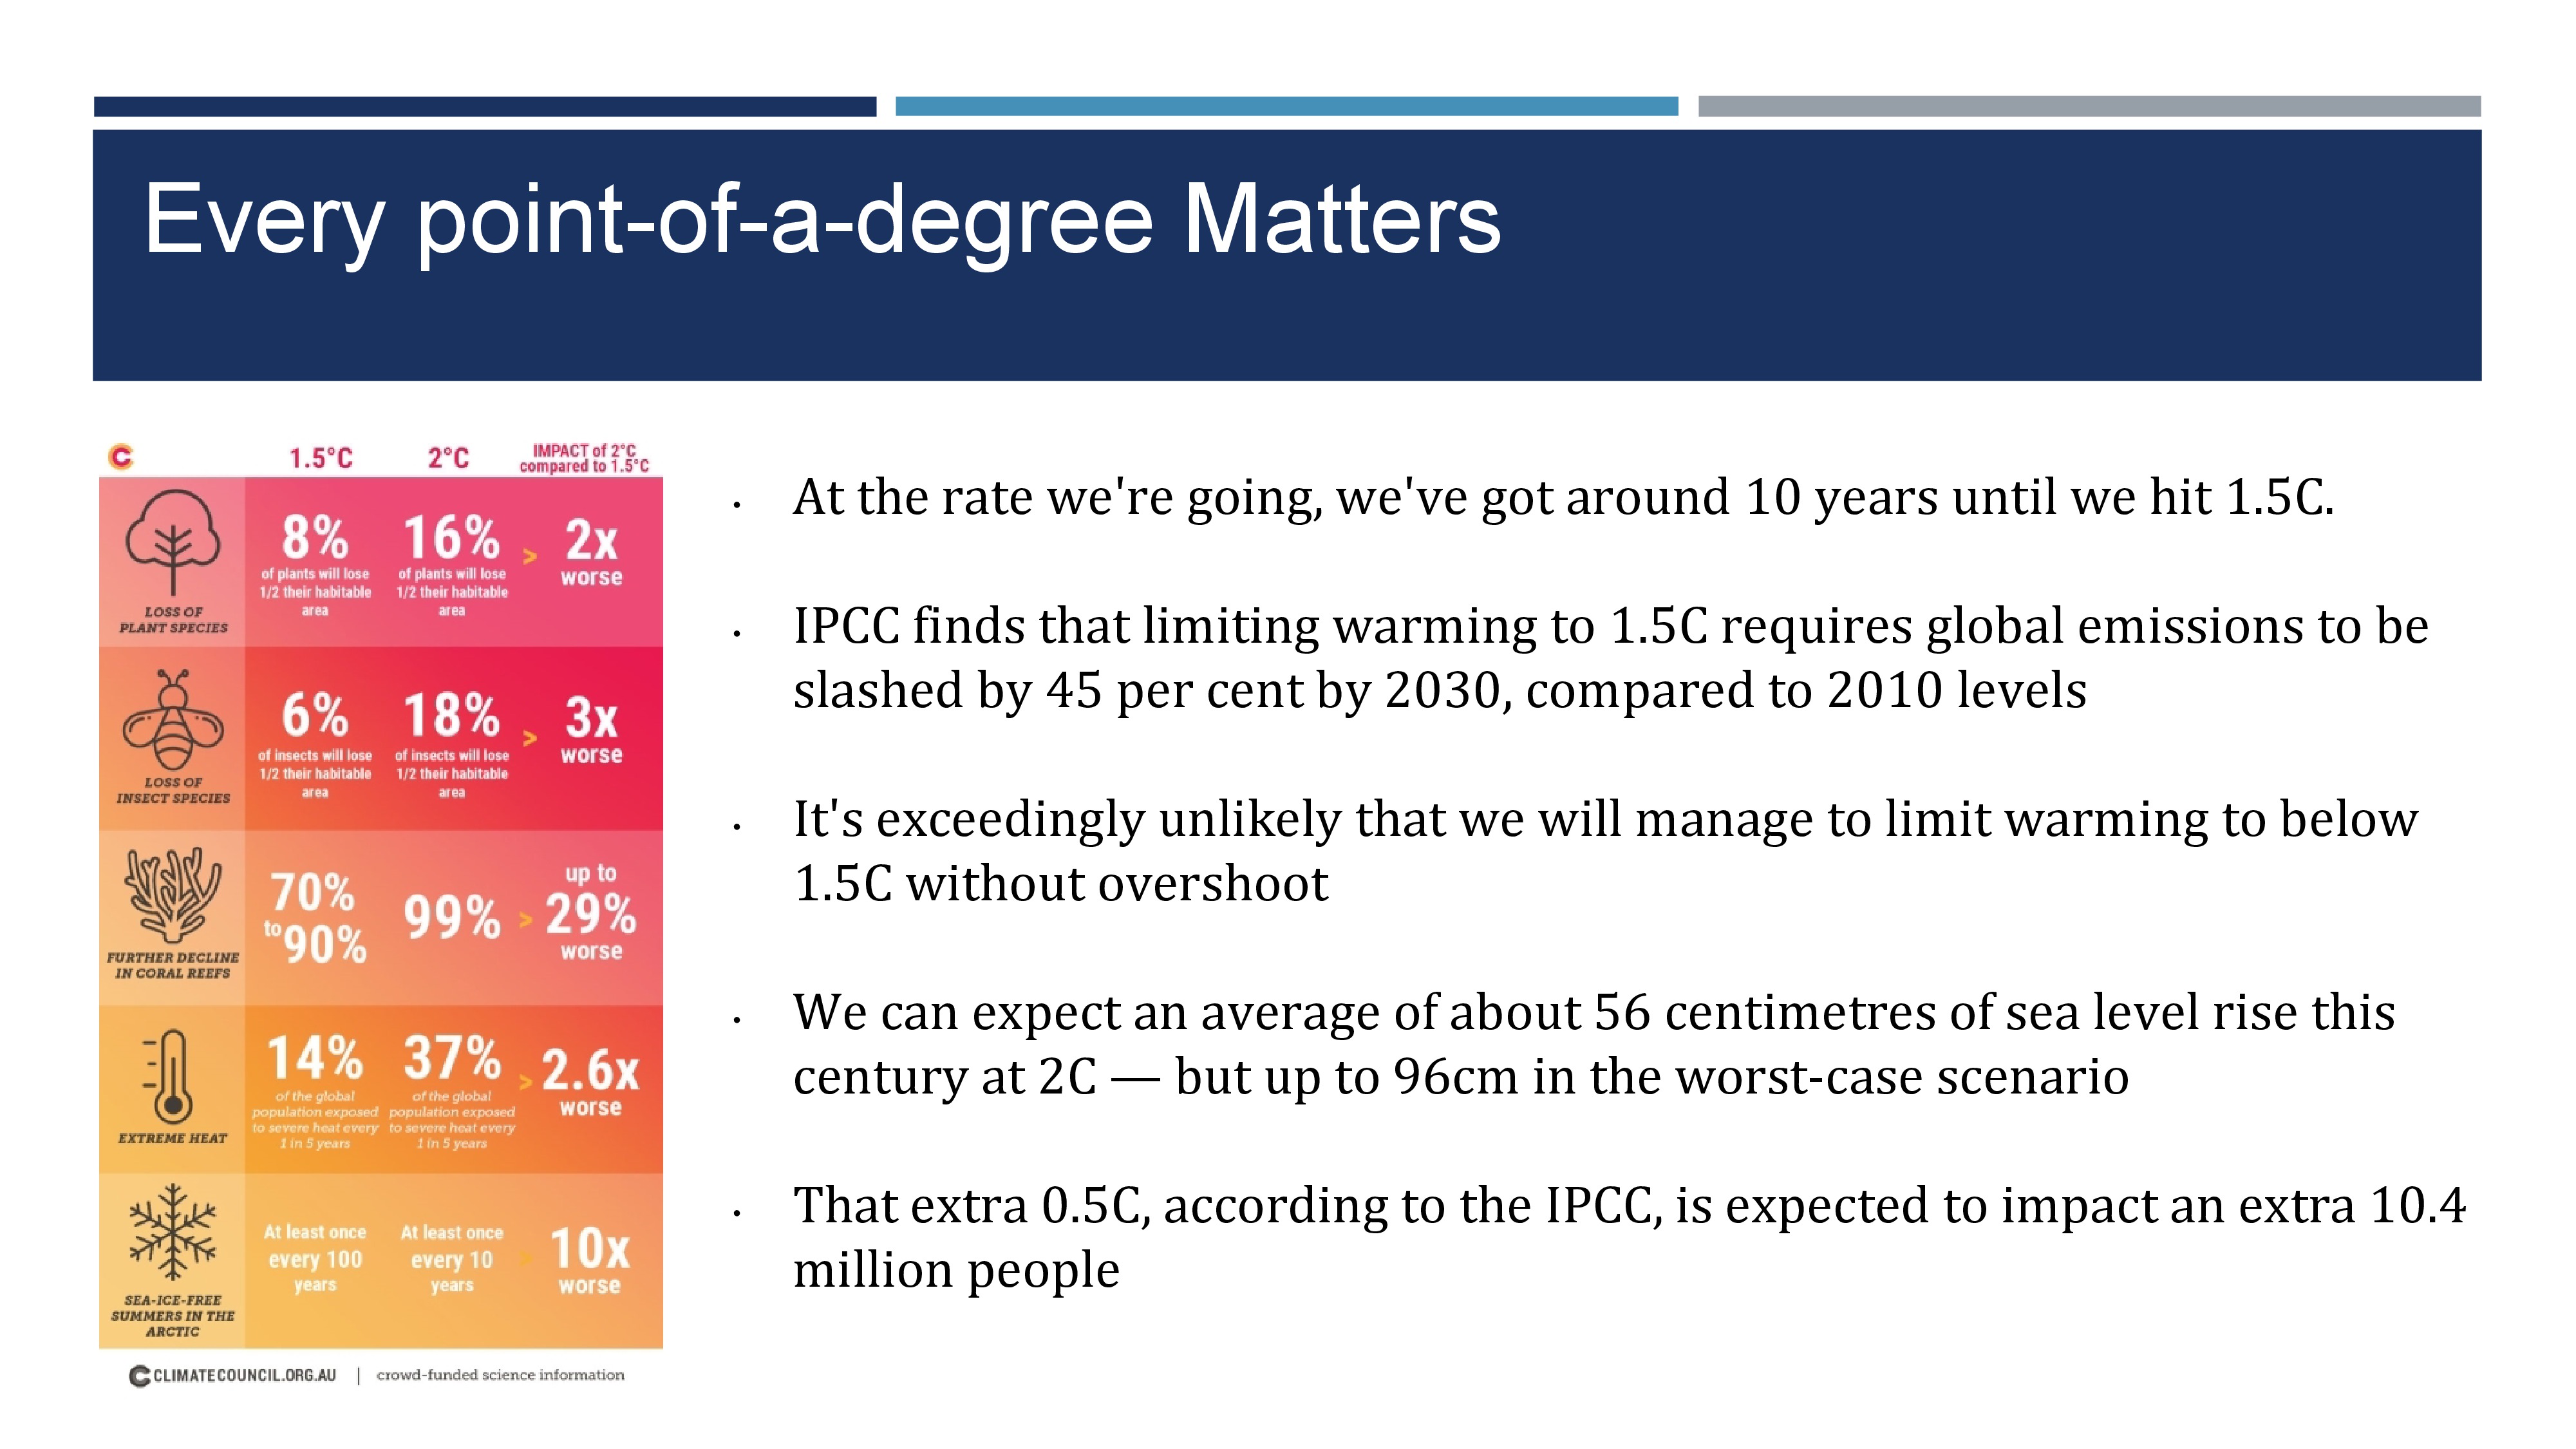
At the rate we're going, we've got around 10 years until we hit 1.5C.
IPCC finds that limiting warming to 1.5C requires global emissions to be slashed by 45 per cent by 2030, compared to 2010 levels
It's exceedingly unlikely that we will manage to limit warming to below 1.5C without overshoot
We can expect an average of about 56 centimetres of sea level rise this century at 2C — but up to 96cm in the worst-case scenario
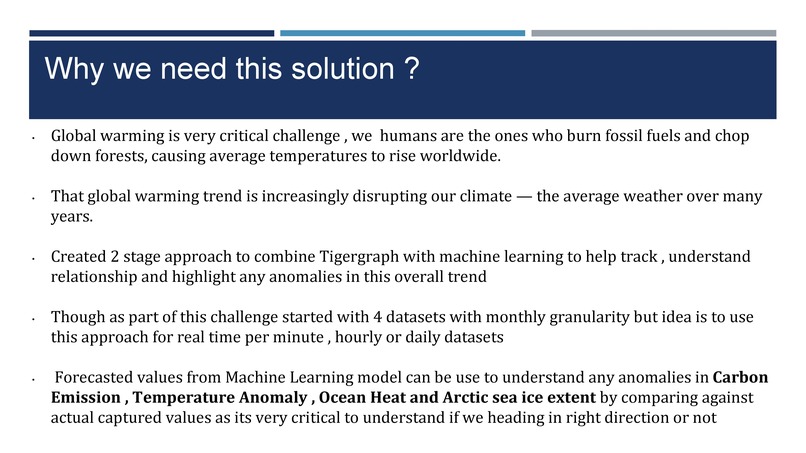
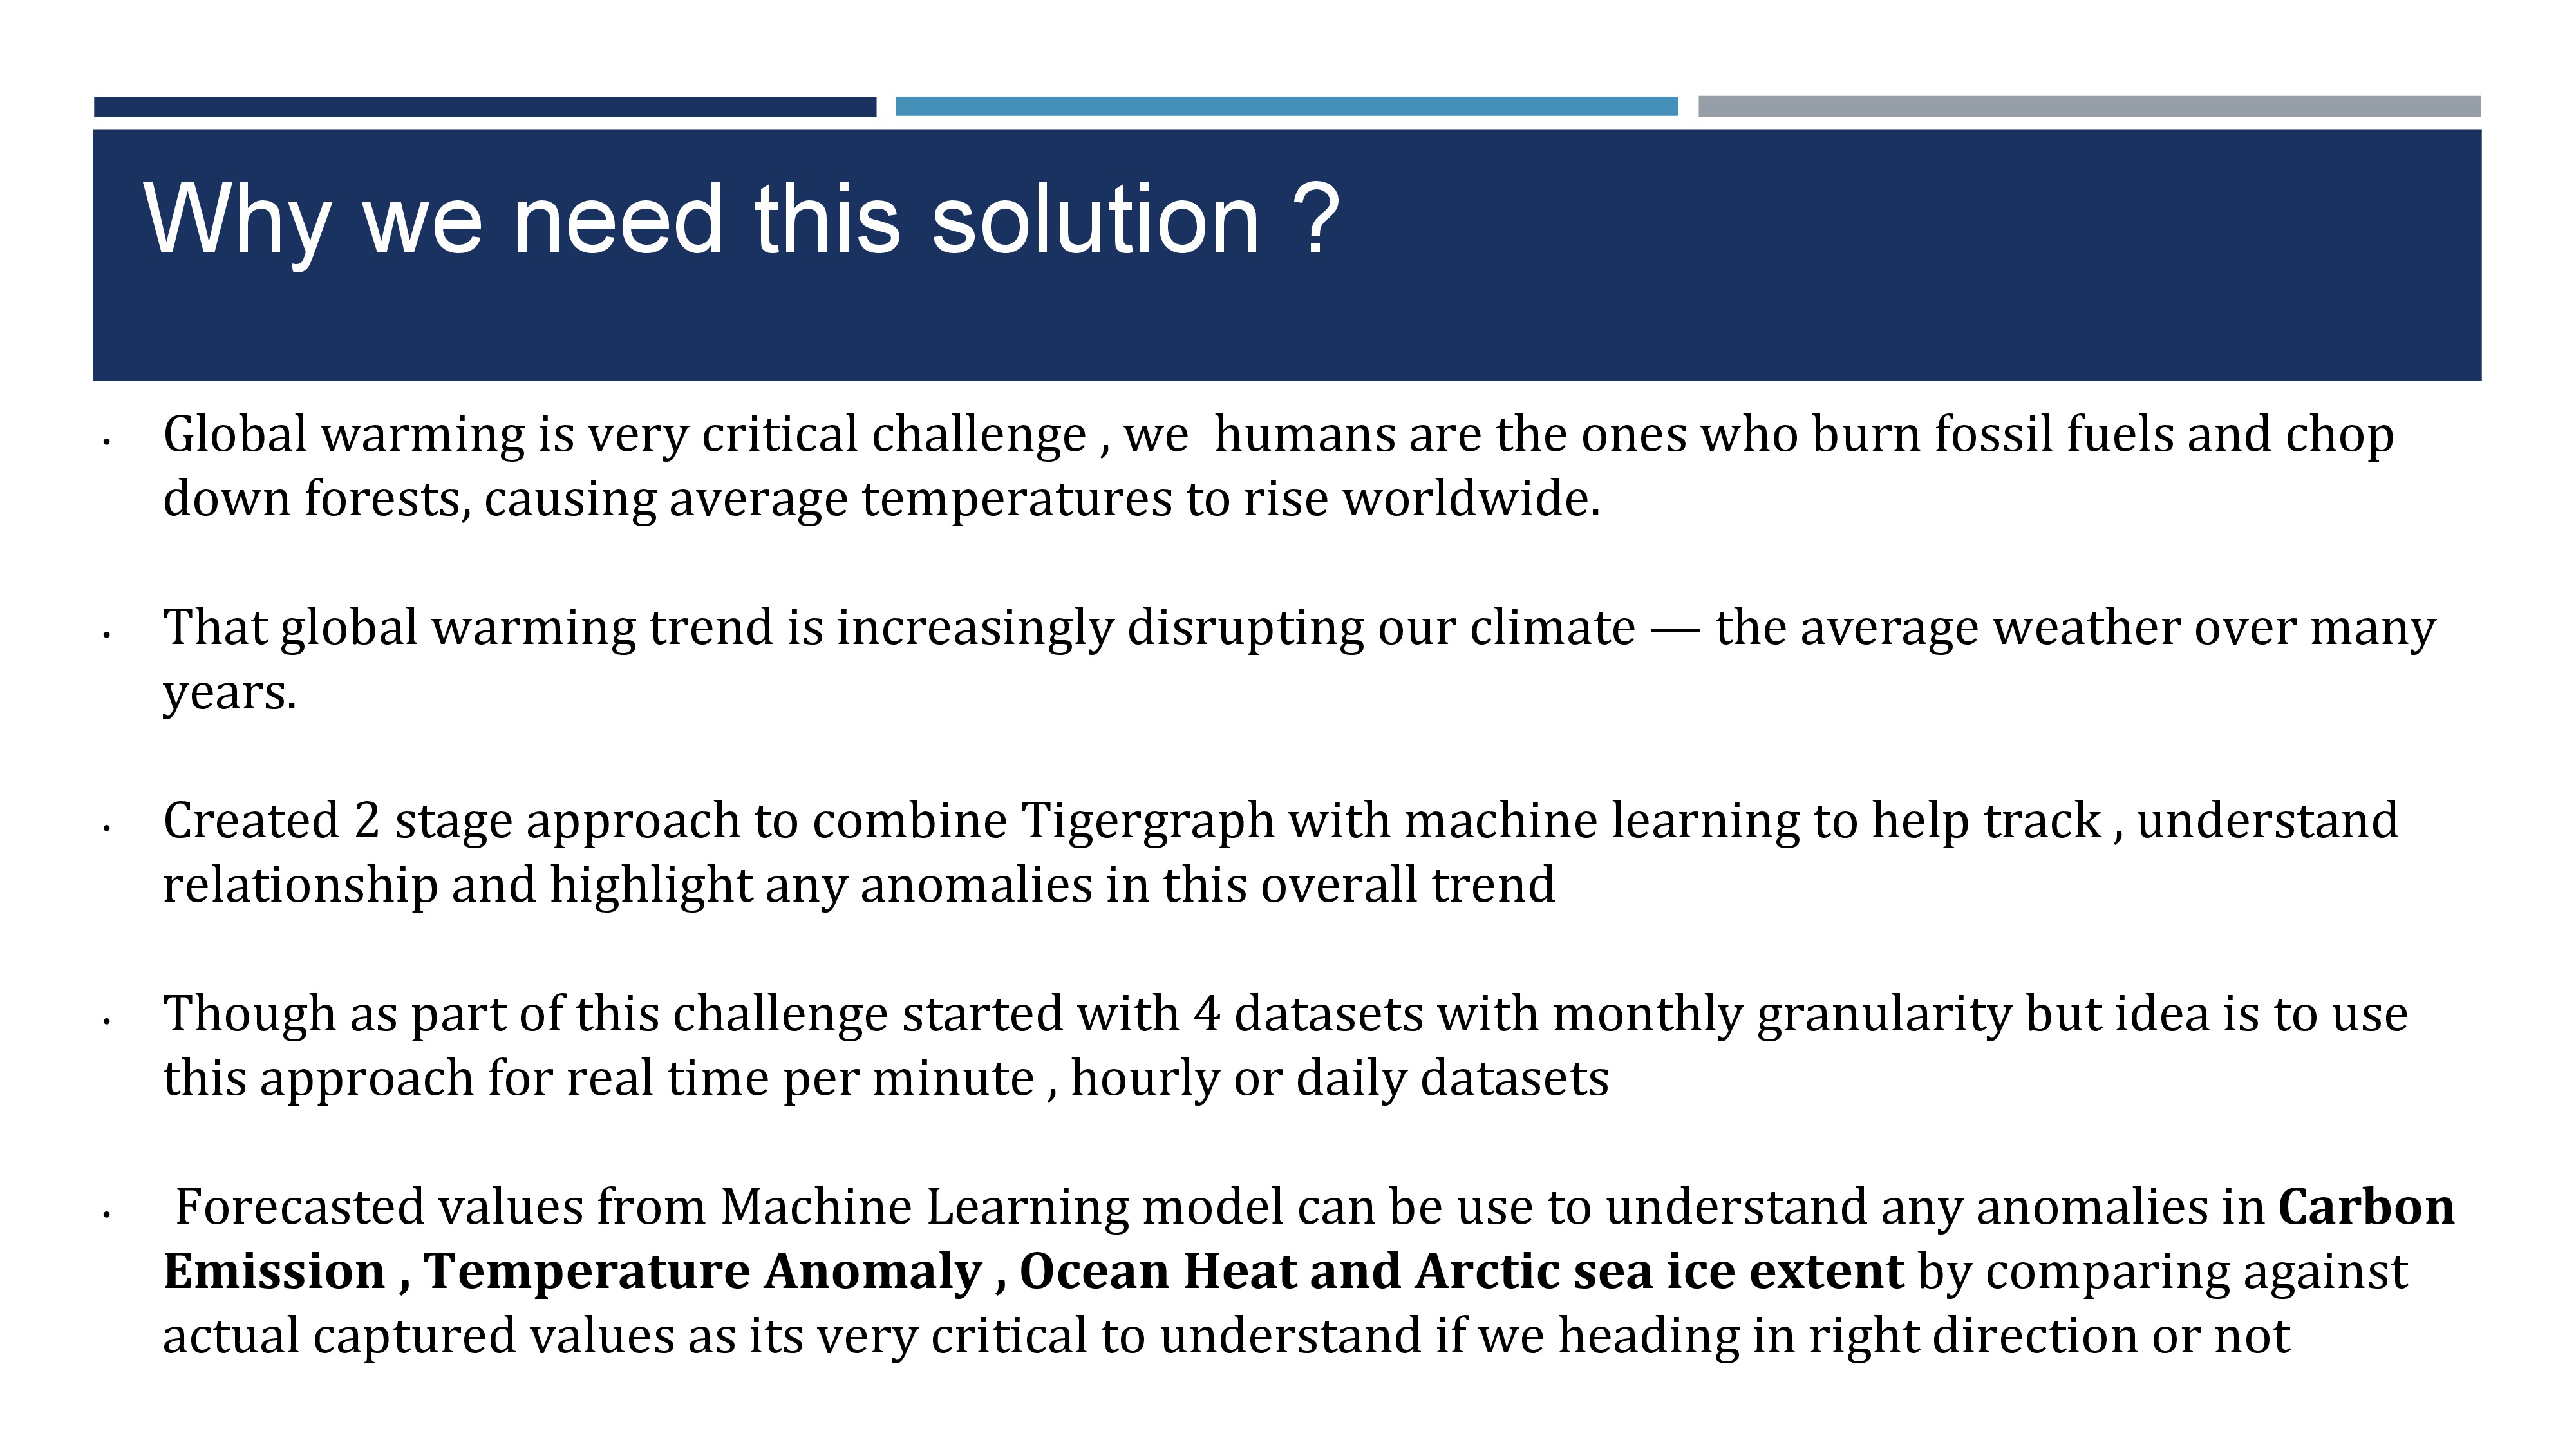
That extra 0.5C, according to the IPCC, is expected to impact an extra 10.4 million people Global warming is very critical challenge , we humans are the ones who burn fossil fuels and chop down forests, causing average temperatures to rise worldwide.
That global warming trend is increasingly disrupting our climate — the average weather over many years.
What it does ?
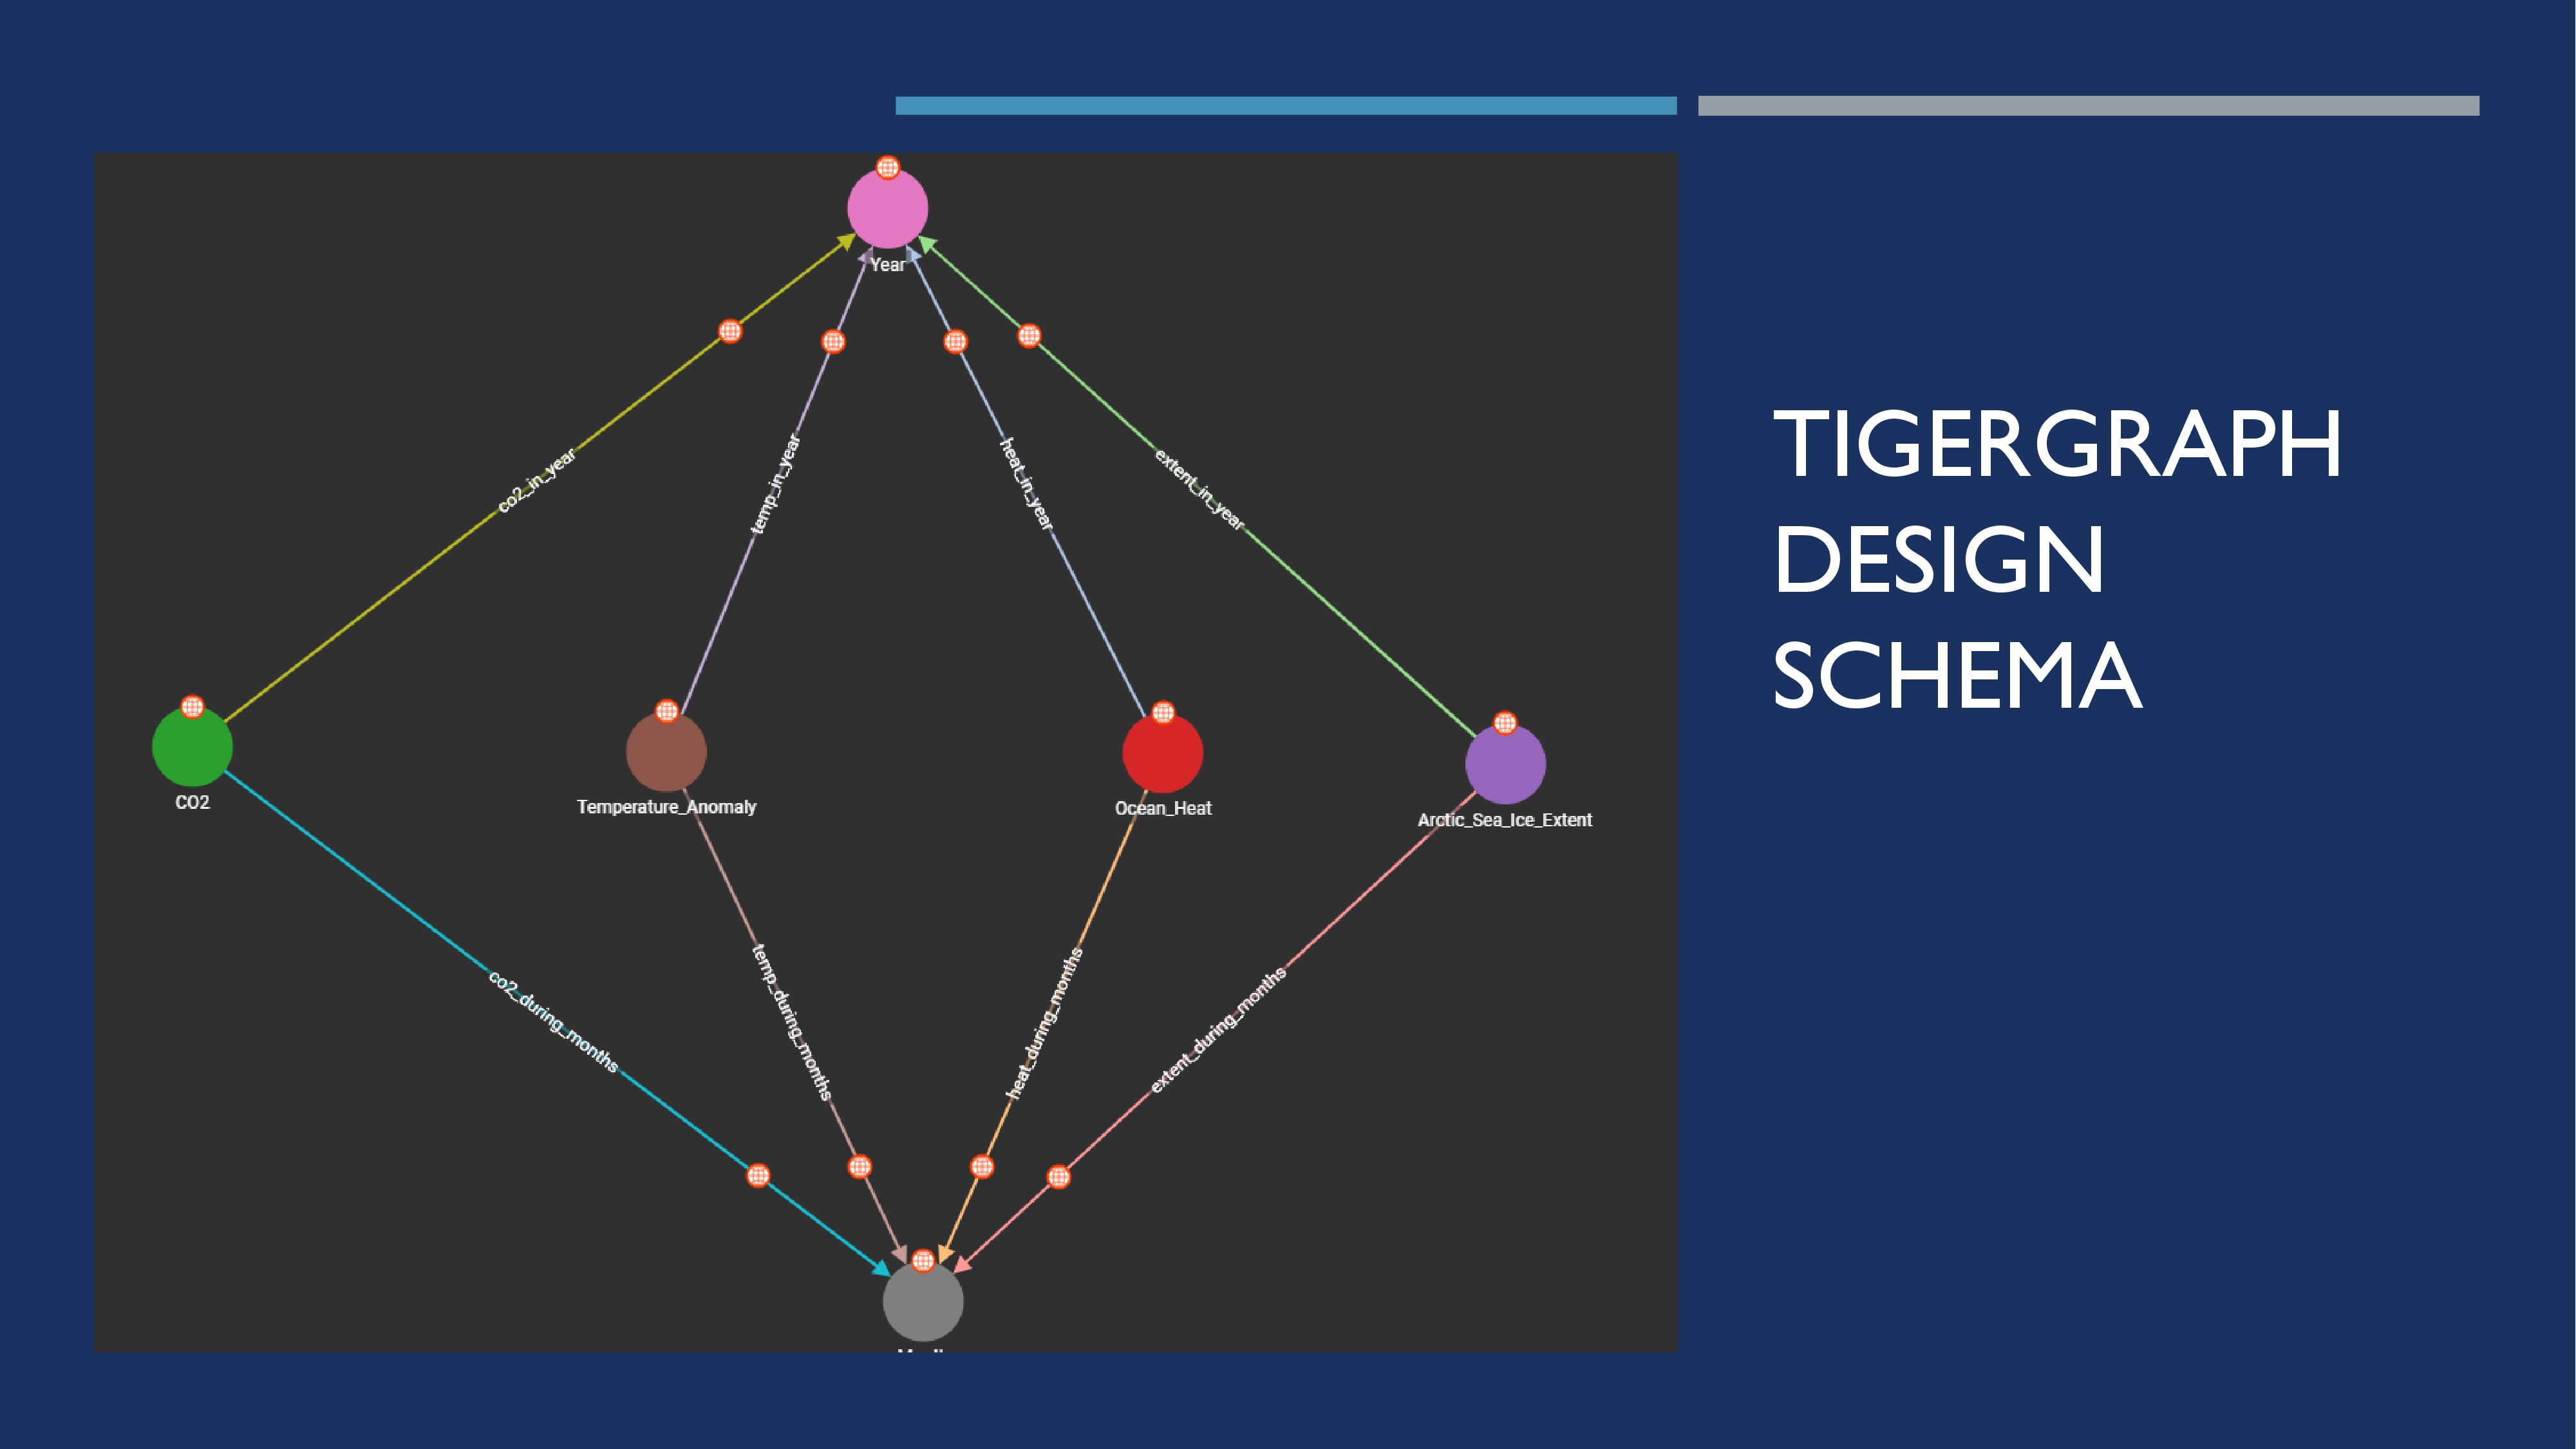
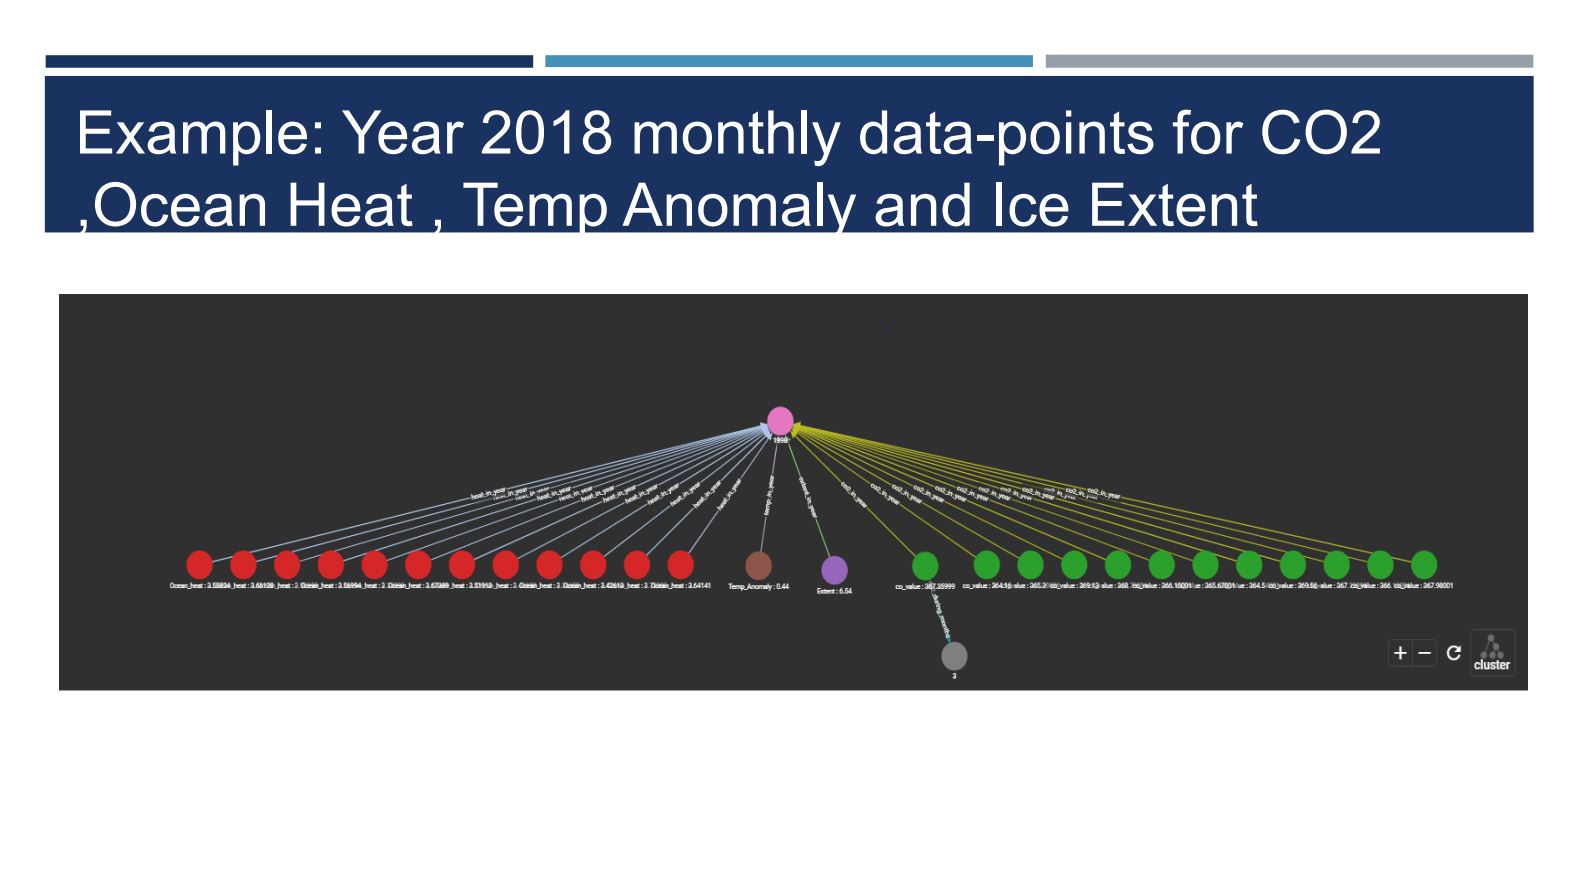
Created 2 stage approach to combine Tigergraph with machine learning to help track , understand relationship and highlight any anomalies in this overall trend
Example Search for 2018 Datapoints
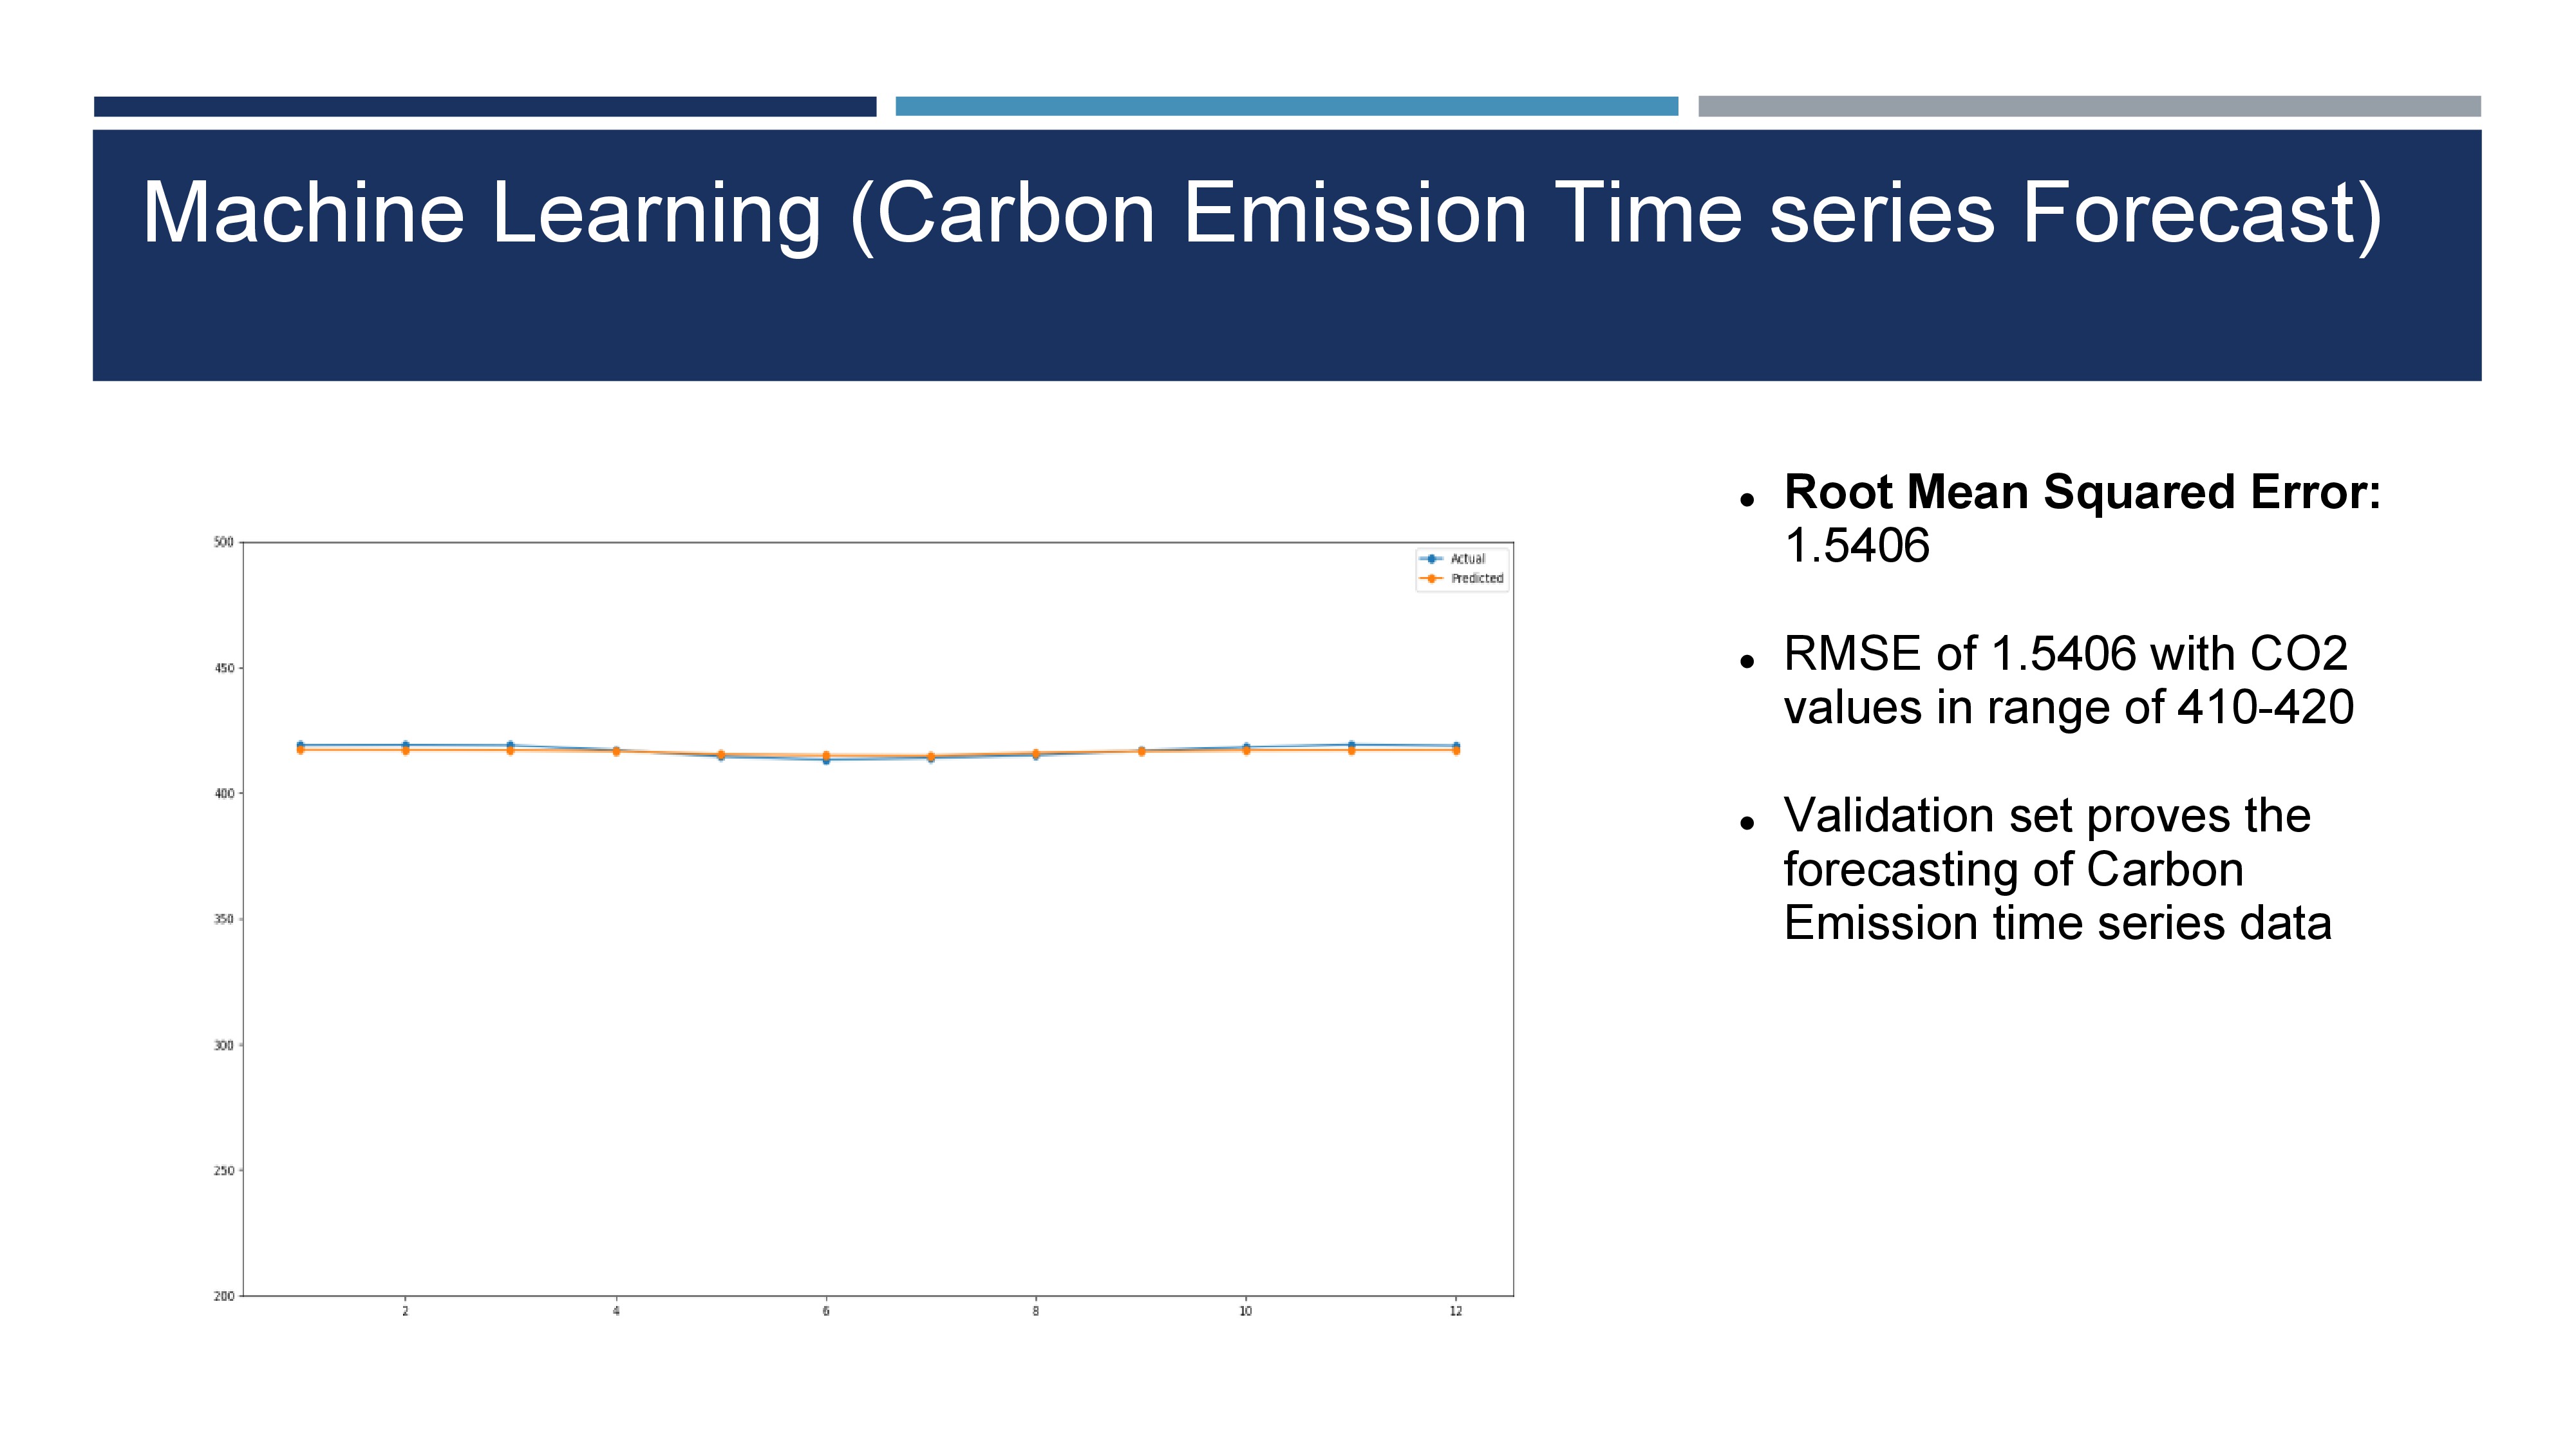
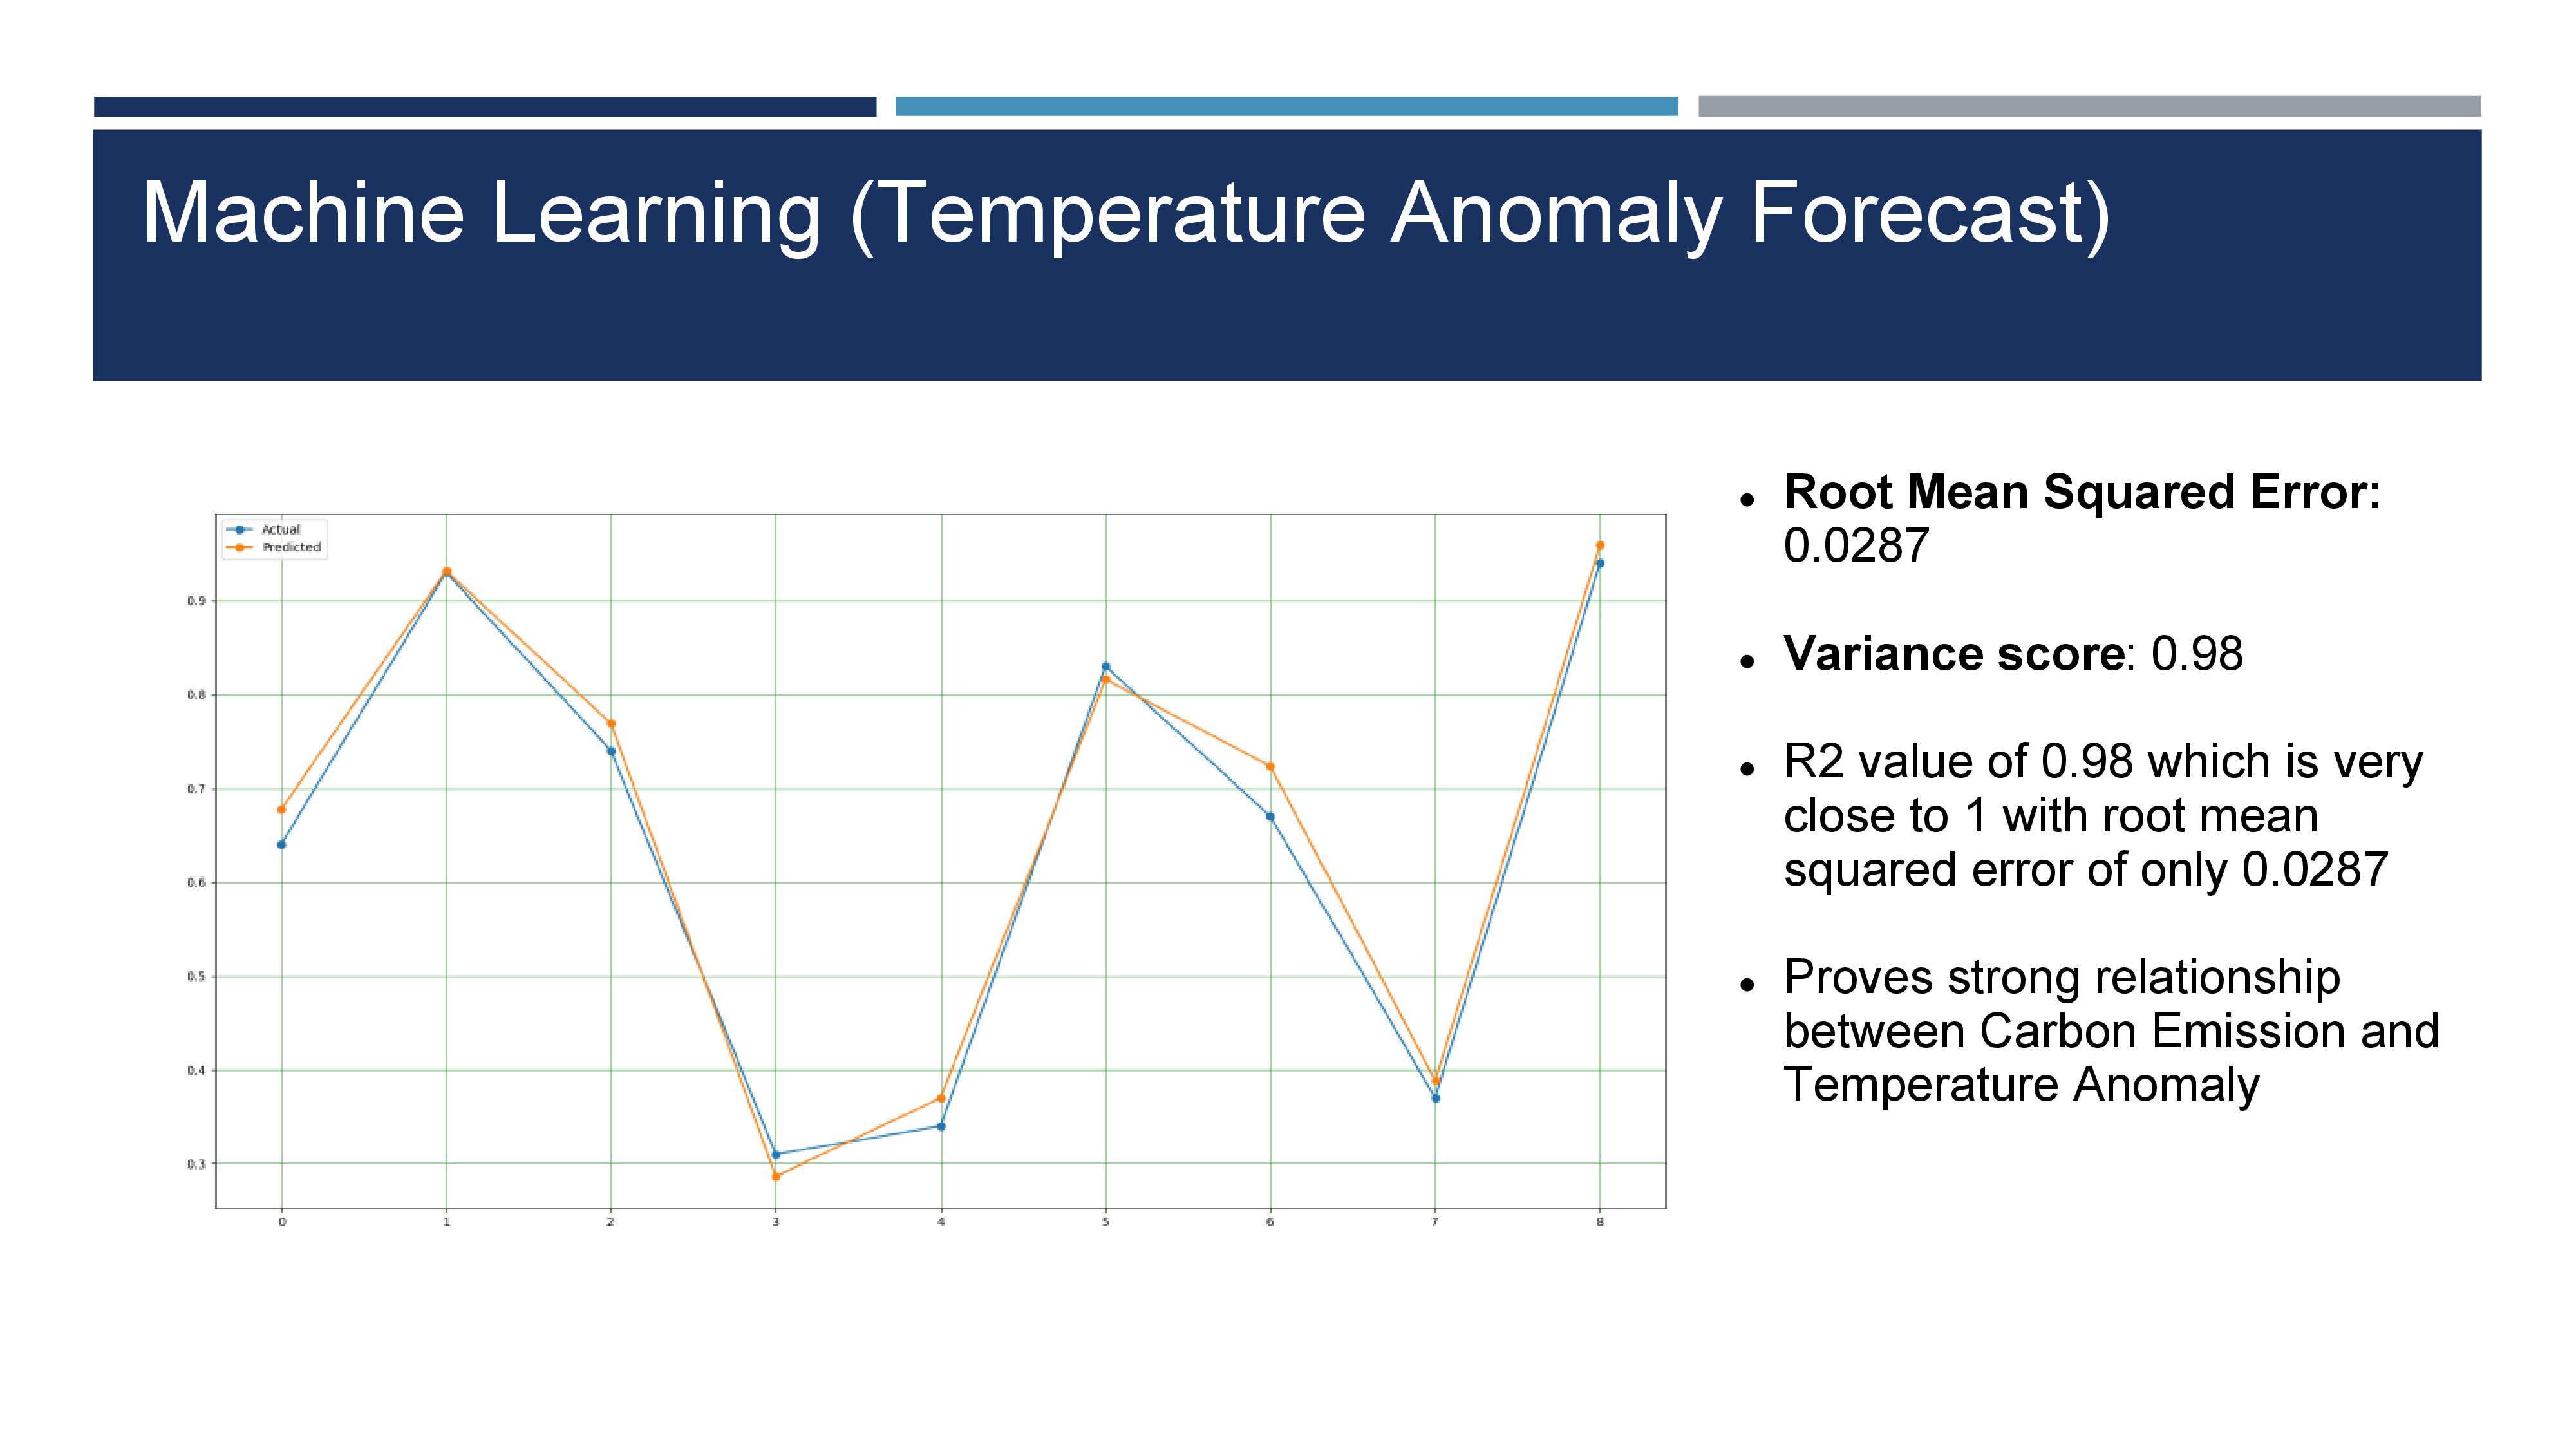
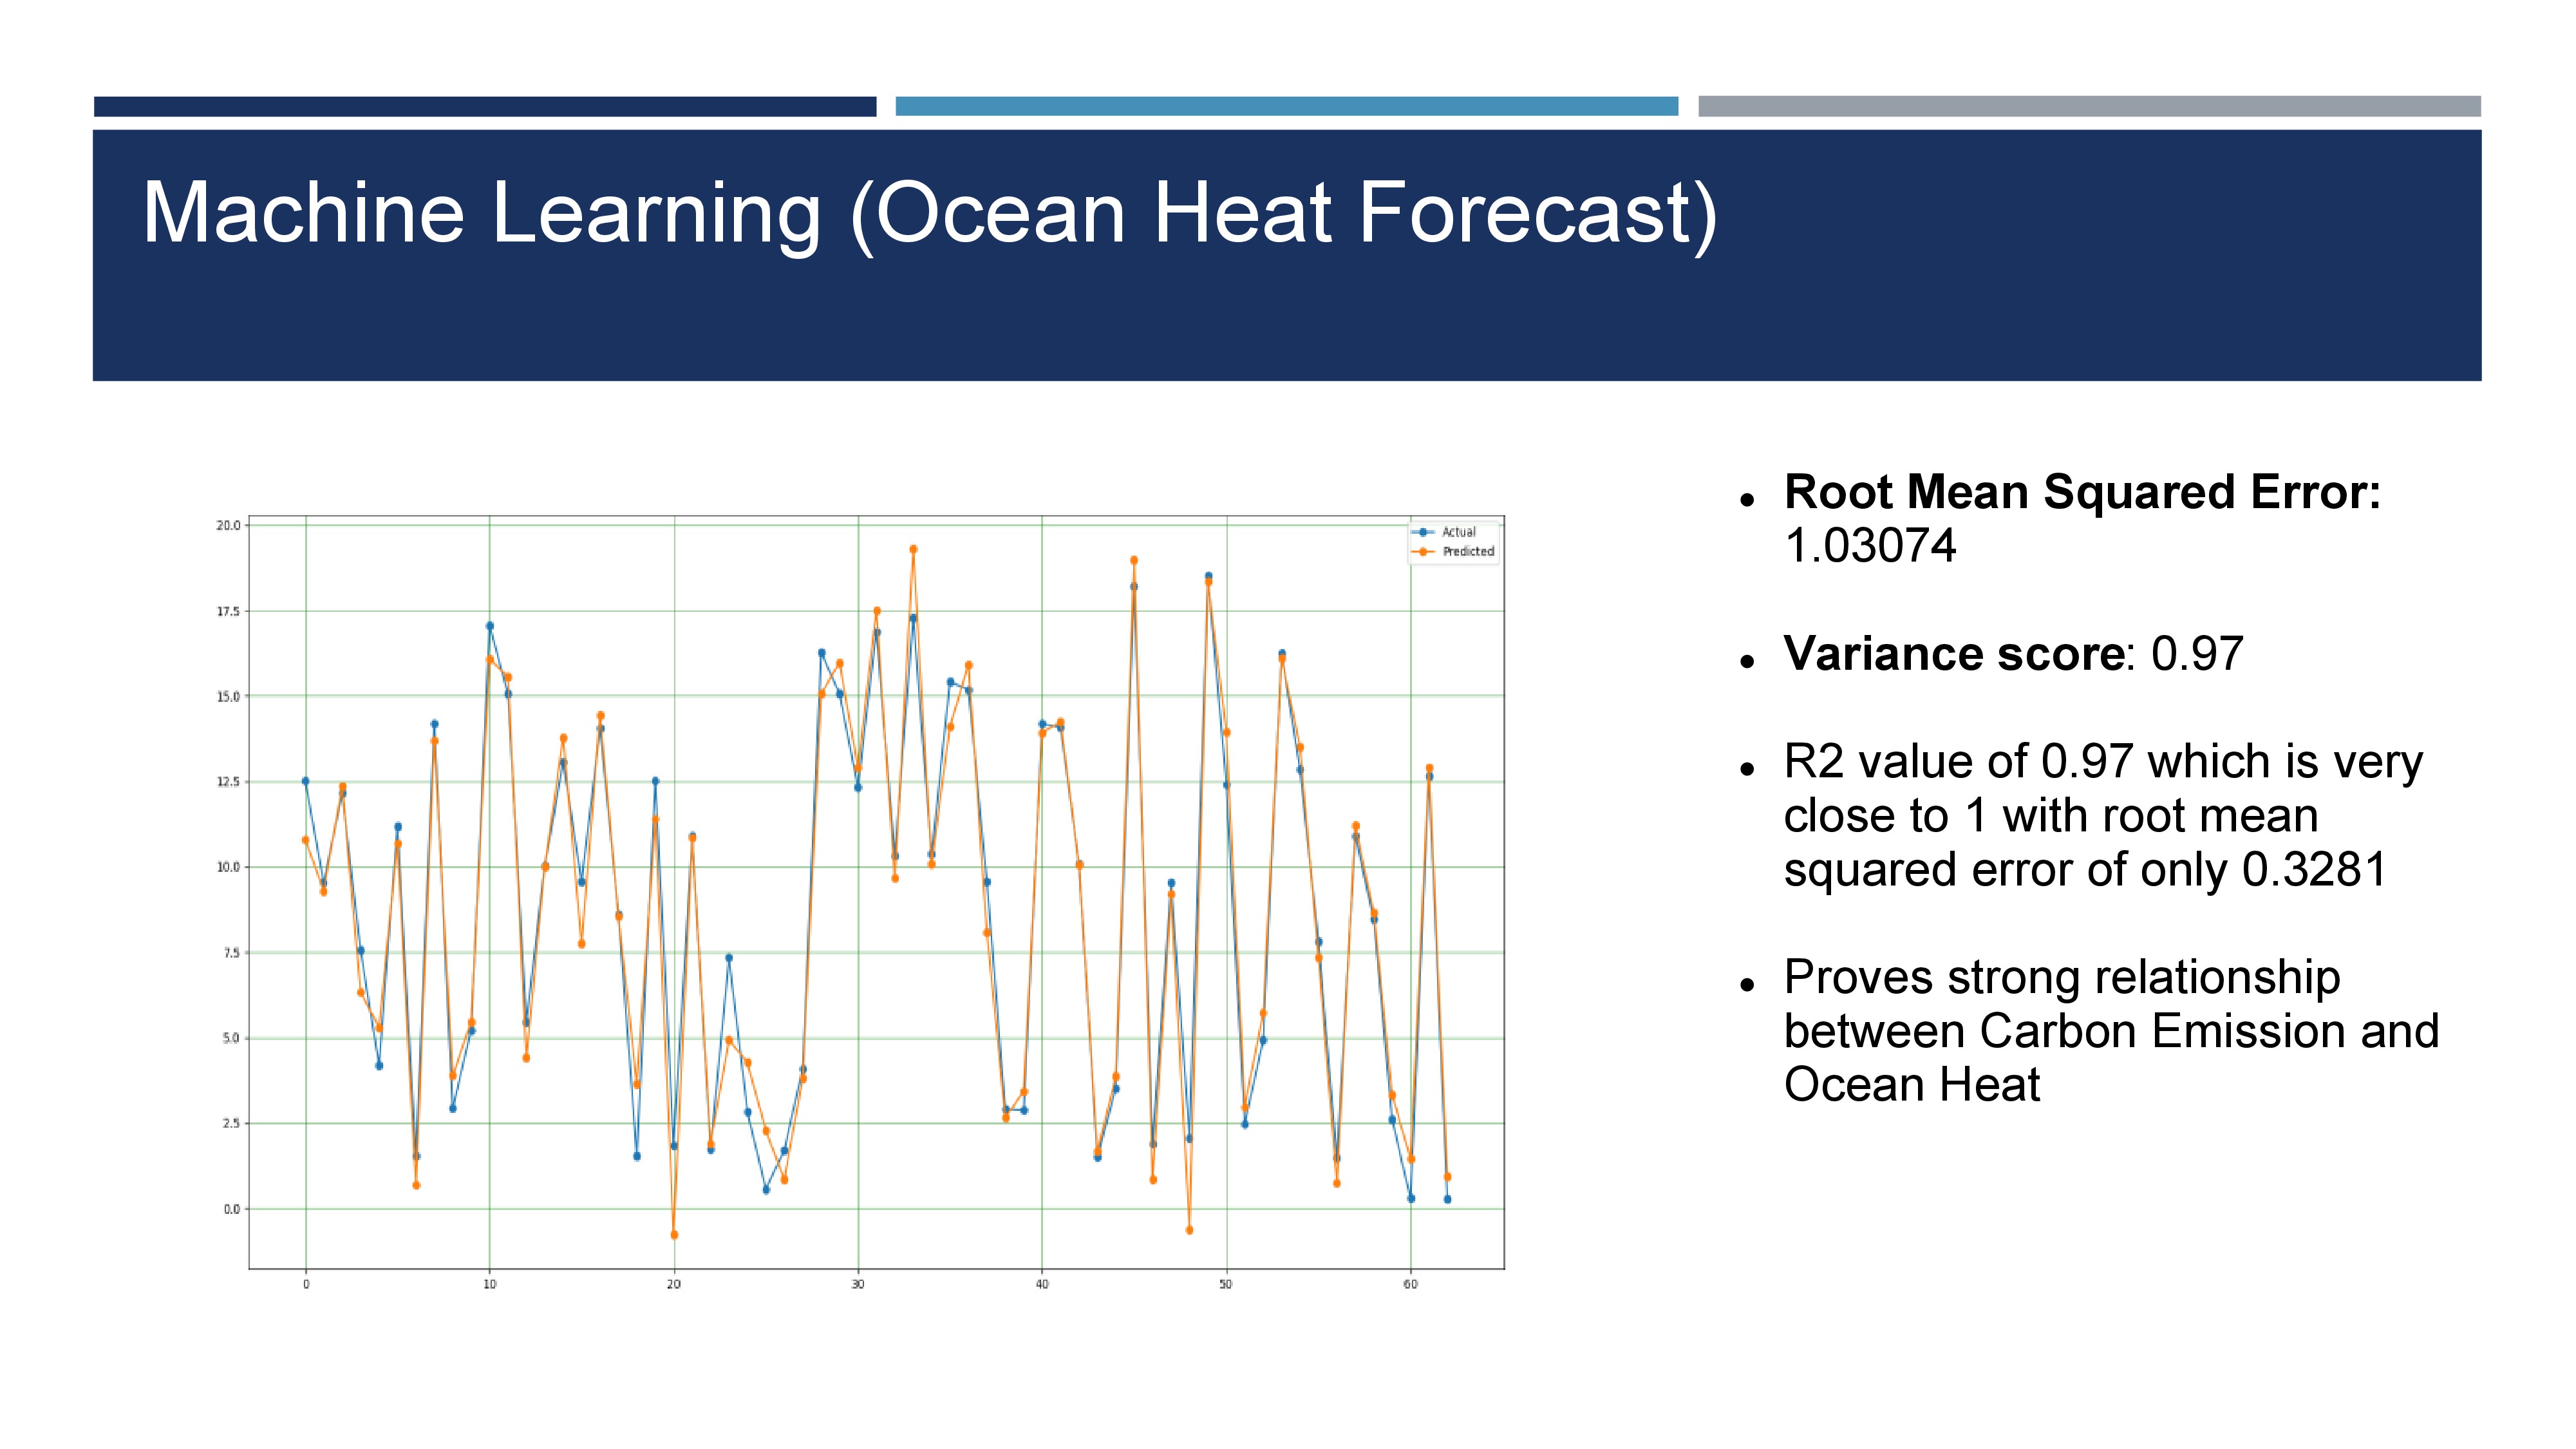
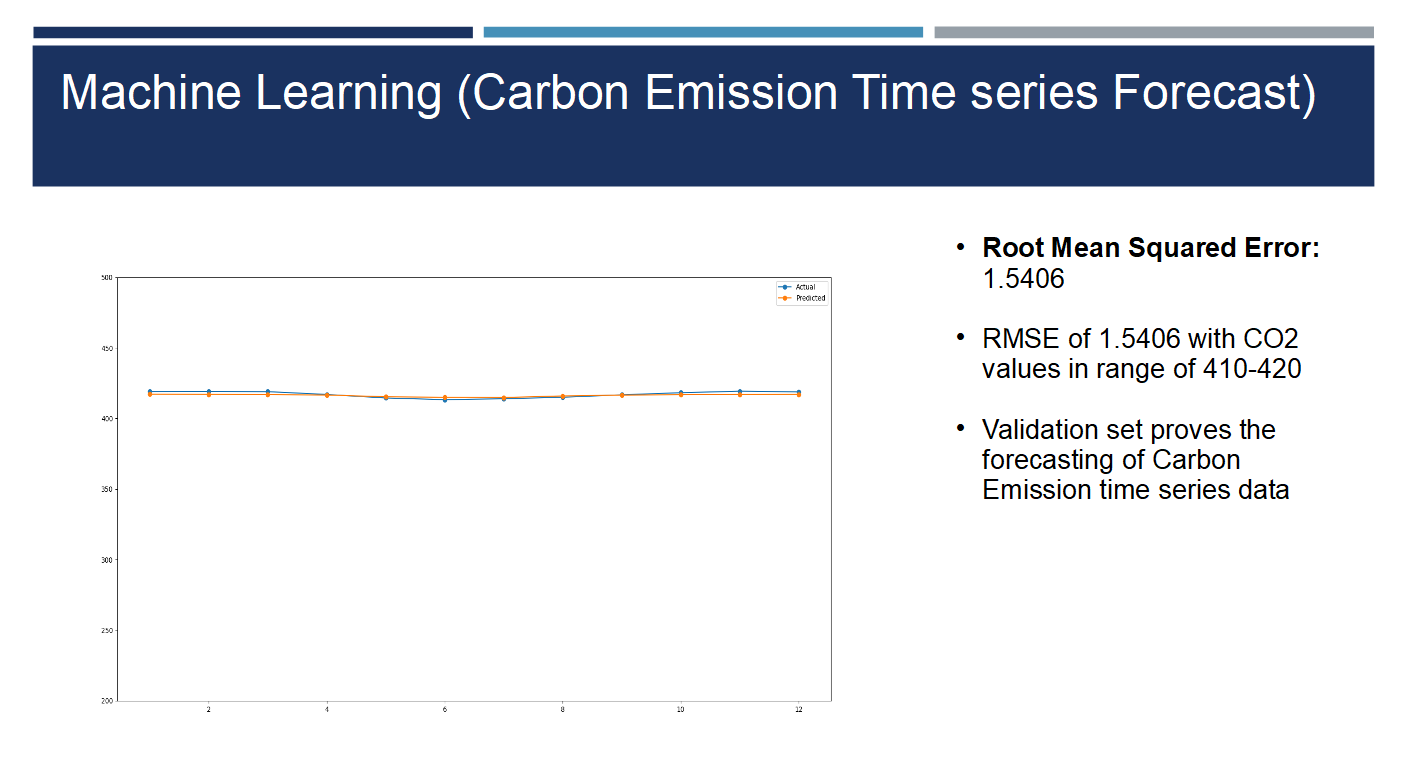
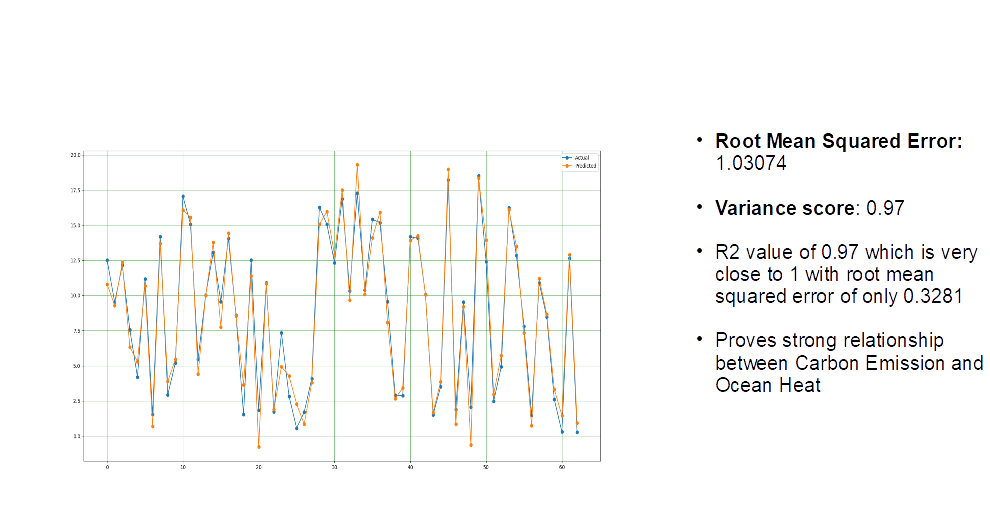
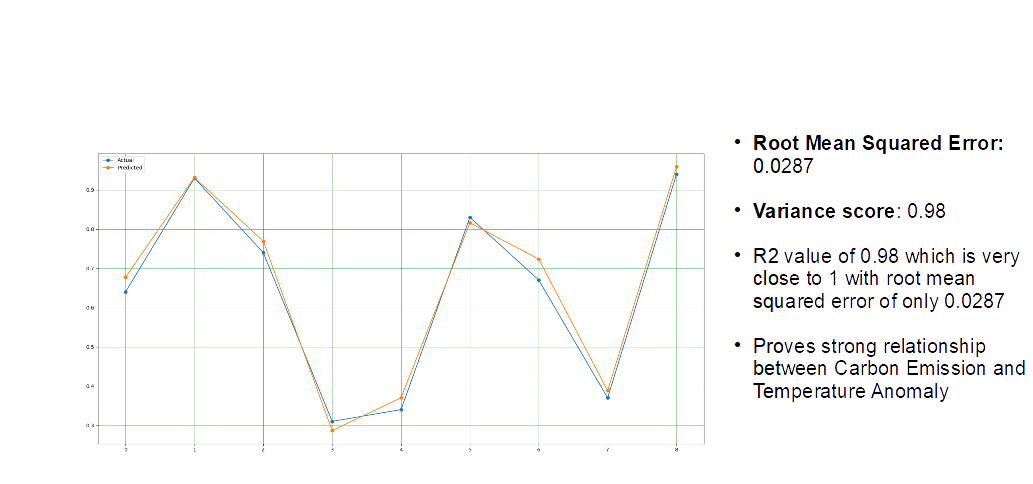
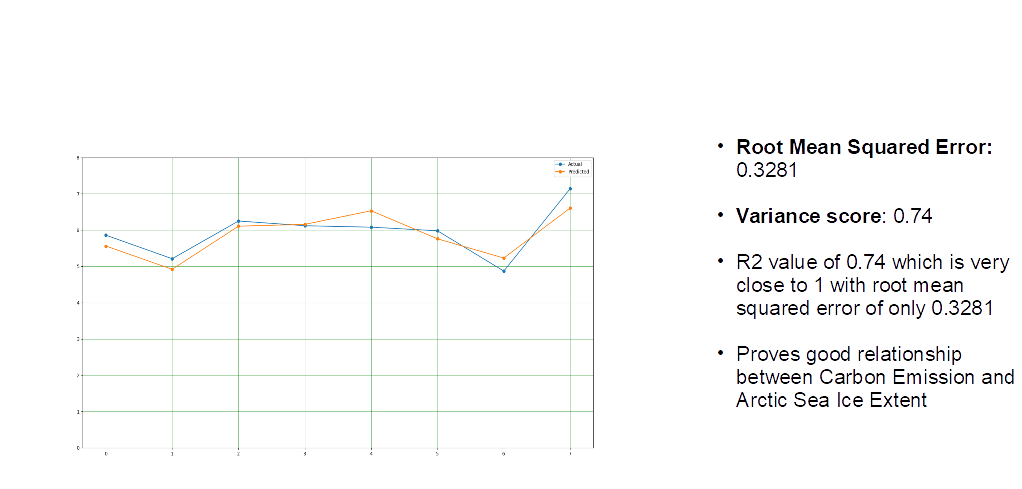
Forecasted values from Machine Learning model can be use to understand any anomalies in Carbon Emission , Temperature Anomaly , Ocean Heat and Arctic sea ice extent by comparing against actual captured values as its very critical to understand if we heading in right direction or not
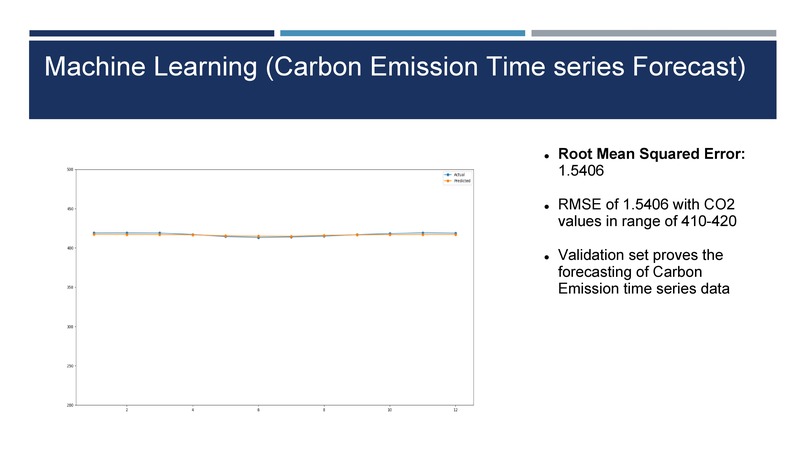
Carbon Emission Timeseries Forecast
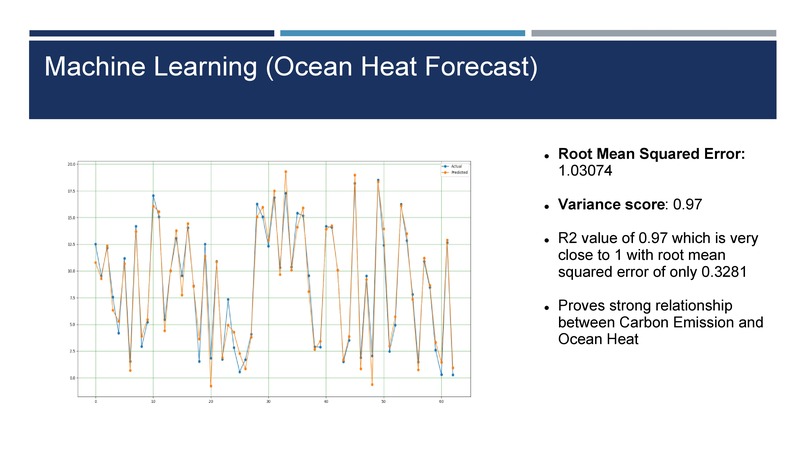
Ocean Heat Forecast based on Carbon Emission
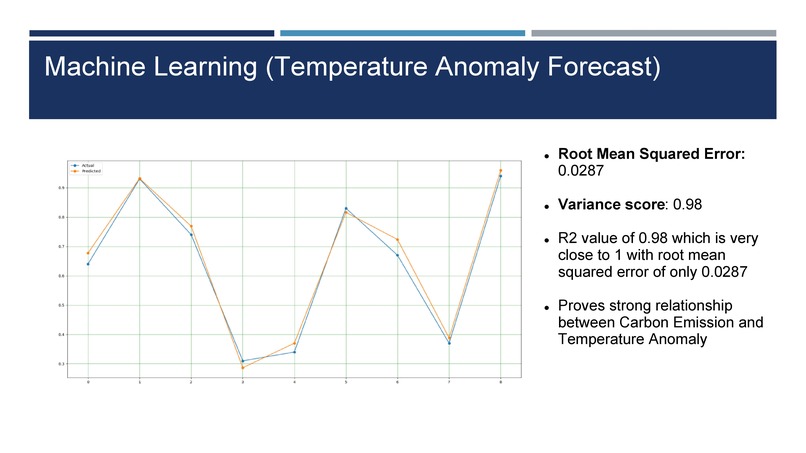
Temperature Anomaly Forecast based on Carbon Emission
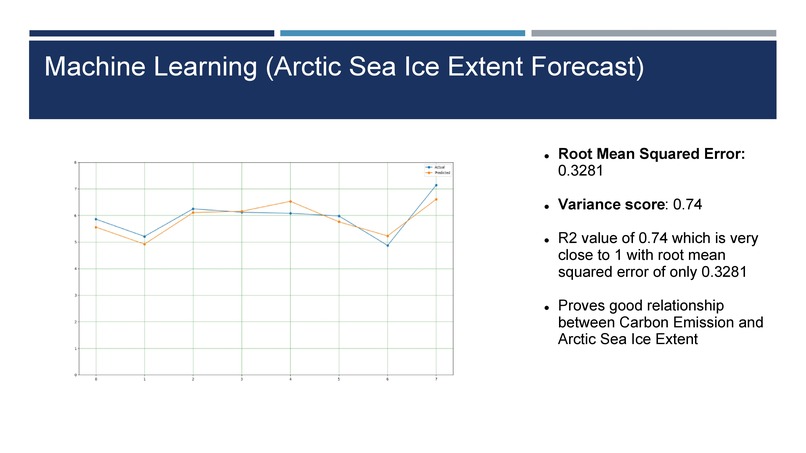
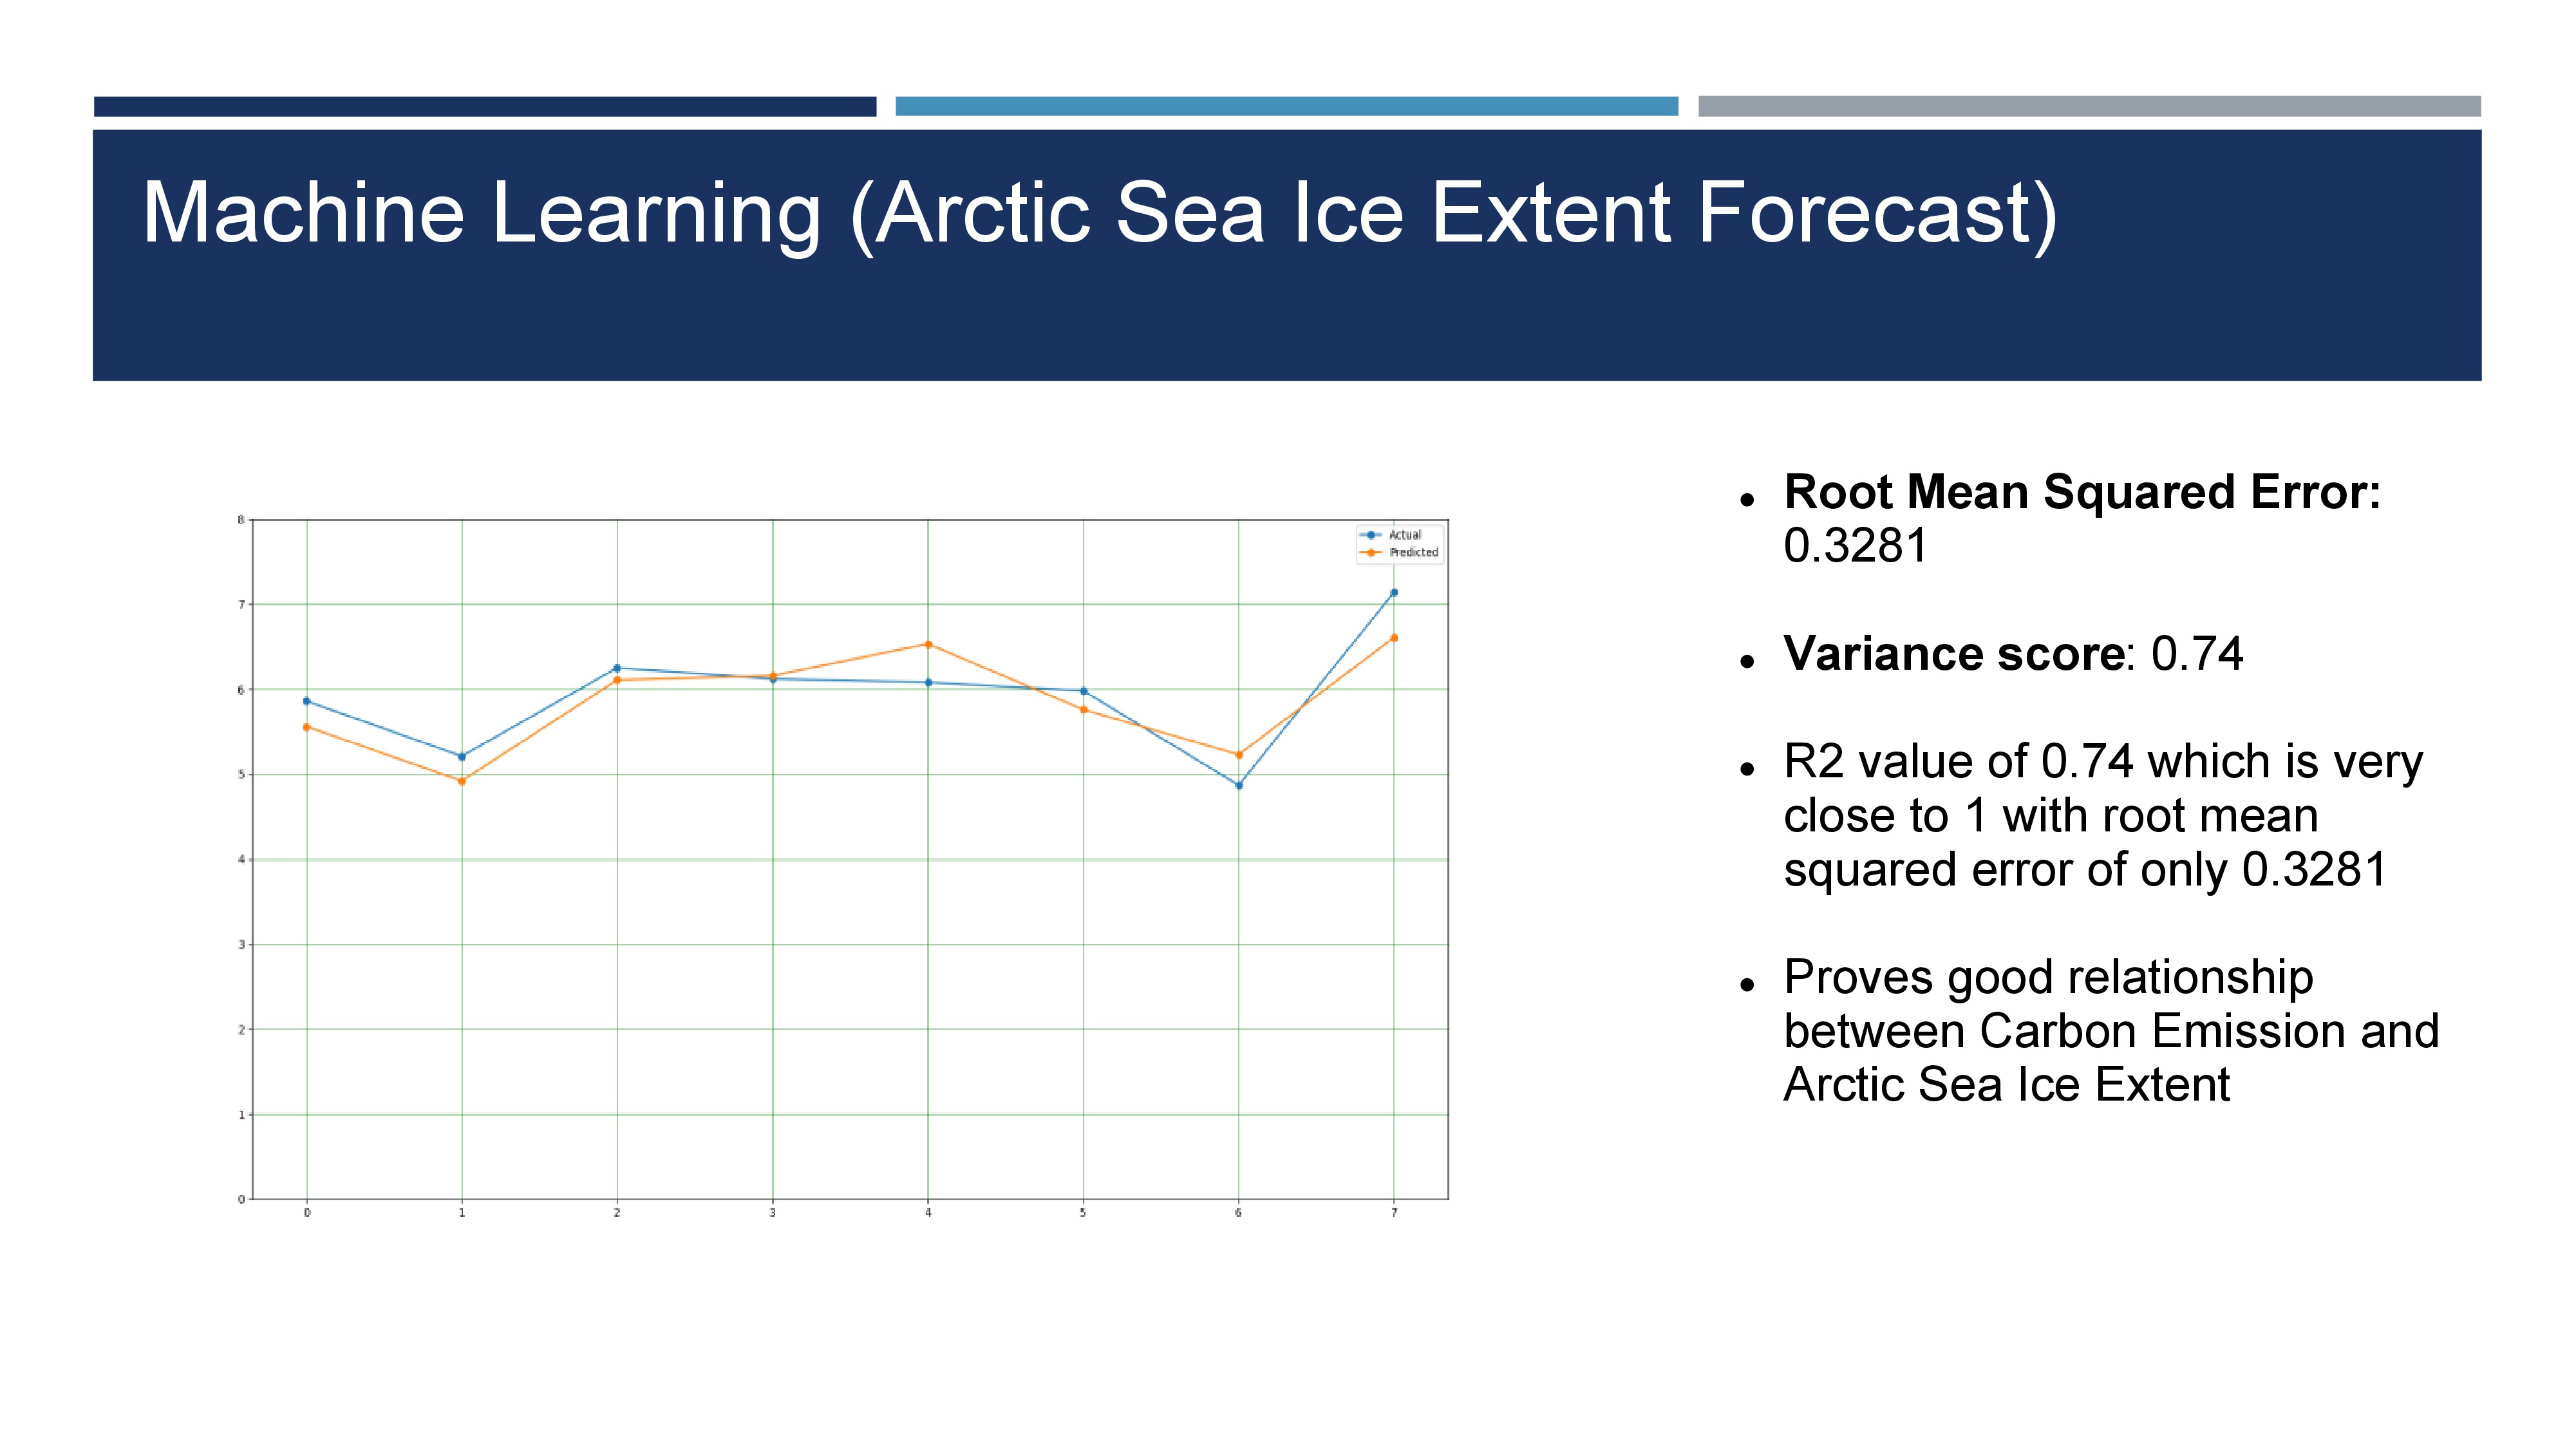
Arctic Sea Ice Extent Forecast based on Carbon Emission
How I built it?
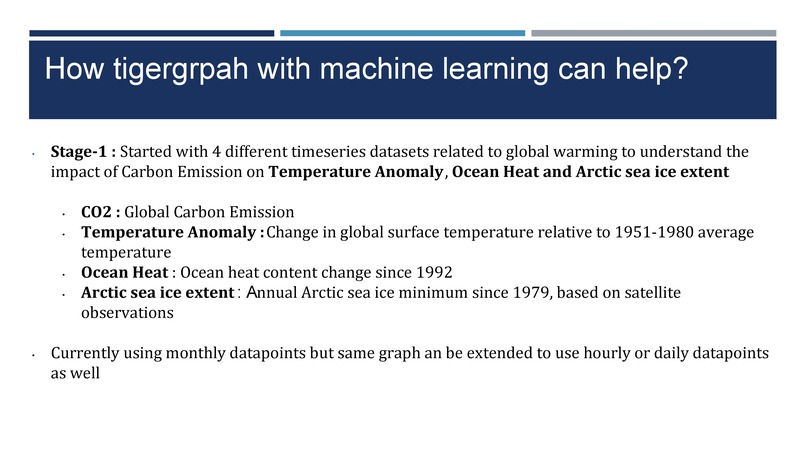
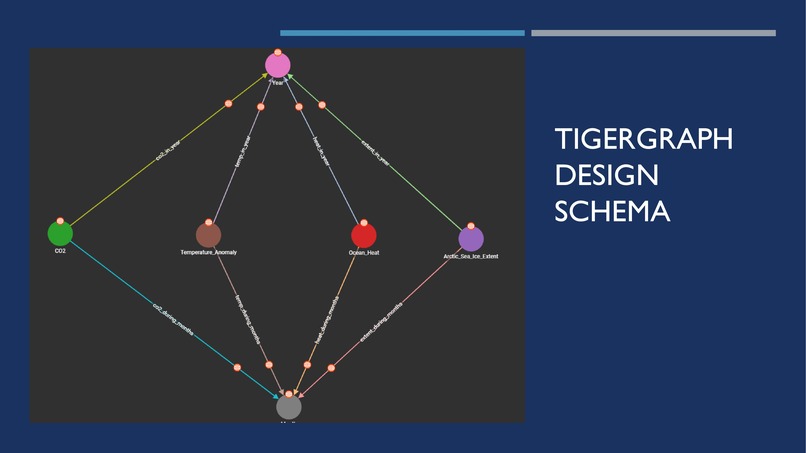
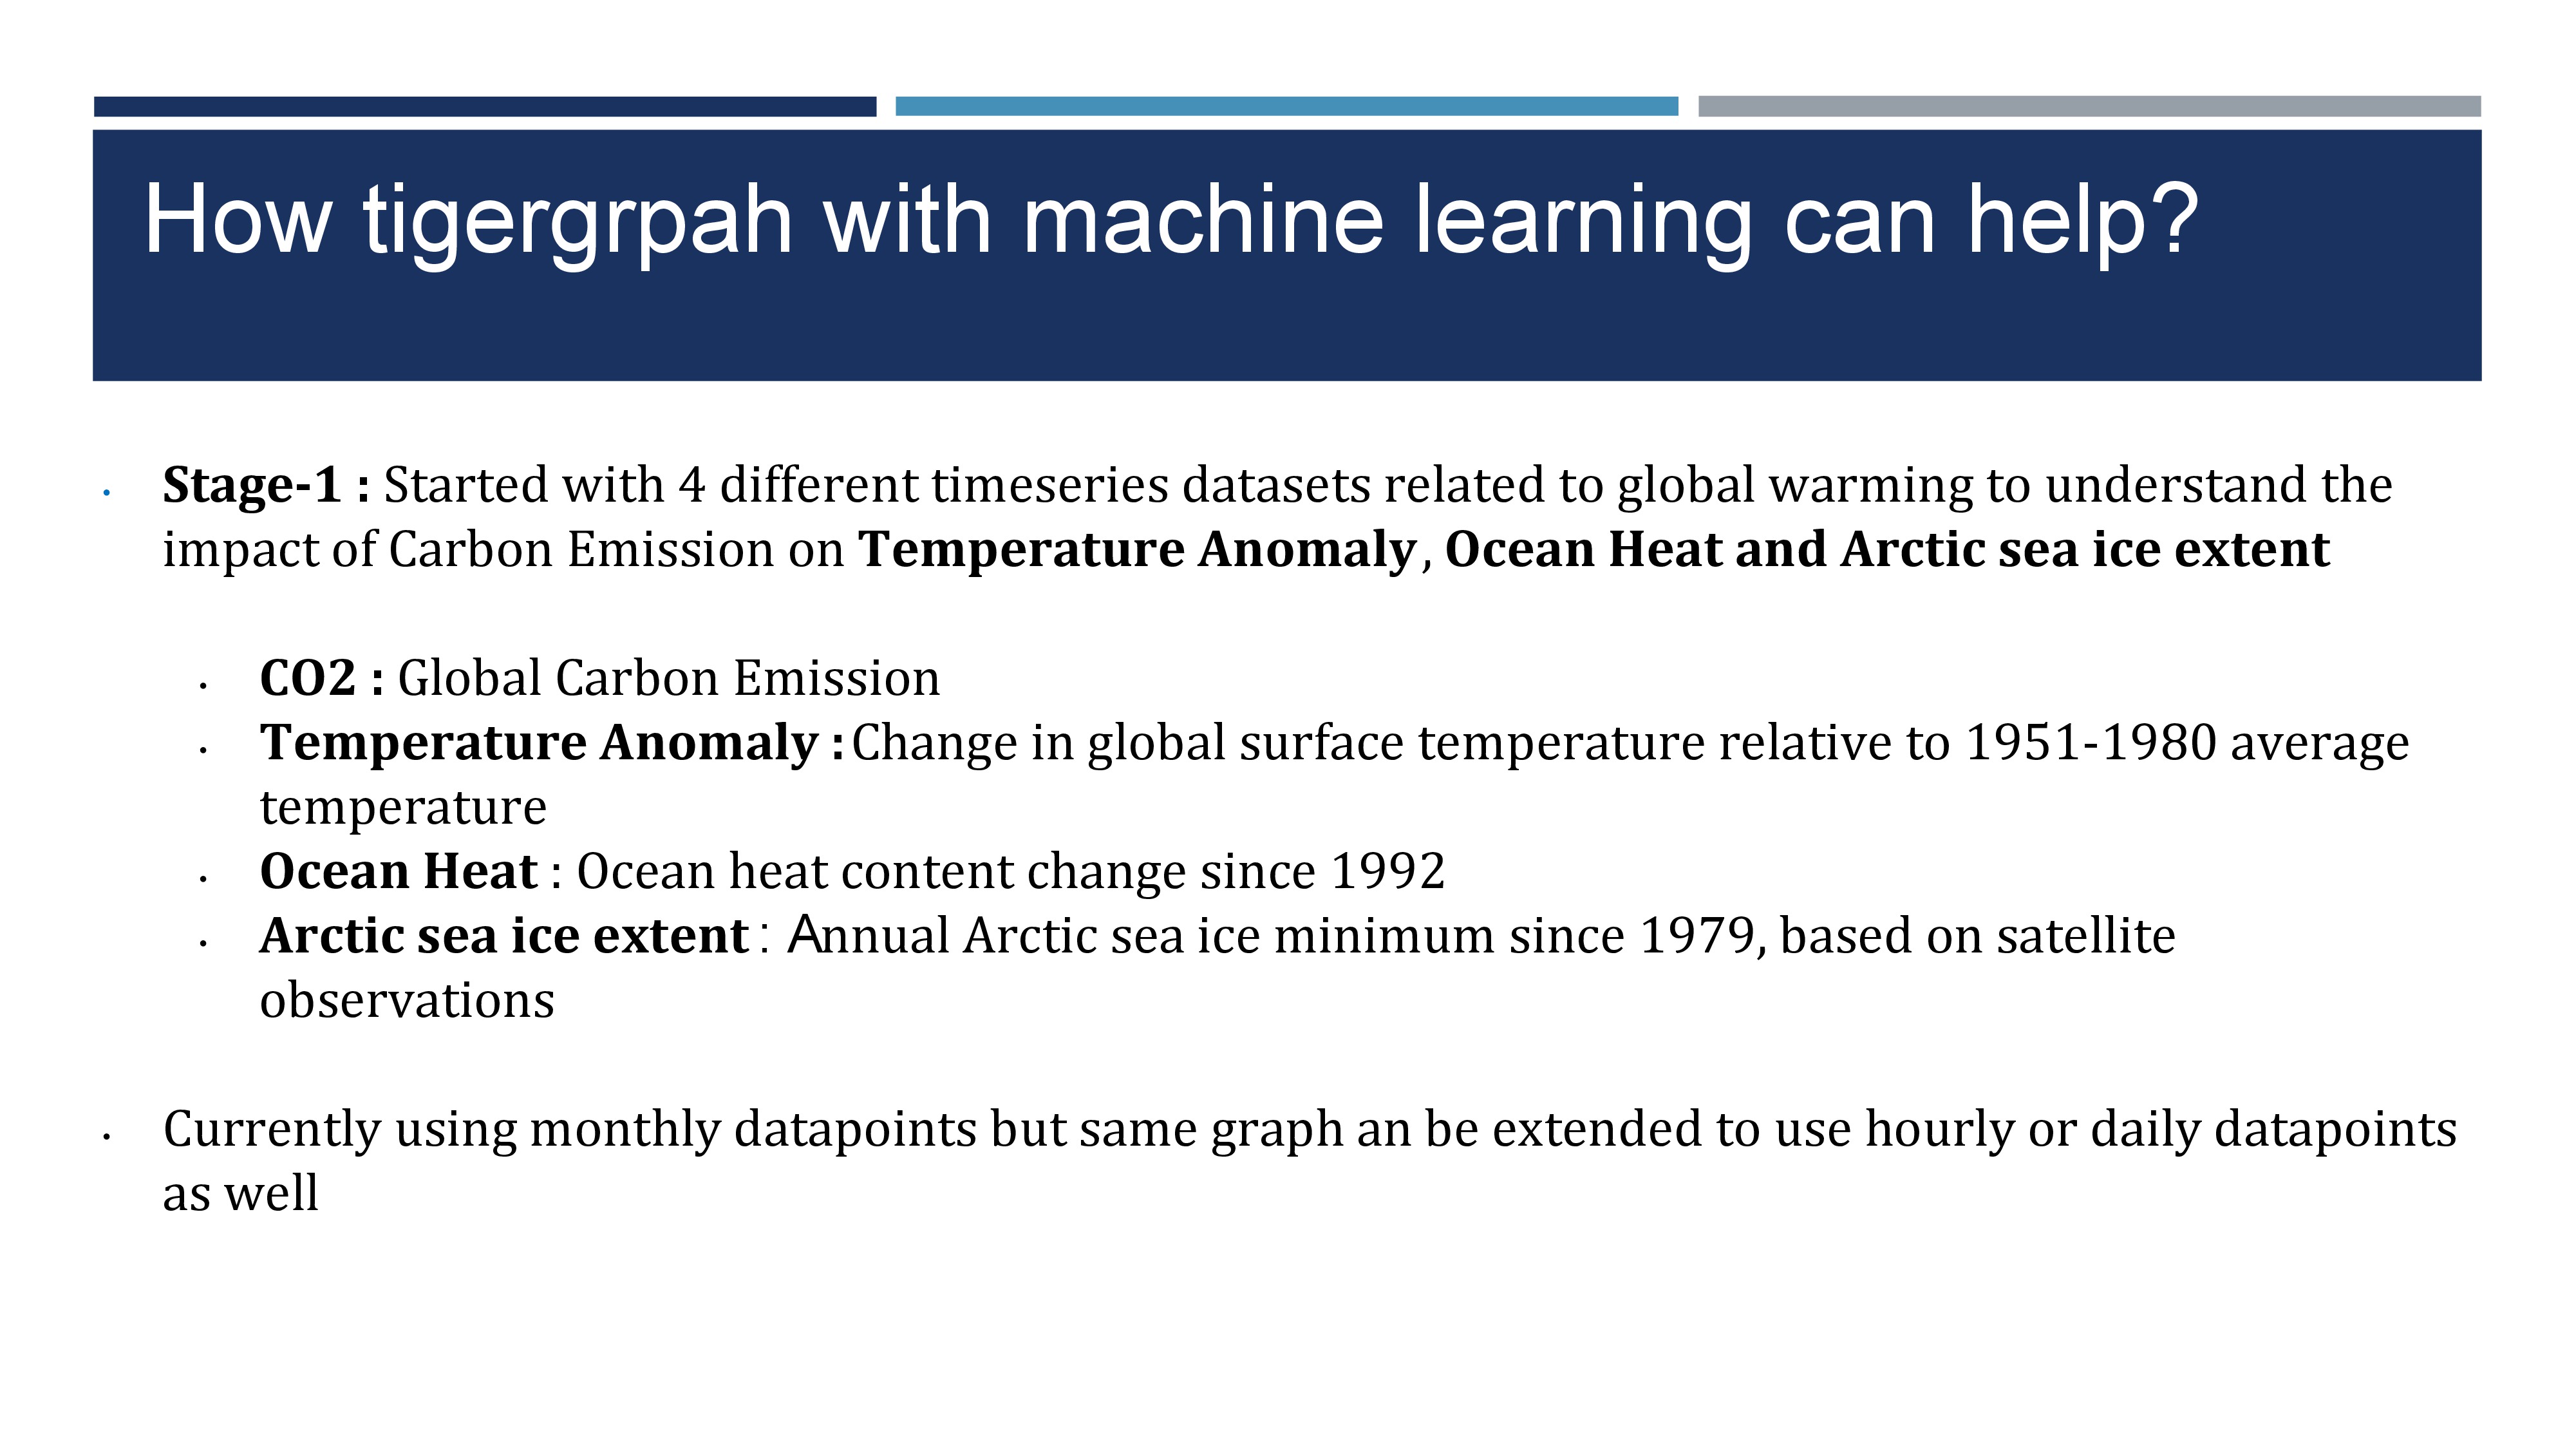
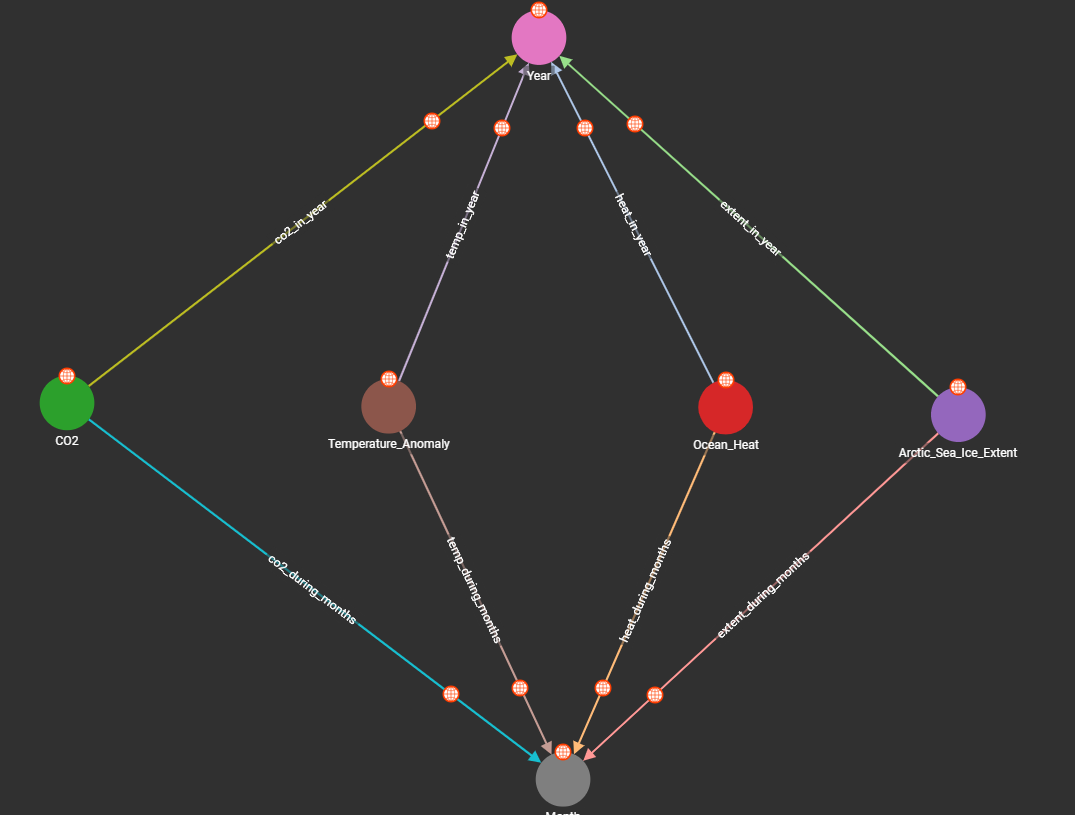
Stage-1 : Started with 4 different timeseries datasets related to global warming to understand the impact of Carbon Emission on Temperature Anomaly , Ocean Heat and Arctic sea ice extent
CO2 : Global Carbon Emission
Temperature Anomaly : Change in global surface temperature relative to 1951-1980 average temperature
Ocean Heat : Ocean heat content change since 1992
Arctic sea ice extent : Annual Arctic sea ice minimum since 1979, based on satellite observations Currently using monthly data points but same graph an be extended to use hourly or daily data points as well
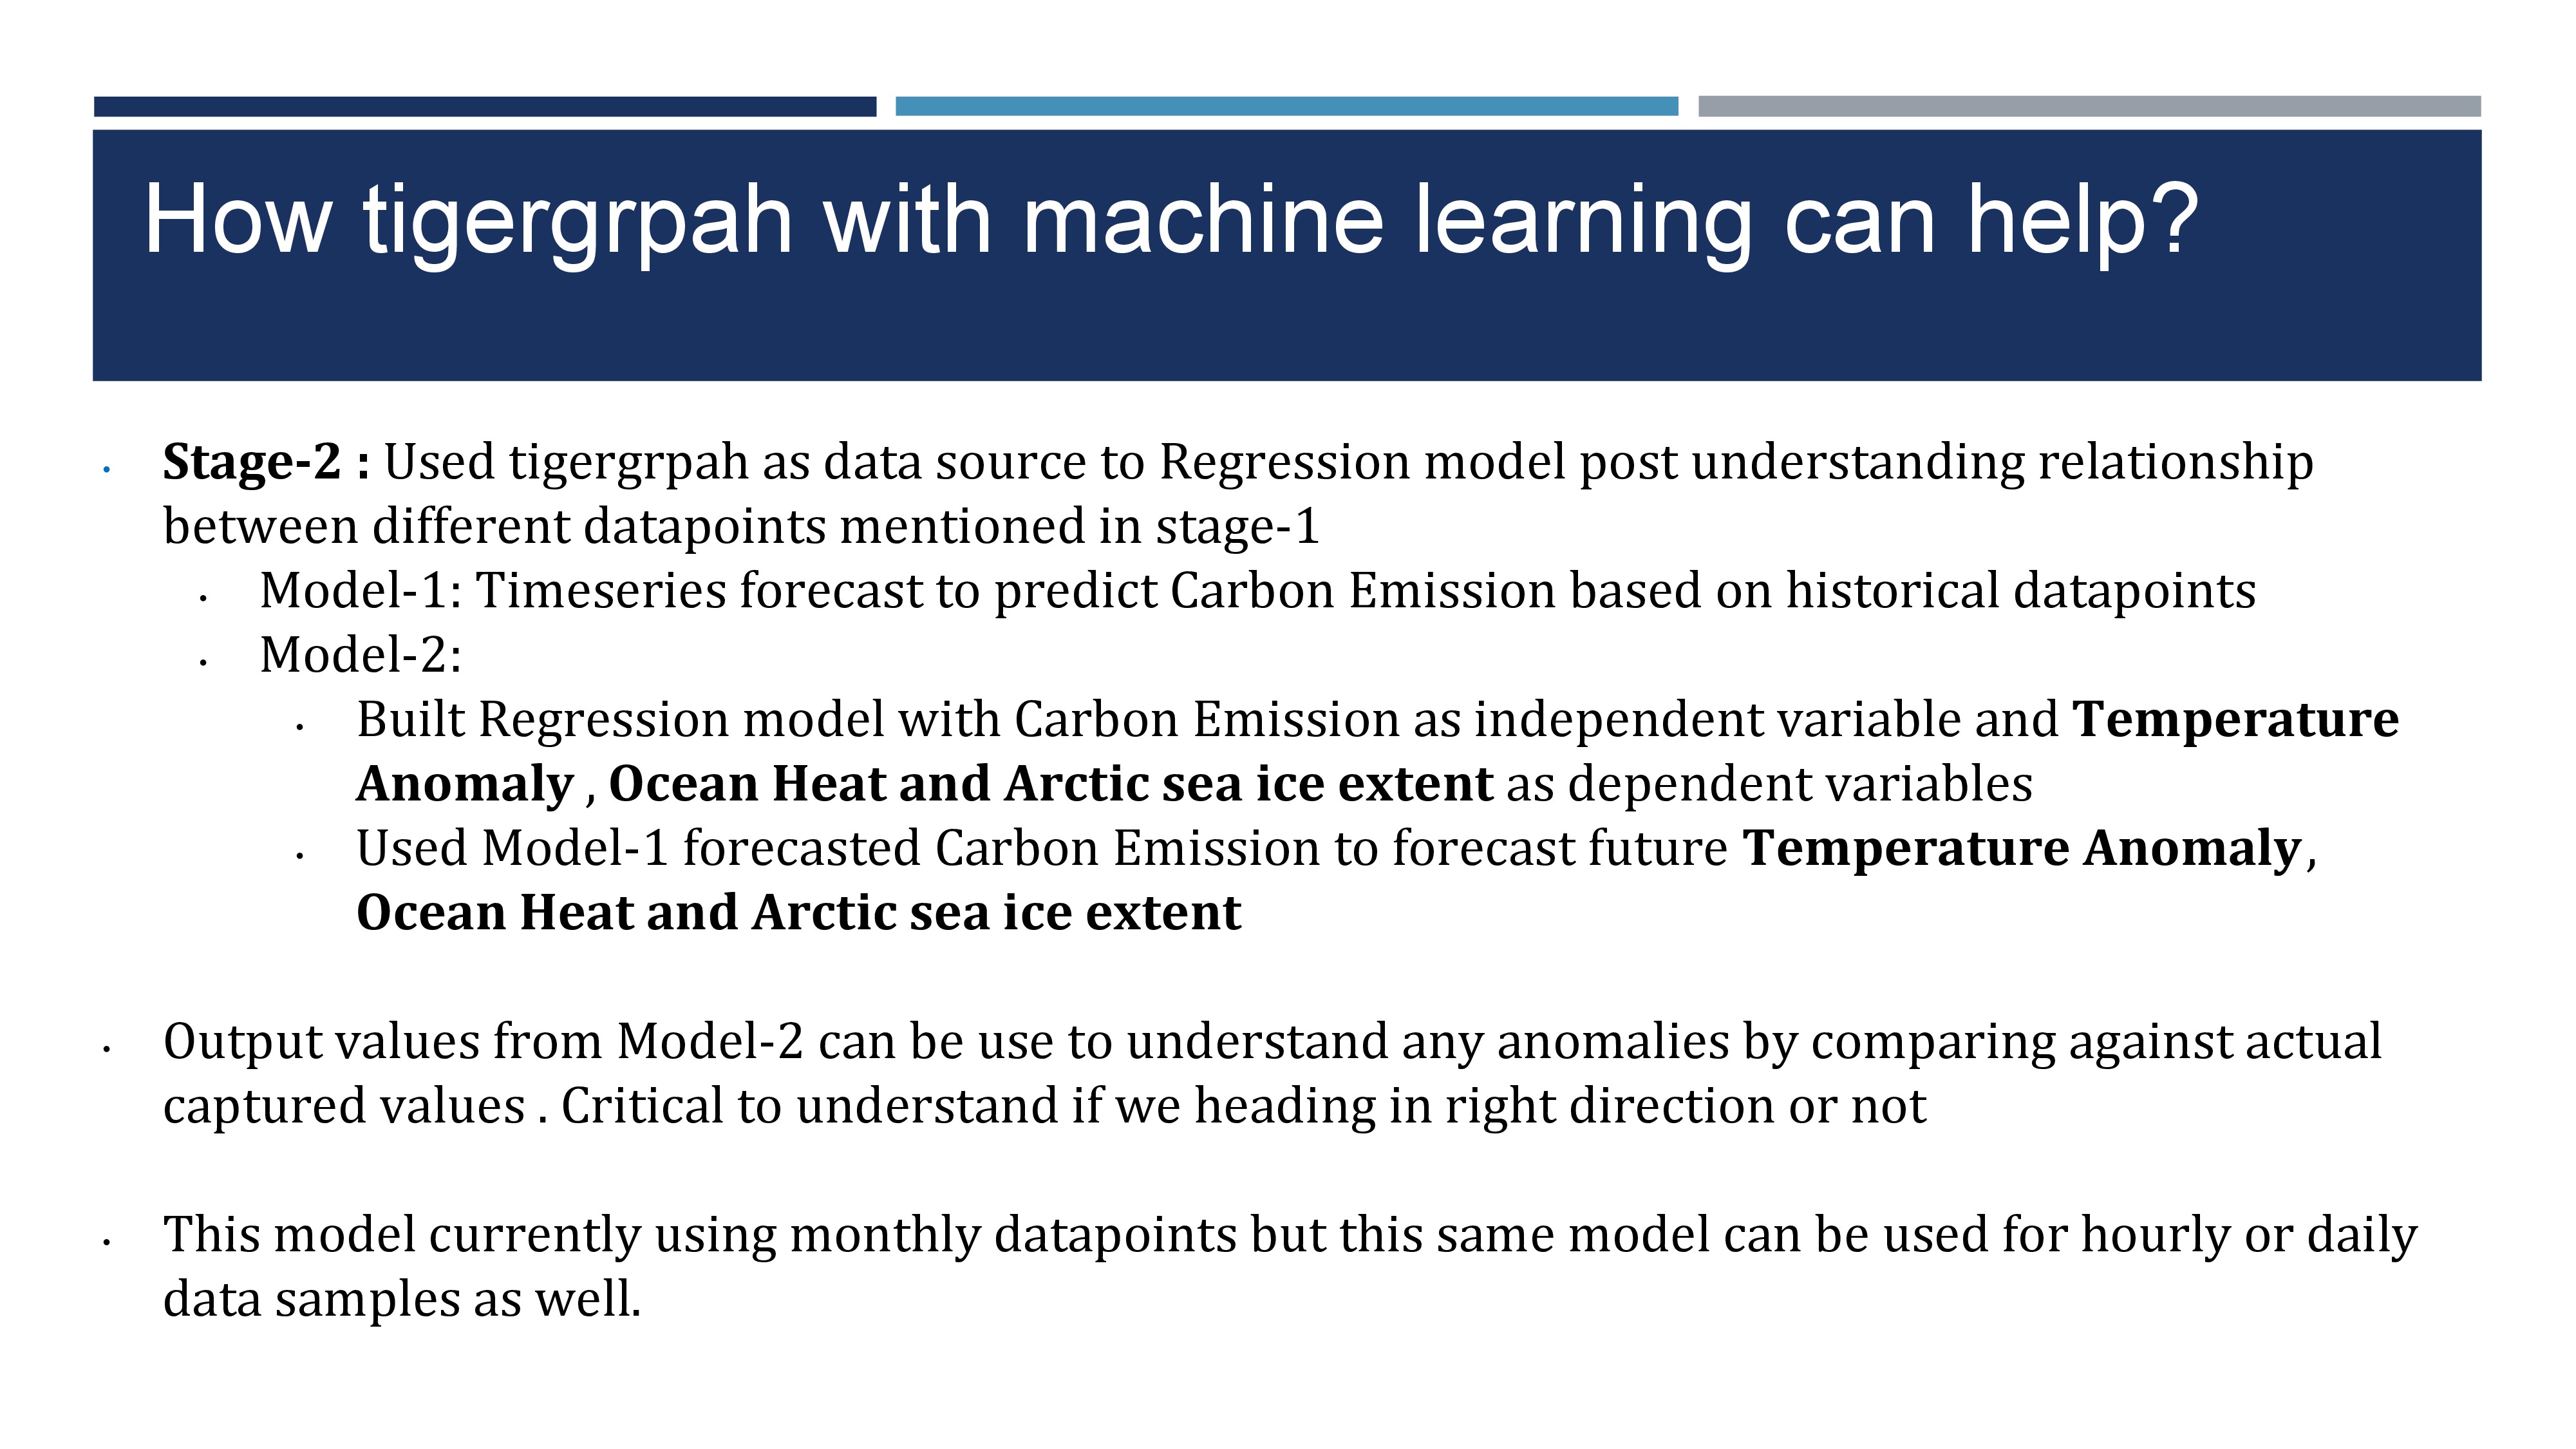
Stage-2 : Used Tigergraph as data source to Regression model post understanding relationship between different data points mentioned in stage-1
Model-1: Timeseries forecast to predict Carbon Emission based on historical data points
Model-2: Built Regression model with Carbon Emission as independent variable and Temperature Anomaly , Ocean Heat and Arctic sea ice extent as dependent variables
Used Model-1 forecasted Carbon Emission to forecast future Temperature Anomaly , Ocean Heat and Arctic sea ice extent
Output values from Model-2 can be use to understand any anomalies by comparing against actual captured values . Critical to understand if we heading in right direction or not
This model currently using monthly data points but this same model can be used for hourly or daily data samples as well.
Platform , tools and languages
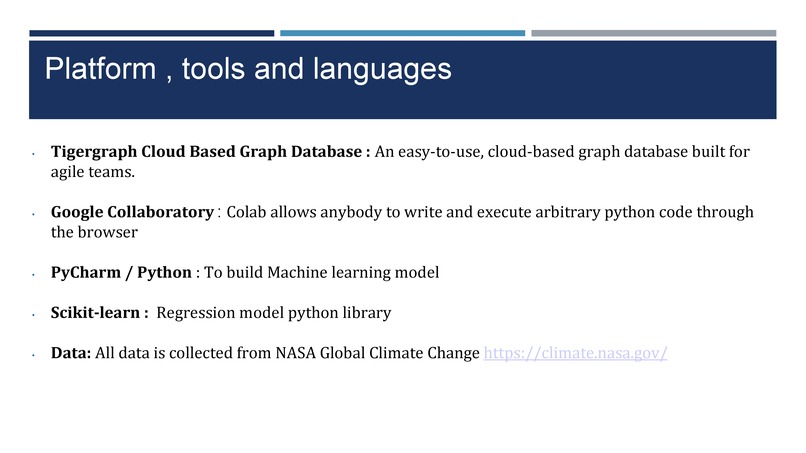
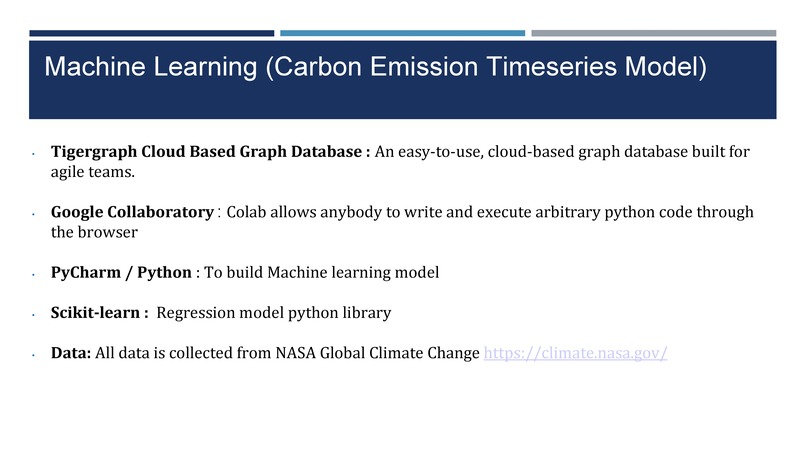
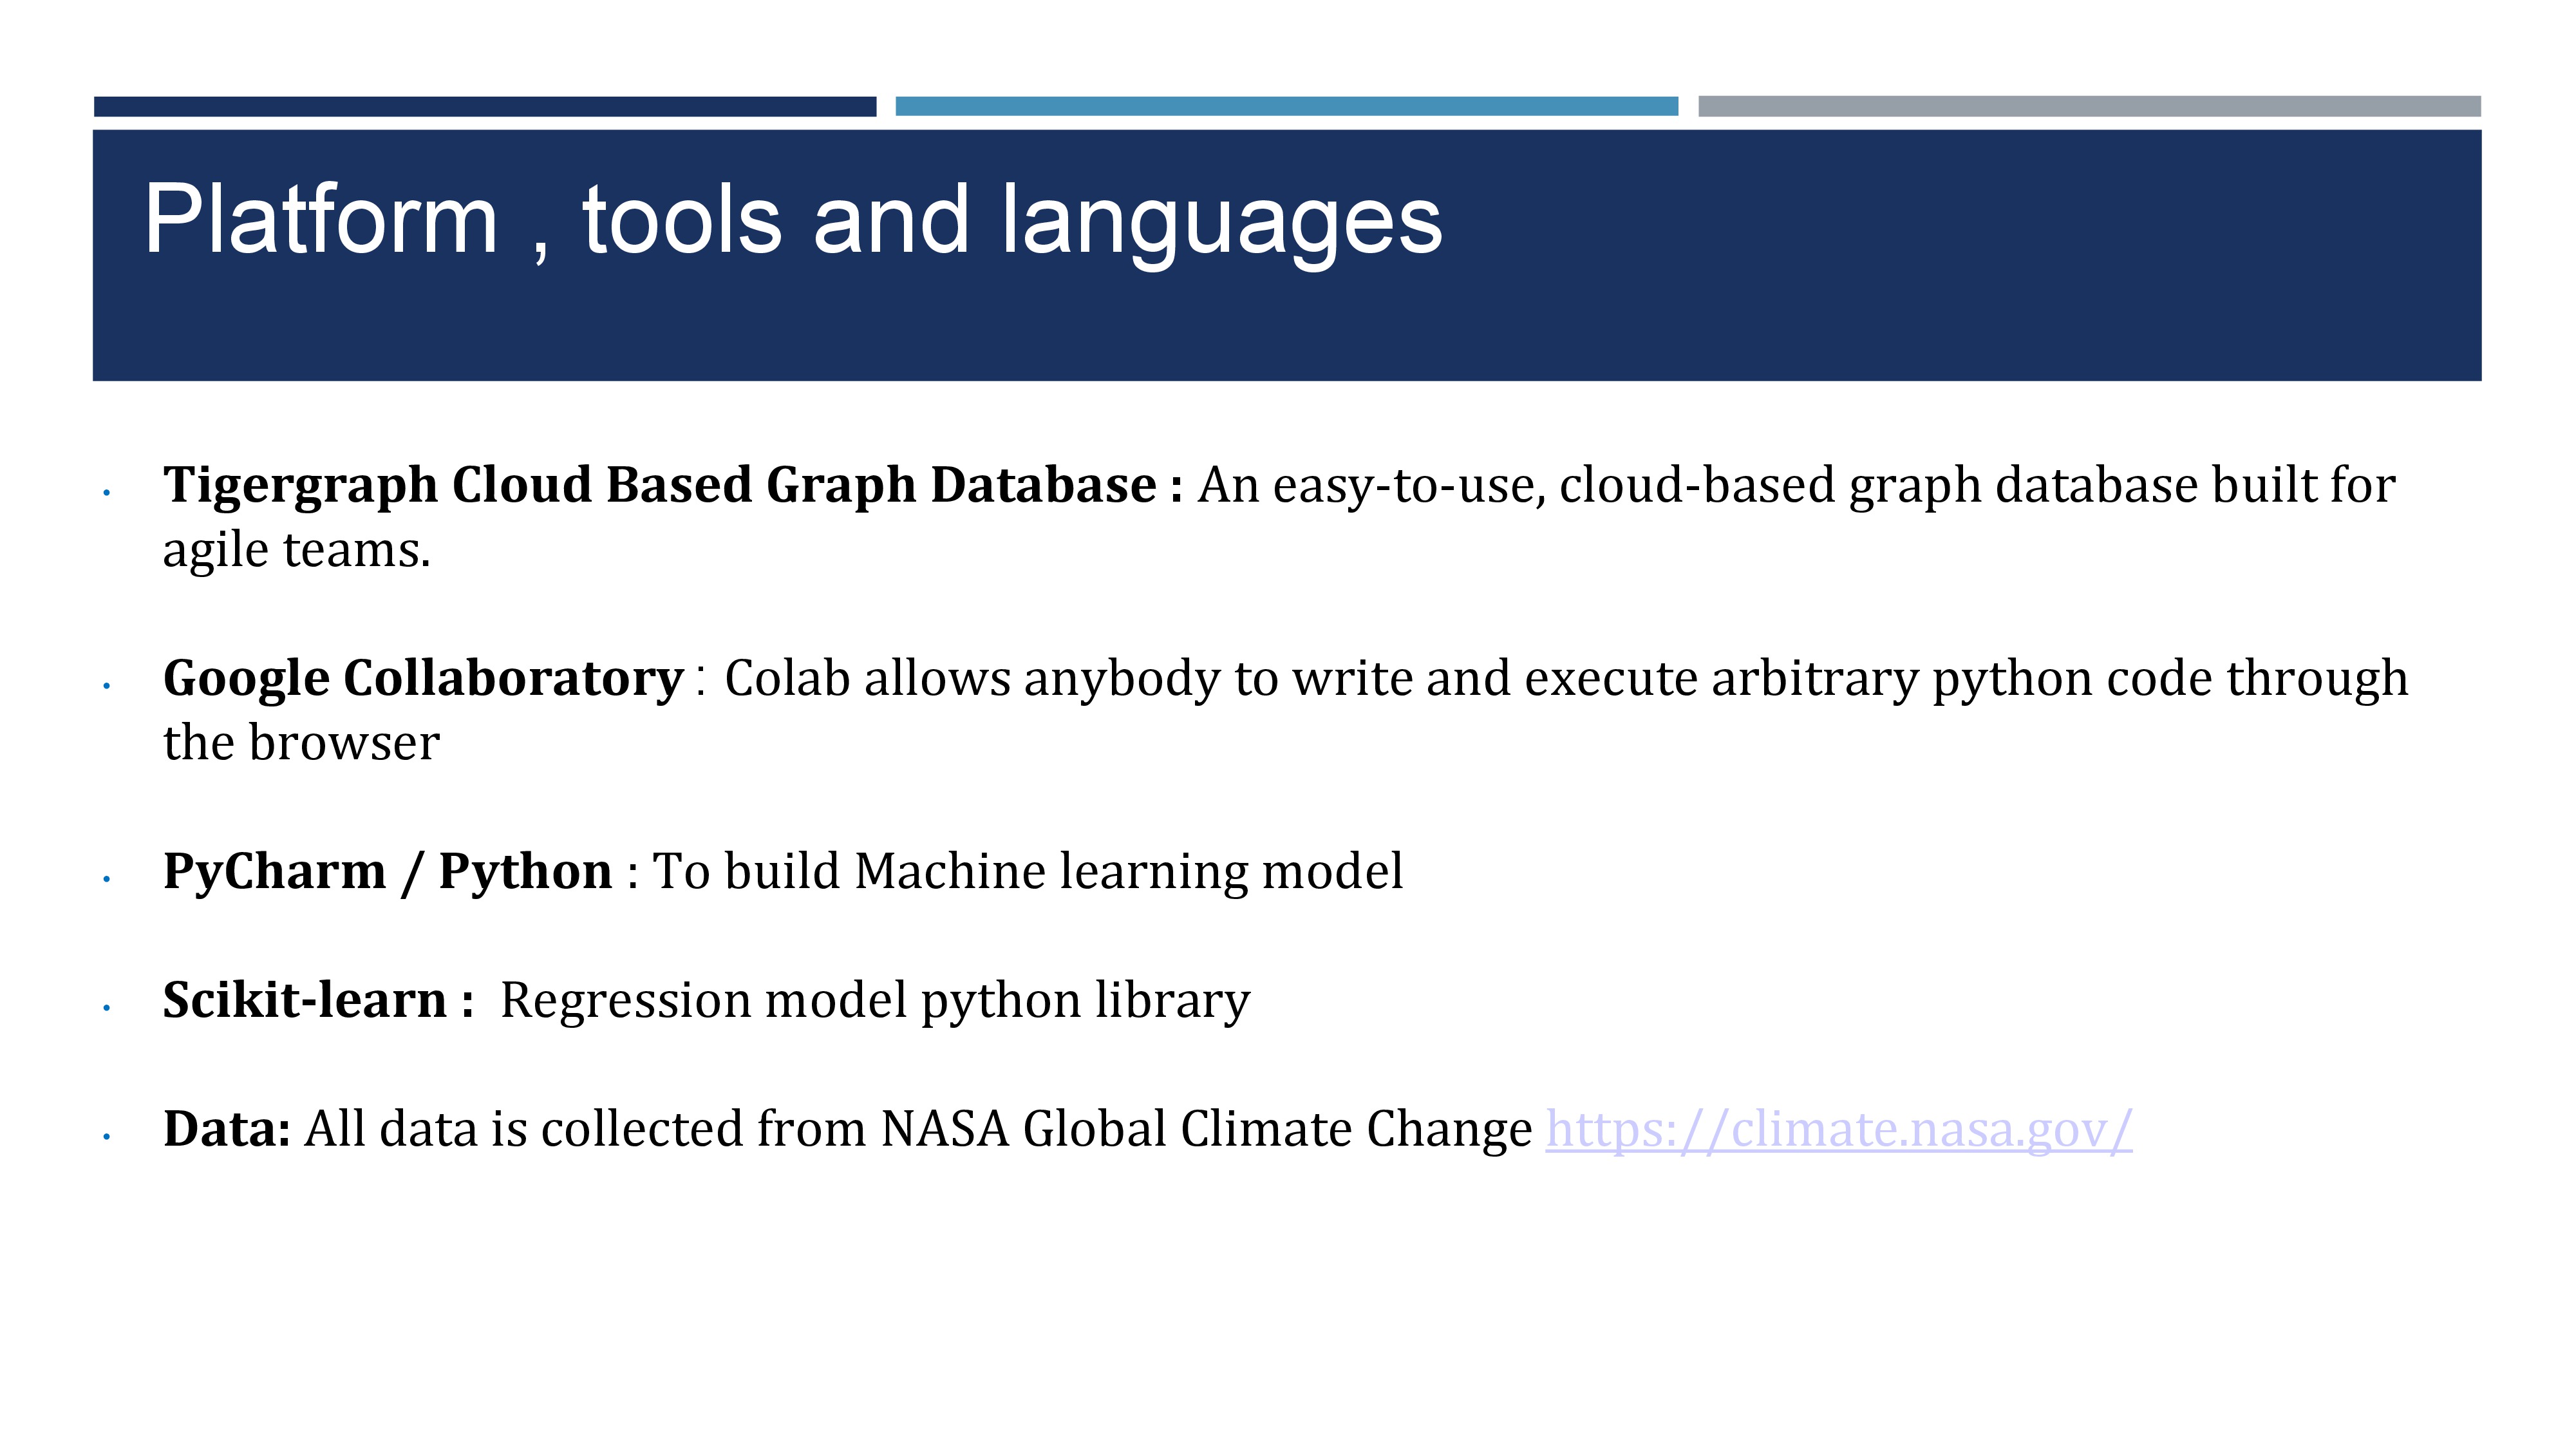
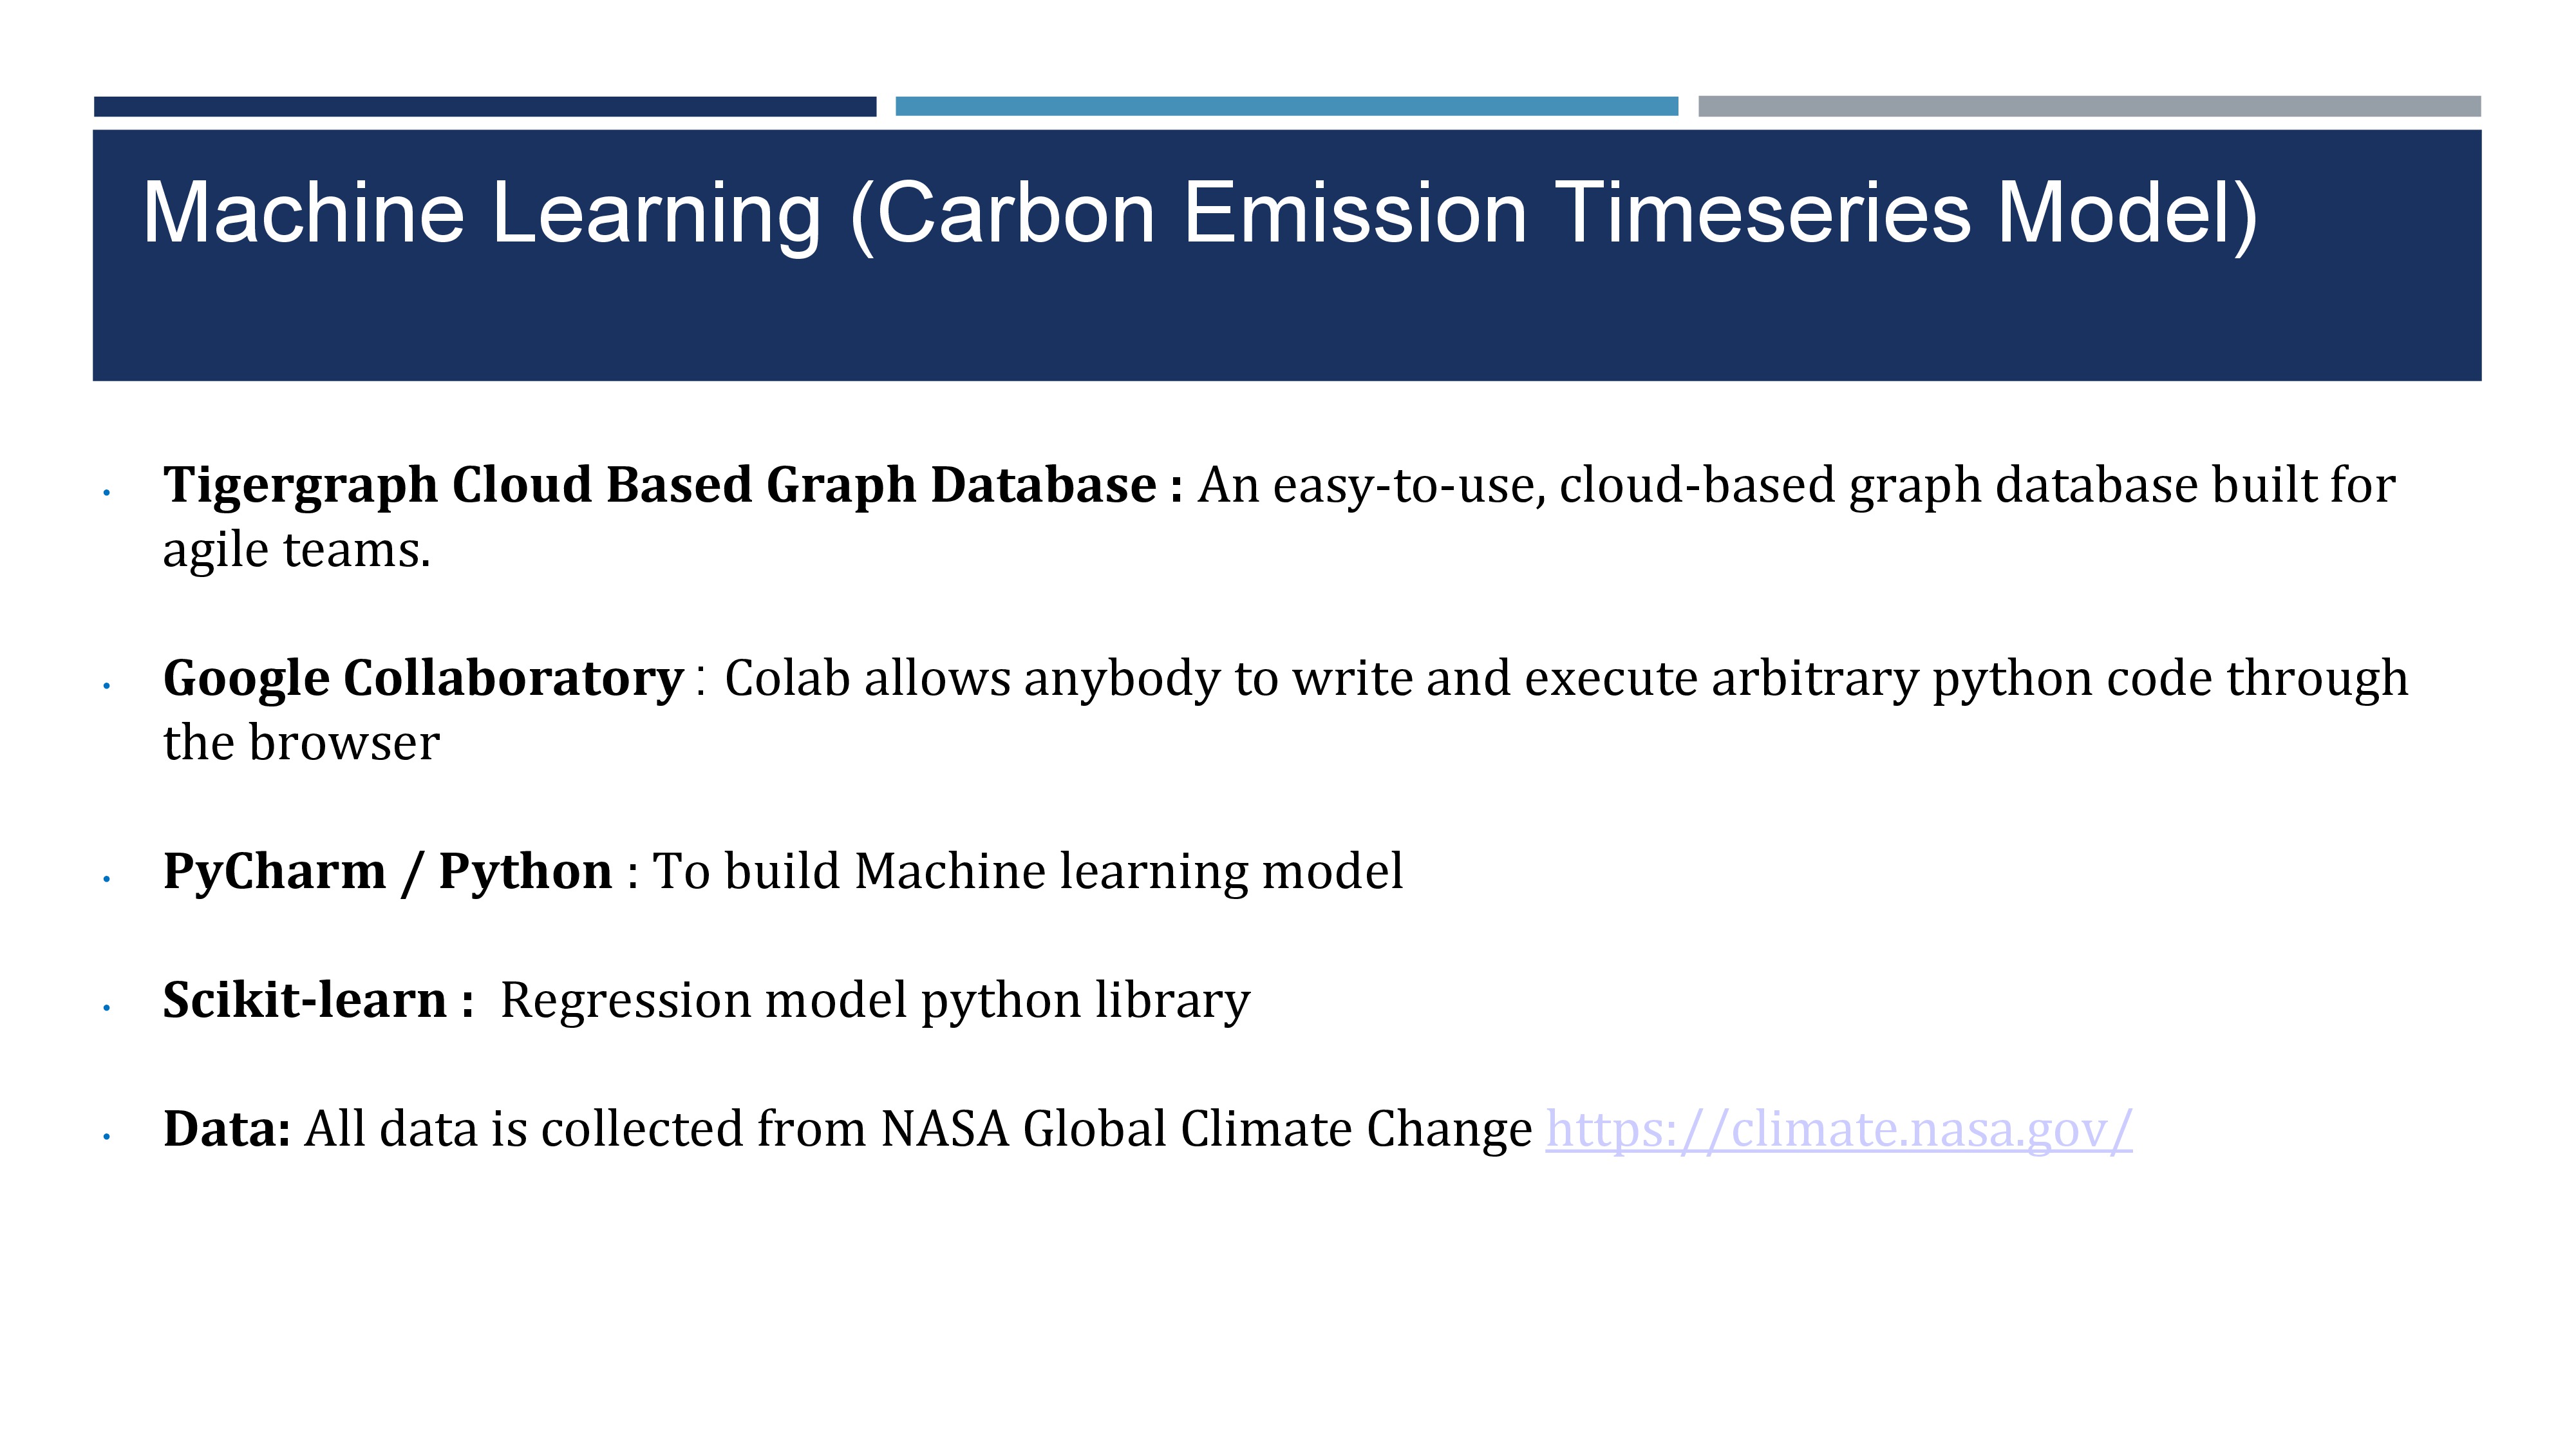
Tigergraph Cloud Based Graph Database : An easy-to-use, cloud-based graph database built for agile teams.
Google Collaboratory : Colab allows anybody to write and execute arbitrary python code through the browser
PyCharm / Python : To build Machine learning model
Scikit-learn : Regression model python library
Data: All data is collected from NASA Global Climate Change https://climate.nasa.gov/
Challenges I ran into
Key challenge as with most of the data analytics or machine learning projects is get correct data to work with faced many challenges to cross check and validate dataset from different sources to understand which is right data source to use for this project.
Accomplishments that I am proud of
Started learning Tigergraph from scratch and able learn and built full project single handedly from conceptualization to working version.
Manage to build both stages of this project with perfectly tune Machine Learning model with 95%+ accuracy for test dataset
What I learned
Tigergraph Cloud Based Graph Database from scratch
What's next for Global Warming : Tigergraph with Machine Learning
Currently using monthly data points but plan is to extend this to use hourly or daily data points. Though looking for valid source of data.
Automation of Realtime analysis and forecasting process with alerts on deviation
Built With
- collaboratory
- pycharm
- python
- scikit-learn
- tigergraph


Log in or sign up for Devpost to join the conversation.