-
-
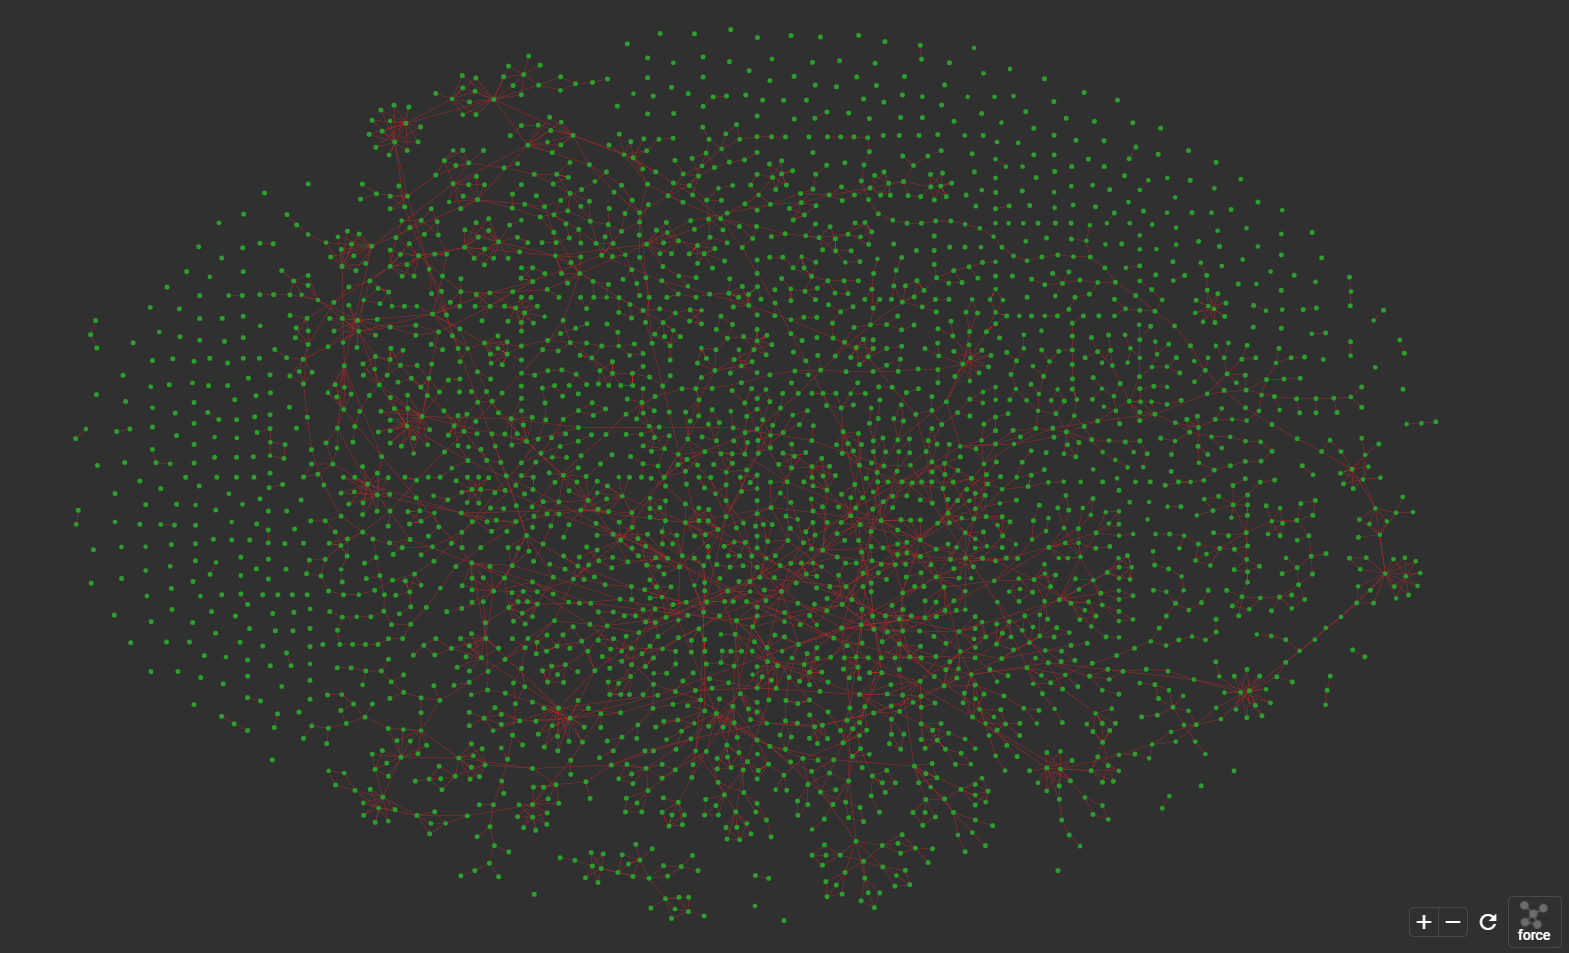
Thumbnail
-
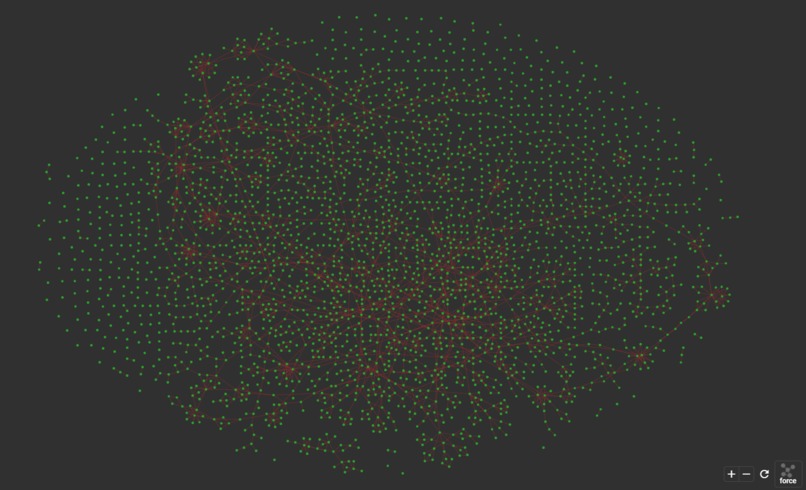
Queen Victoria Pagerank
-
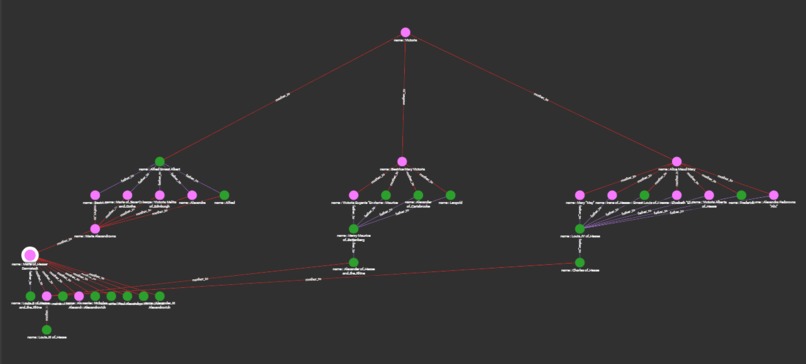
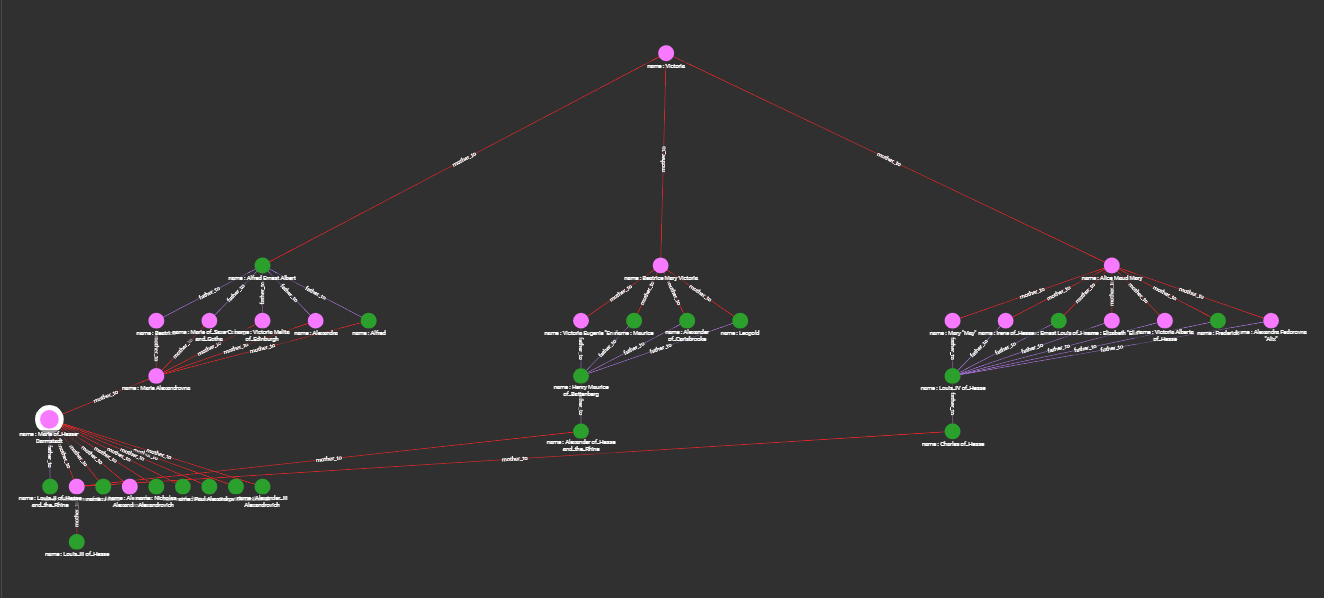
Detection of cyclic relations in genealogy
-

Ancestral path from Victoria to Henry II (20generations)
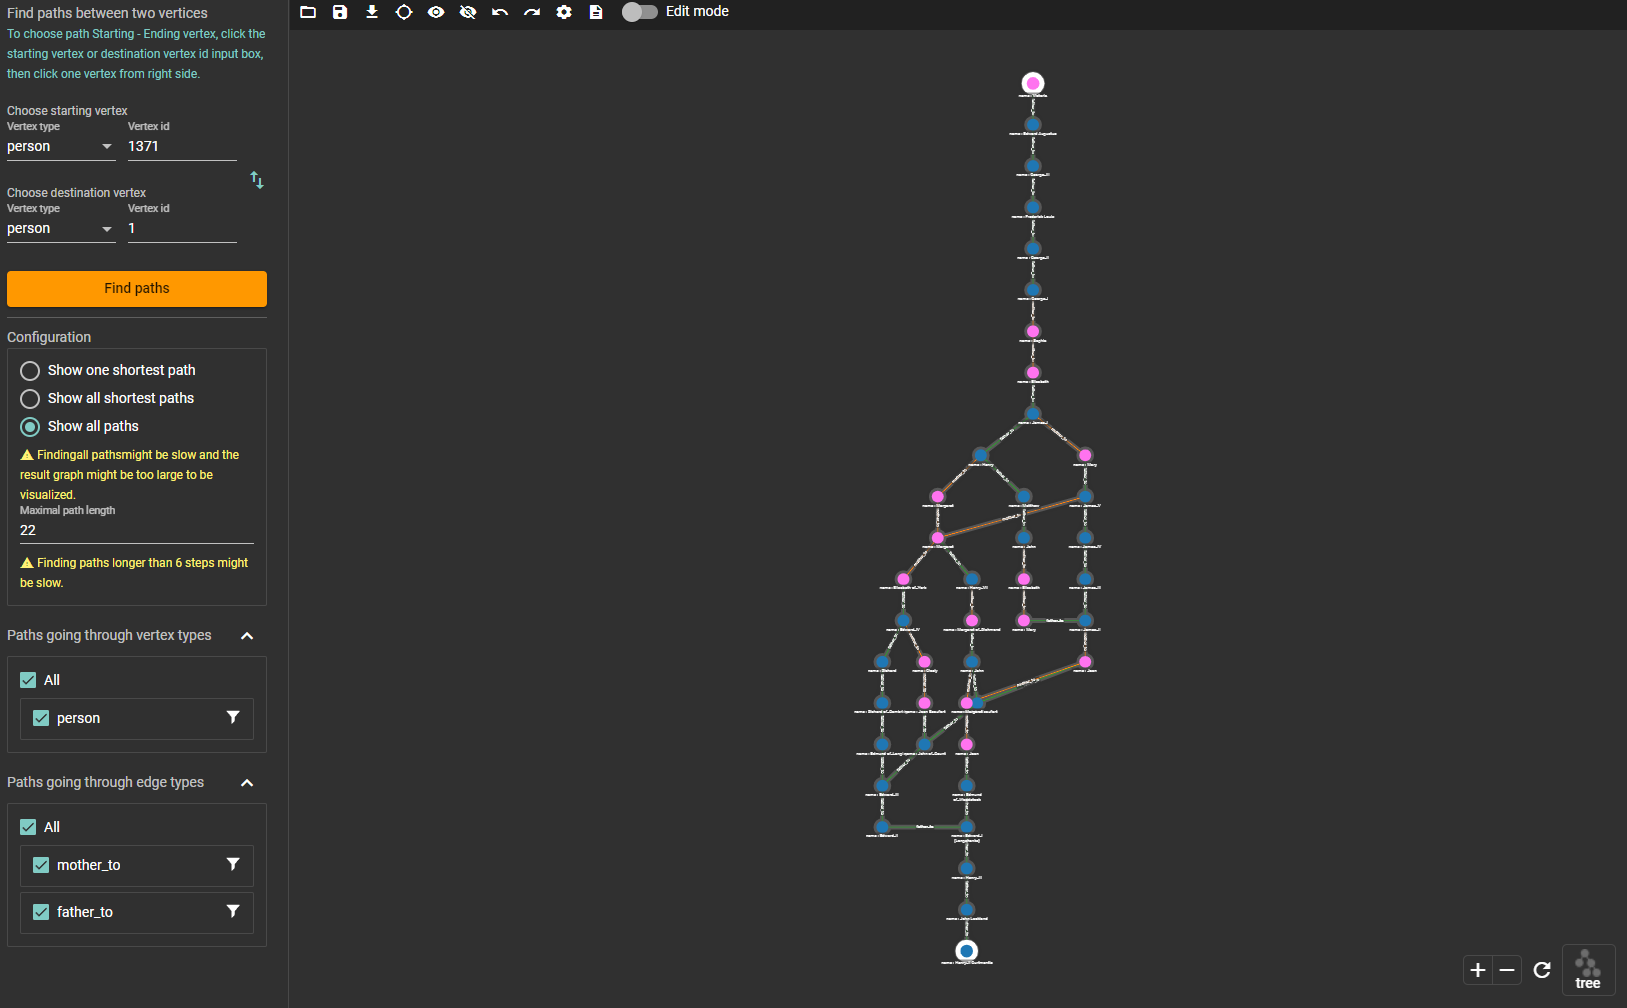
Inspiration
In the field of history, family trees are a classical tool to display relationships between people and outline historical context. Though traditionally focused on royal or aristocratic family lines, in recent years genealogy has taken a more democratic turn as an increasing number of people from all backgrounds have been showing interest in exploring their own family roots and heritage. There are many crowd-sourced family trees, data sets and research tools which have become available.
The problem with this kind of data is that it is saved in a traditional table format. There are limits posed by traditional databases when working with the data - complexity becomes a problem already with a couple of generations, and it is practically impossible to achieve any deeper multi-generational insight or analysis.
What it does
We are empowering historians as well as people with personal interest in genealogy to gain deeper, more accurate insights from ancestral data in an easy and quick way.
Our solution allows anyone to parse and upload ancestral data in GEDCOM format into the TigerGraph database and provides them with tools and queries allowing for a complex research of multi-generational ancestral relations while reaching a more accurate understanding than would ever be possible by means of a traditional database. We believe graph databases have a potential to be a game-changer for genealogy enabling researchers to attain a more precise understanding of the past.
How we built it
First, we created a tool that allows users to load any GED (genealogical data) into TigerGraph. TigerGraph allows us to process tens of thousands of records and achieve deep analysis and insights across dozens of generations and hundreds of years. This is something that would take a lot of time and effort to work out from traditional sources and would be even harder to visualize in a comprehensive way.
Afterwards, we prepared tools and queries with which users can immediately answer genealogical questions hiding in their data sets. We tested the functionality of the whole solution using the public data set of all UK royal family connections. We also demonstrated that GraphStudio is a great way to visualize and interactively explore their data.
Our solution is open sourced and public, meaning it can be used and developed further by anyone.
Challenges we ran into
1) Solving loading of ancestral data files into the graph database
2) Creating a well-working graph schema for this type of data
3) Using advanced algorithms to do quantitative graph analysis on historical data
Accomplishments that we're proud of
Our solution is enabling historians as well as people with personal interest in genealogy to use an innovative graph approach and apply it to ancestral data to reach groundbreaking insights easily and quickly. The fact that it can process tens of thousands of records and enable deep analysis and insights across dozens of generations and hundreds of years makes it a perfect research tool. Moreover, the solution is open sourced and public making it readily available to anyone as well as flexible enough for further development and adaptation for various research needs.
What we learned
Using graph database for genealogical research is a game-changer for the field of history studies. TigerGraph contains a number of algorithms (see: https://docs-legacy.tigergraph.com/graph-algorithm-library) that offer new possibilities to find hidden relations and distill new historical insights.
What's next for HistoryGraph - Graph for a better understanding of history
Our current solution can be further improved by adding more historical connections / edges ("marriage", "siblings", or "step-parents") such as offering even more detail within the graph.
Built With
- graphstudio
- python
- tigergraph
Log in or sign up for Devpost to join the conversation.