-

Homepage
-

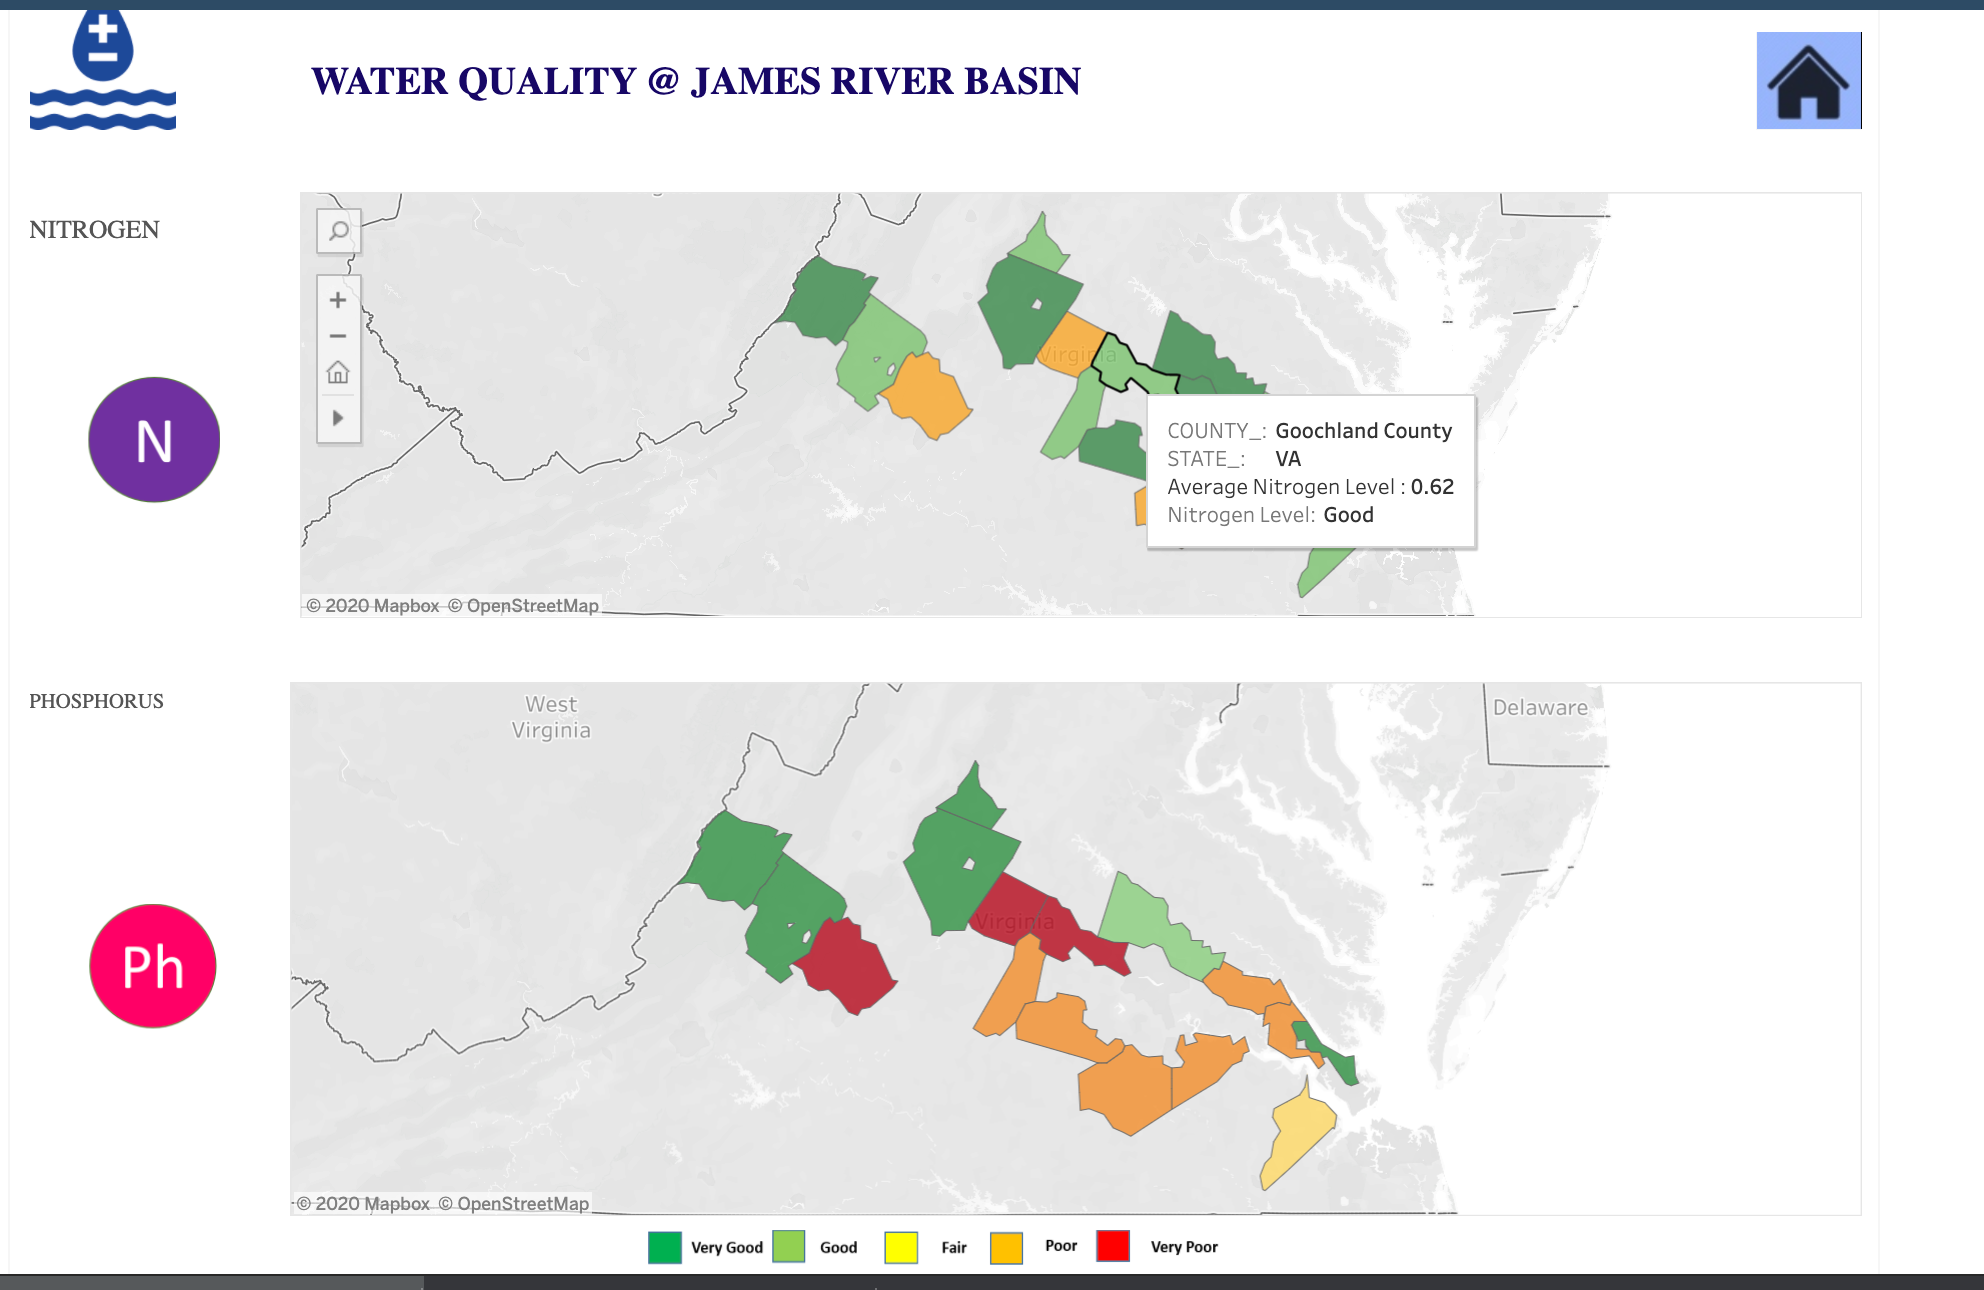
Dial 1 - Water Quality
-

Dial 2 - Community
-

Dial 3 - Recreation
-

Dial 4 - Covid
-

Dial 5 - Whats new


Inspiration
As a frequent visitor to the Chesapeake Bay, understanding and providing awareness about the water quality and bay conservation is our inspiration.
What it does
This is an integrated platform to get all related information. In addition to metrics measuring the health of the bay, this design adds the community factor in. Being interactive and engaging, it will gain more visitors and can be used to engage, educate and involve the local user.
How we built it
This is built using Tableau. This is user-friendly and can be easily scaled to cover other regions in the bay. It can be published online and can use different datasources both on-prem and in the cloud.
Challenges we ran into
Understanding the data and how it is measured is challenging. This being a new domain, time is required to understand and analyze the data.
Accomplishments that we're proud of
Putting together an interactive design that is both fun and informative. Adding maps that can be searched using Zipcode and click features enhance the user experience.
What we learned
A lot about the data behind water quality.
What's next
Plan is to integrate real time data sources including social media/news feed and add more measures for water quality.


Log in or sign up for Devpost to join the conversation.