-
-
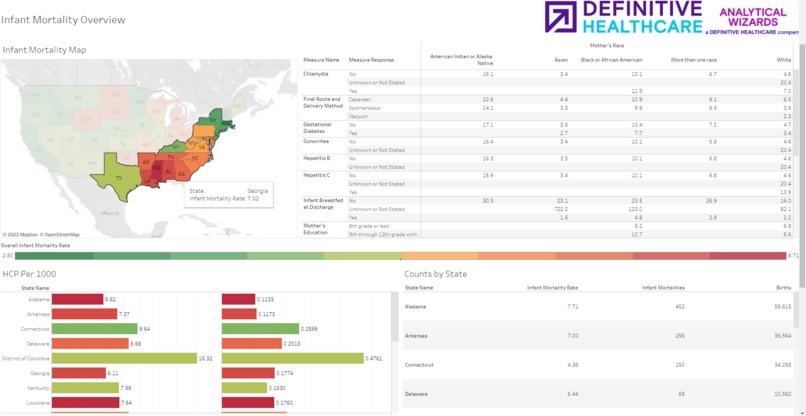
Our Home Page
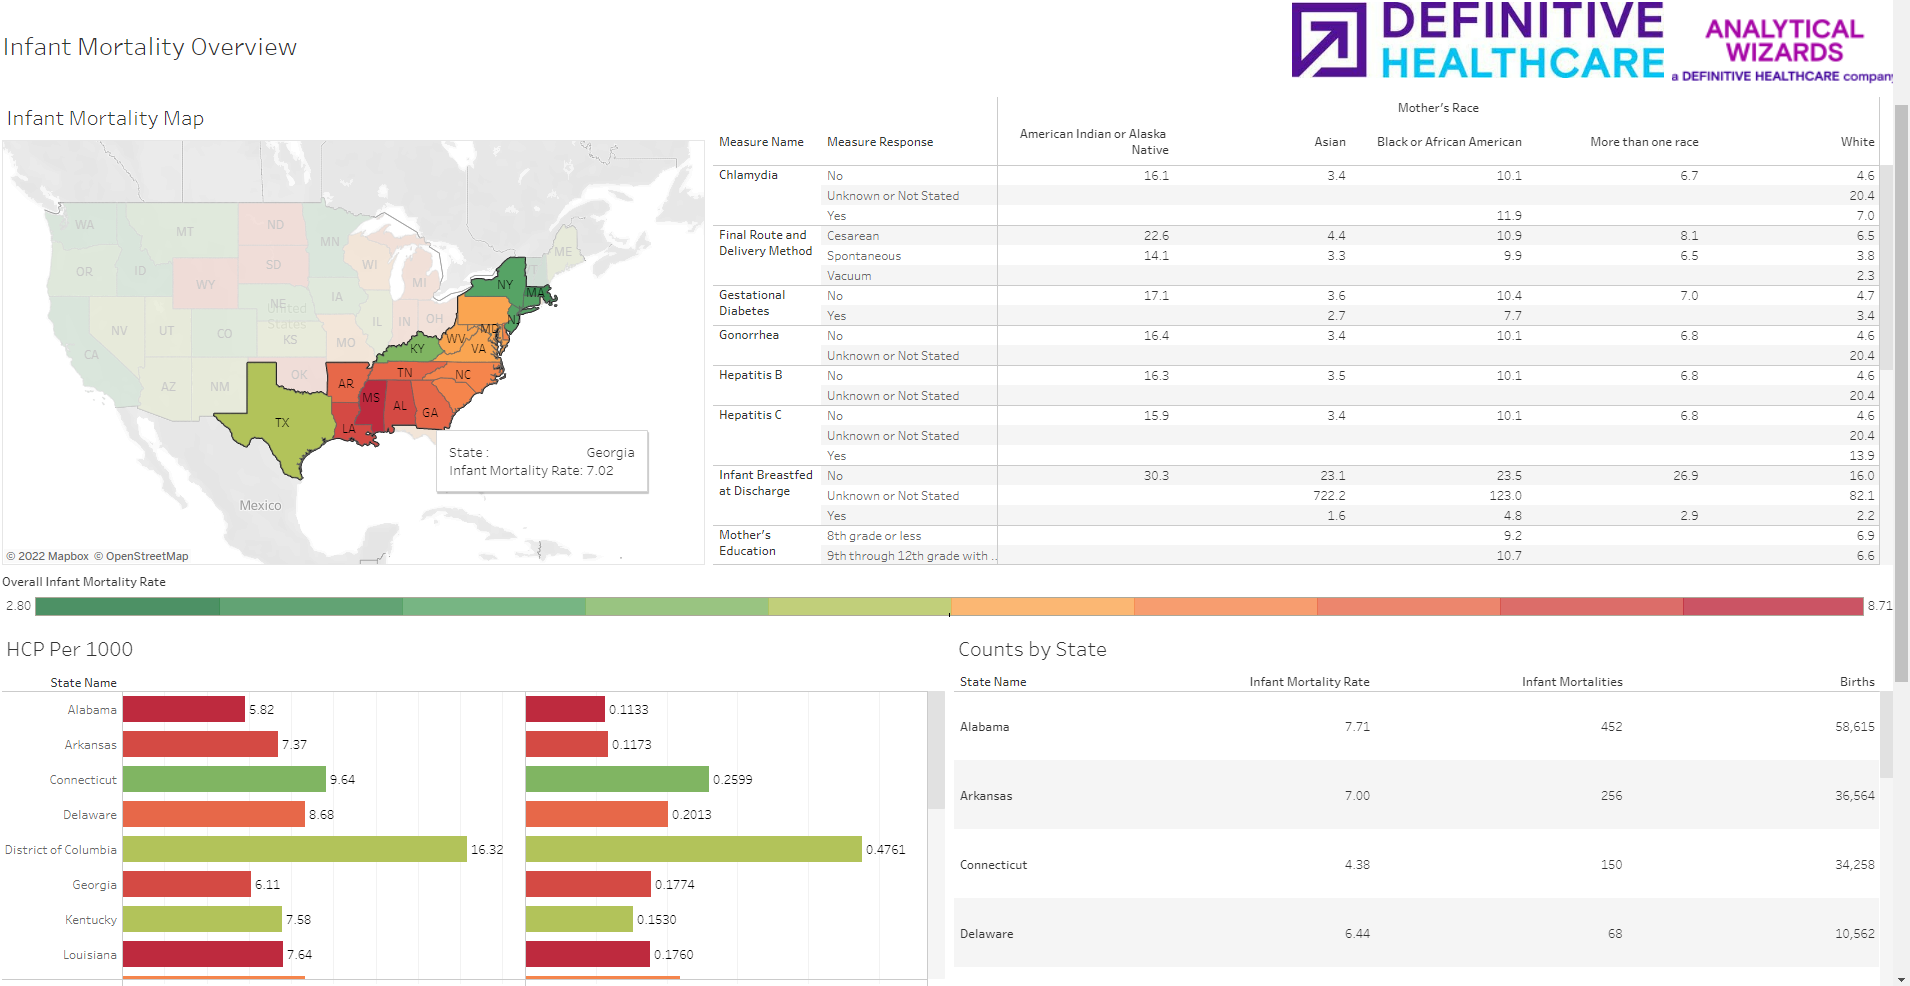
Inspiration
We work for a health data analytics company. Some might even call us health data nerds, and we wouldn’t take offense to that. We are passionate about the stories you can tell with health data and the differences those stories can make. Sometimes the stories the data tell are heartbreaking. Infant Mortality in the United States, and the deeper inequities the data suggest, is one of the more heartbreaking stories.
Although infant mortality in the US has been trending in a positive direction in recent years, we still rank in the bottom fifth of OECD countries despite spending more per capita on healthcare than any other country. A lot more, 66% more per capita than the next highest spender in the OECD (Germany) This is why the health equity prompt of the patient equity track inspired us.
What it does
Users can view a map of the United States and filter to a state of interest. Based on the filters a user applies, information is provided about that state’s infant mortality and correlated variables. The data can be viewed at a national and state level as well as explored in greater depth using the Passport Analytics Tools powered by IZE engine. Users can interrogate the mortality data and correlated trends, including some that can be influenced by public health measures, to better understand, and hopefully work towards improving infant mortality and correcting for equity factors that impact it.
How we built it
The tool uses public information about population distribution, infant mortality, and healthcare providers per thousand as a proxy measure for access to healthcare. Our team cleansed, linked, and analyzed that data. Using ANOVA and other correlation analyses we looked for relevant, correlated, and ideally influencing factors.
Our first step was to ingest and integrate a few sets of data. We assembled several of the Census Bureau datasets relating to population density, demographic information, as well as CDC data on infant mortality. We normalized and merged these public datasets with Definitive Healthcare’s proprietary information on healthcare providers and birthing healthcare providers.
The output of these analyses are displayed in a public tableau dashboard and our inhouse IZE platform
Challenges we ran into
The primary challenge we ran into was in the form of the granularity of the publicly available data. Much of the analysis we hoped to perform was not possible due to the aggregation requirements of keeping this data private.
Accomplishments that we're proud of
While the high rate of US infant mortality is well known and available publications also bring to light the equity factors that are highly correlated to it, including race, ethnicity, and access to care, our tool aggregates many of these relevant factors to one visualization and allows for comparison of mortality rates across states, races, and factor categories. We hope we have meaningfully added to the conversation and created a public tool to further understanding of the issue. Our hackathon team consists of members from a variety of Definitive’s internal departments and subsidiaries. Usually, we don’t have a chance to collaborate directly in our day-to-day roles. Despite this, we are amazed at how quickly we gelled into a cohesive team with everyone pitching in.
What we learned
Although, as a team we were all collectively aware of the problem of US infant mortality, it was sobering to see the magnitude of the problem and the strength of its correlation to factors like race and access to care.
What's next for Definitive US Infant Mortality Explorer
We would like to find usable data at a more granular level or acceptable proxies and continue to perform analysis that adds to the discourse and ideally suggests paths to addressing the issue.

Log in or sign up for Devpost to join the conversation.