Inspiration
KCF Challenge and Stock Trading
What it does
Dashboard
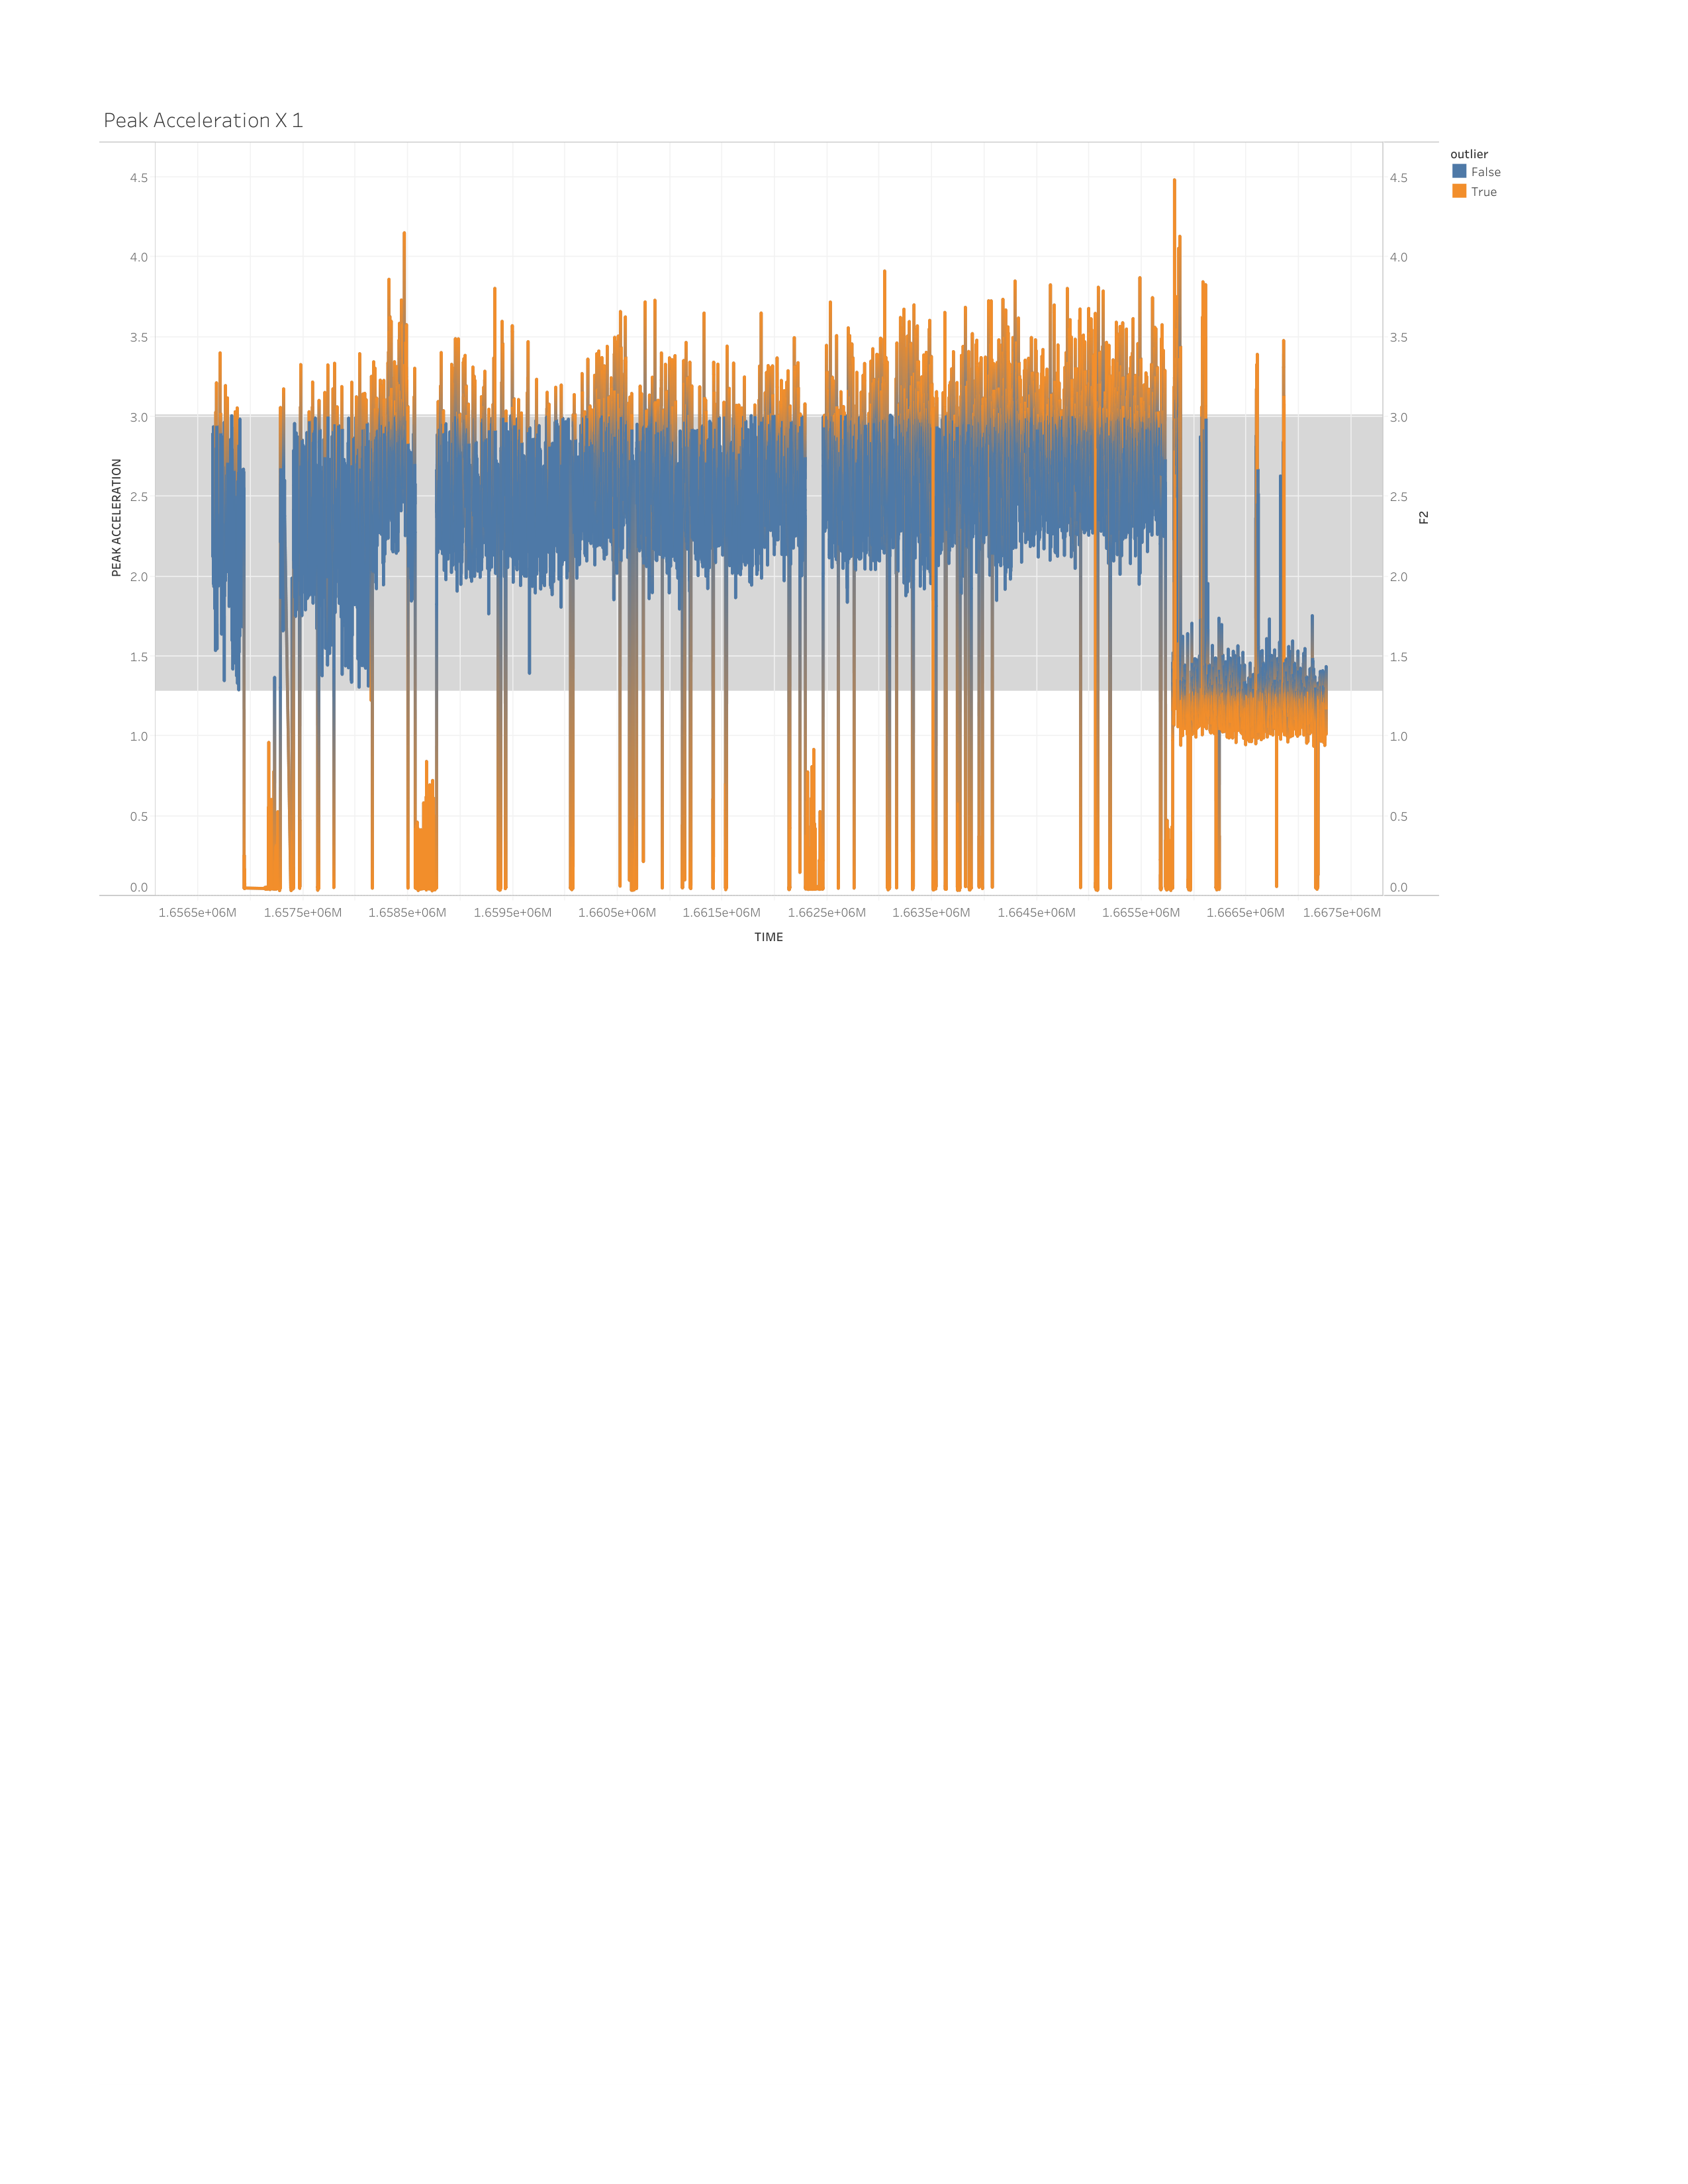
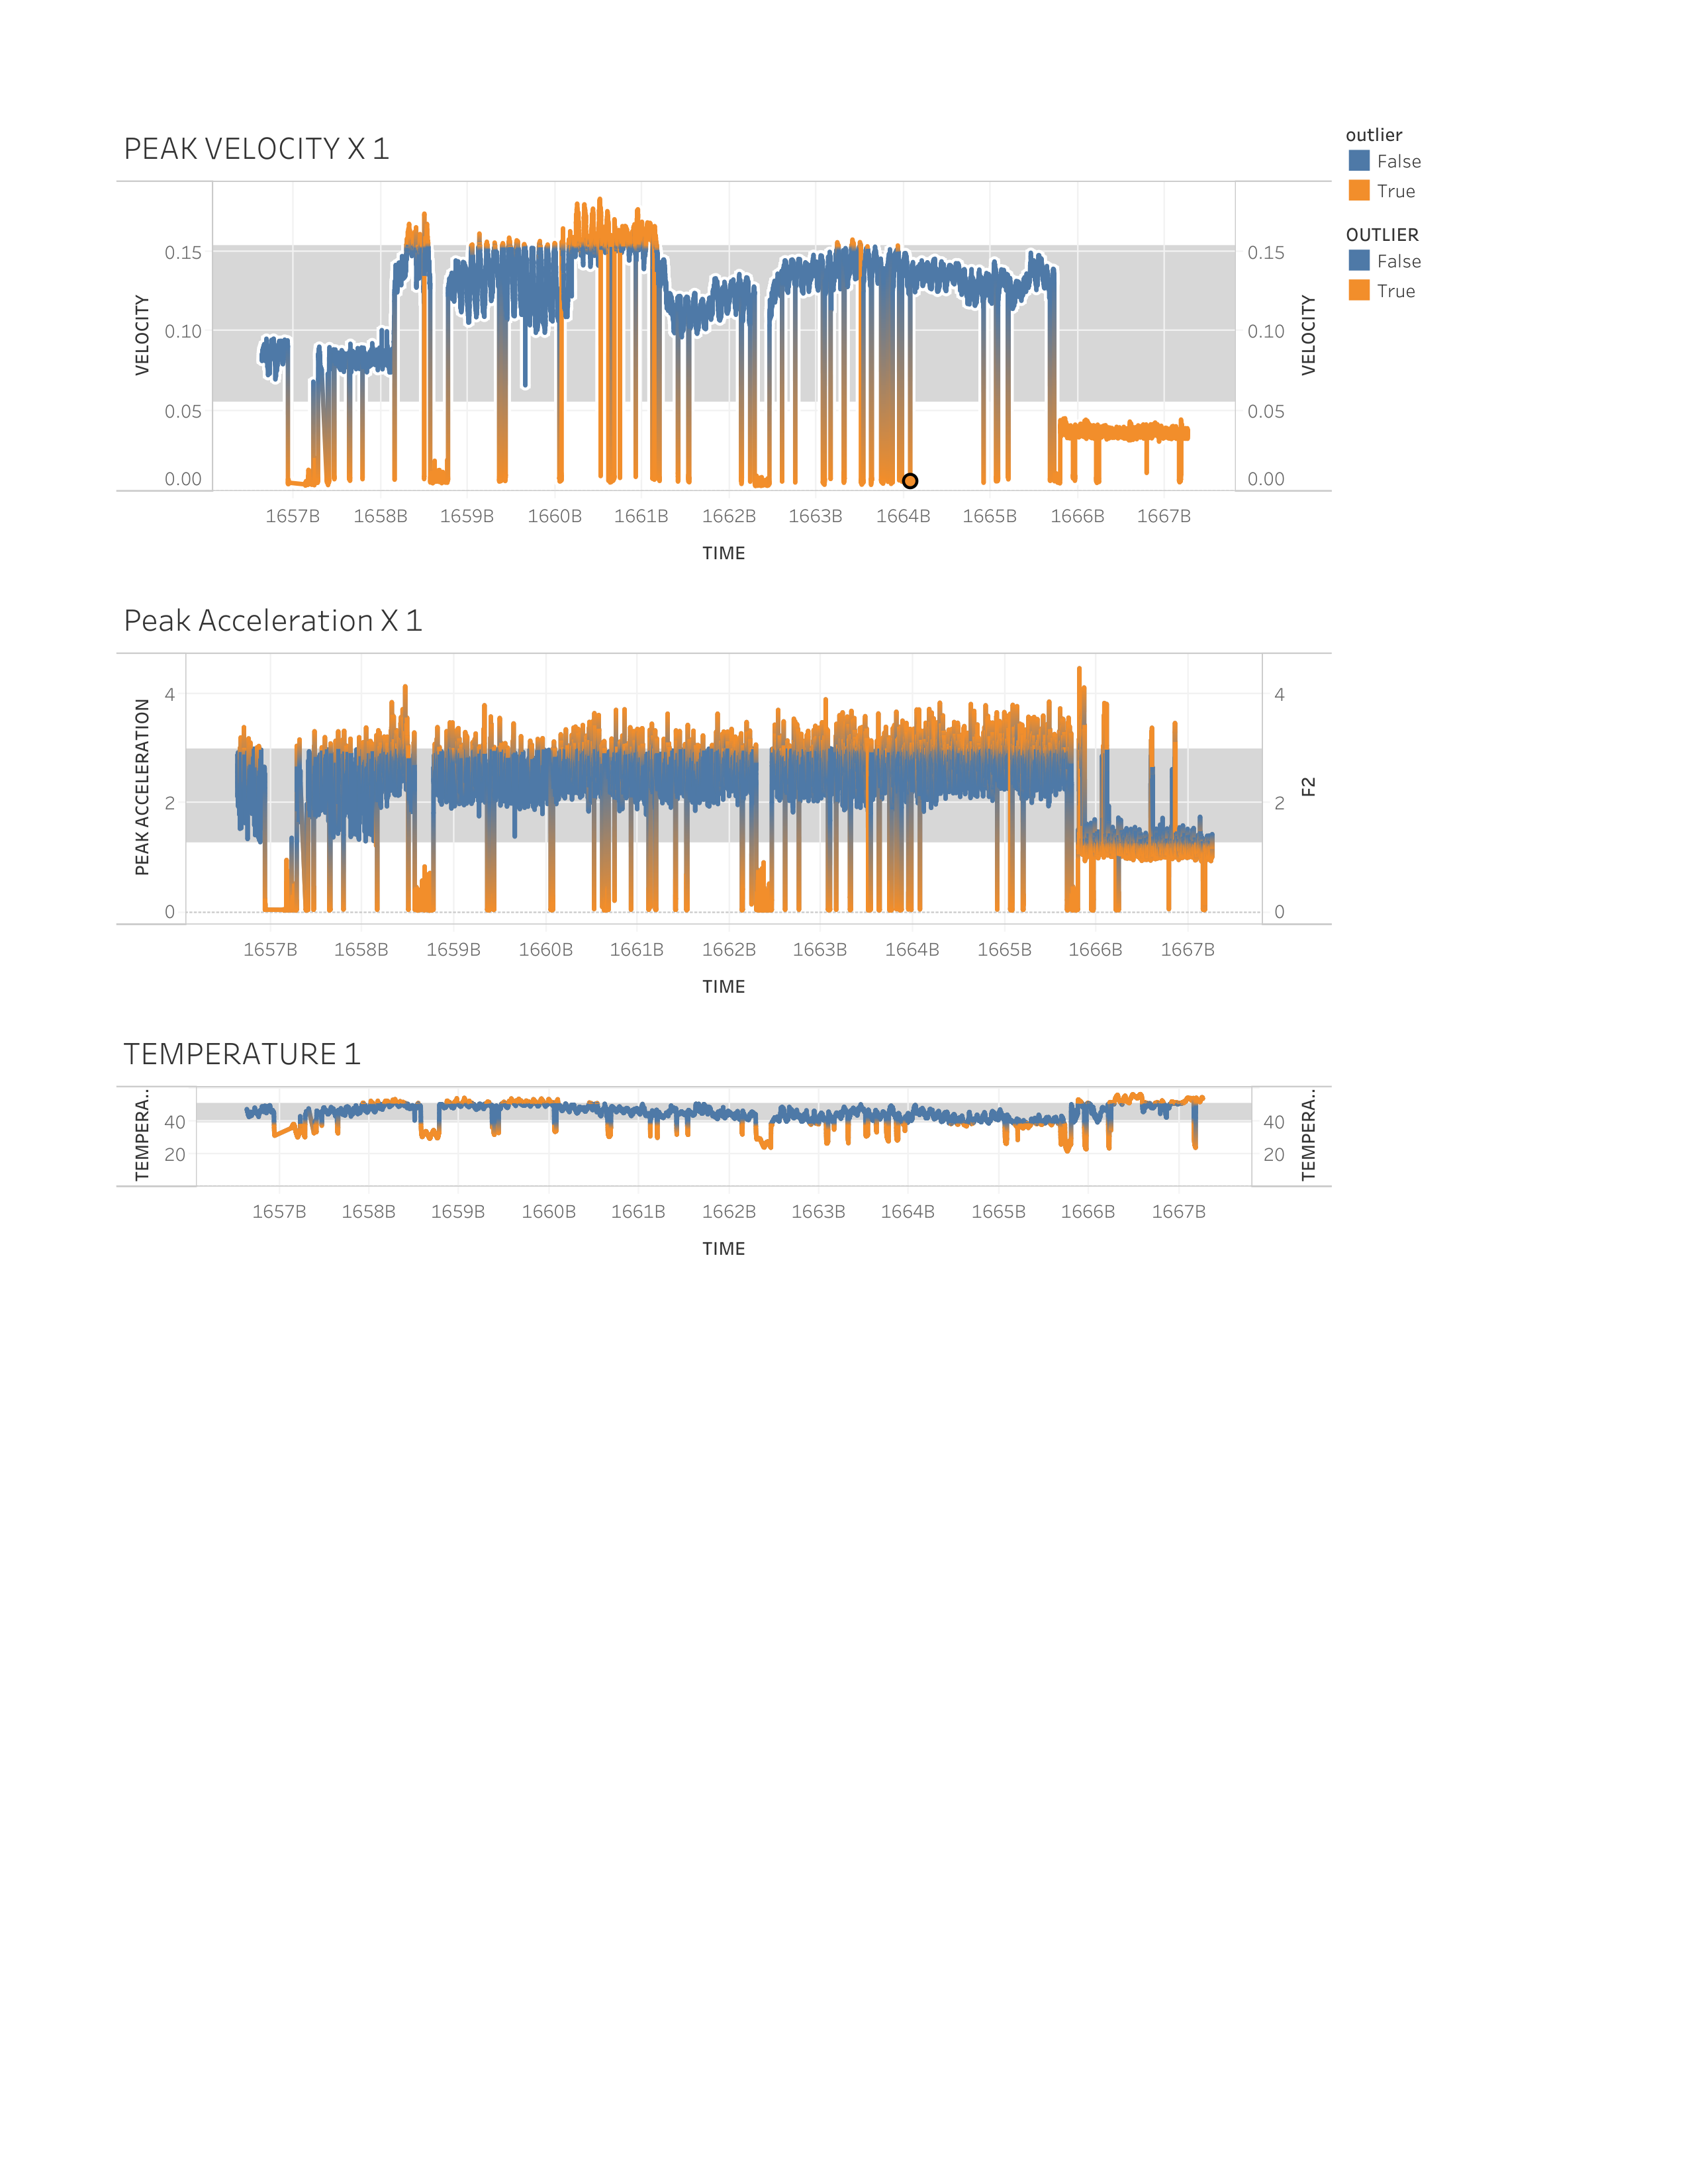
- It provides a dashboard for data manager to monitor machine health by giving them visualization by alerting whether the machine is not operating at a normal level (highlighted by the orange region). AI
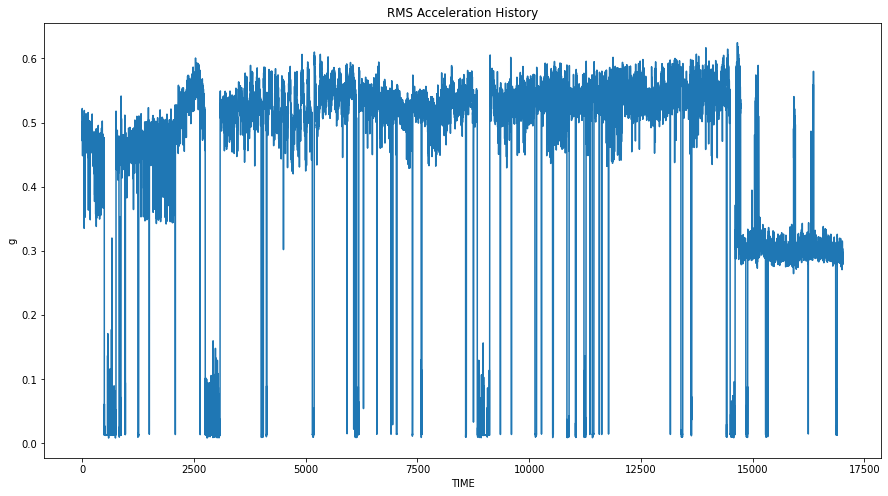
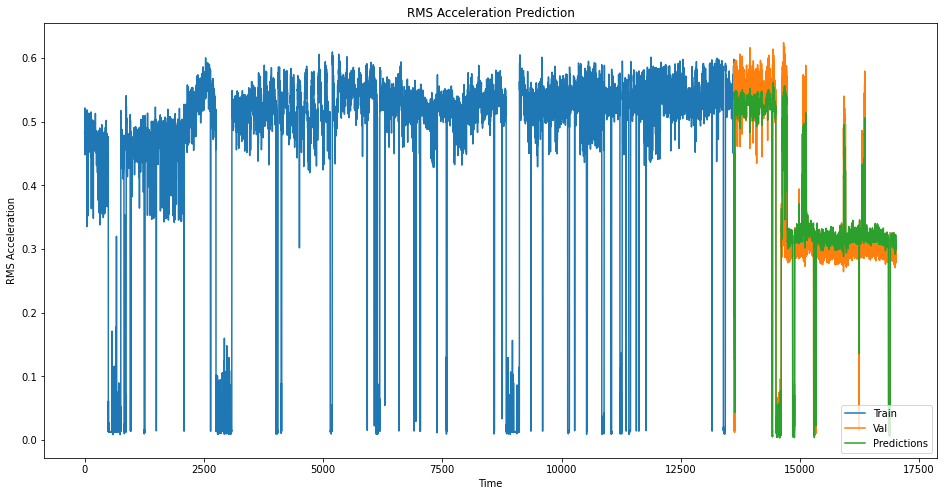
- It predicts when the machine will fail based upon past machine's failure. ## How we built it
- We imported .csv data to Tableau Public, and created Line Plot for illustrating data.
- Used Google Colab to run the LSTM model. ## Challenges we ran into Dashboard Initially, I was thinking of using Excel to store and create visualization. But such a solution may lack technical complexity, I turn to Tableau which create customized chart AI There are way too many AI model to train this dataset. Since I have seen stock trading as something similar to the data provided. I decided to use LSTM as the AI model, which is widely used to predict future stock price. ## Accomplishments that we're proud of Dashboard Able to display Fan #1 - #7 on Tableu, highlighting warning performance regions AI -Narrow the class of data used for training
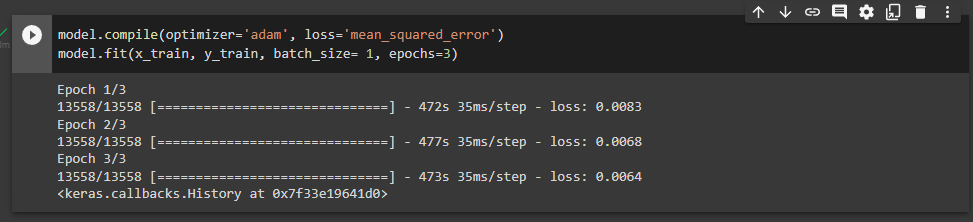
- Achieved loss of 0.0064 after 3 epochs using mean-square-error module ## What we learned
- Learned to use Tableau Public
- Learned LSTM model
- Embarrassingly, learned that I am not that good at Microsoft Excel
What's next for Using LSTM Model to predict Machine Health
- Converting UNIX time to UTC to make the visualization looks nicer

Log in or sign up for Devpost to join the conversation.