Devpost
Participate in our public hackathons
Devpost for Teams
Access your company's private hackathons
Grow your developer ecosystem and promote your platform
Drive innovation, collaboration, and retention within your organization
By use case
Blog
Insights into hackathon planning and participation
Customer stories
Inspiration from peers and other industry leaders
Planning guides
Best practices for planning online and in-person hackathons
Webinars & events
Upcoming events and on-demand recordings
Help desk
Common questions and support documentation
Sort by:
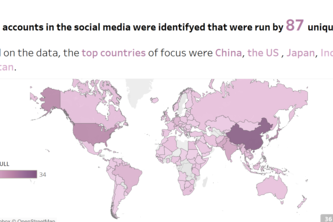
We analyzed and visualized different aspects of the China's state social media. Also, we did data scraping using Python to extract more information about accounts on different platforms.
Project
Unveiling China's Social Media Prowess: Global Influence, Platform by Platform.
Canis Pro: Illuminating Global Engagement - Transforming Diverse Social Media Data into Insightful Visual Narratives.
A graphic dashboard for visualizing the flow of Twitter information from Chinese entity owners to their parents, broken down by trade region.
I used Tableau (for the very first time!) to extract meaningful information from the data regarding the Chinese social media .
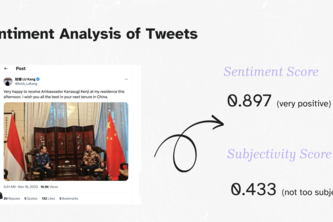
In this project, we investigate Chinese state media's Twitter presence in an effort to compare its influence in Western and non-Western countries.
Make art with your data, and share it with your team!
DiagnoSmart: Transforming Healthcare with AI Precision. Early Disease Detection, Seamless Connectivity, and Trustworthy Insights for a Healthier Tomorrow.
Finding the Underrepresented and underserved youth communities and make them accessible for the First Tee
At Orca, Stay Informed Anytime, Anywhere! We provide an app with quick features and a product for the visually impaired and deaf to access weather information.
KAcTcus and Analasso stayed vigilant on the dessert plains of San Pedro 1. They trekked to their final destination of their first rodeo (the beginners track). In the Rowdy Rowdy West.
How do we improve retention rates for students in poverty?
Analyzing funding levels among school districts is crucial for understanding & addressing educational inequities, which impact the opportunities & outcomes of students in different regions.
Exploring Daily Routine Efficiency through Data Analysis
Detecting disease before its too late
A way to visualize your ideal MBTA!
My this project predict and sugguest the solution of attrtition problem in the Ibm employees.
Sentix is an all-in-one platform that visualizes and facilitates the ever-evolving relationship between companies and valued customers. View customer feedback stats and receive response feedback!
Identify and mitigate nearby outbreak risk by taking control of your safety with proactive measures.
Discover NutriMentor - Your dietary ally and nutrition companion. Tailor-made for all, especially those with dietary restrictions. Unleash nutrition insights and craft personalized diets effortlessly.
Data: The Spice of Life, Now with Extra AI-zing!
We used Tableau to analyze America's two coffee chains.
Our goal is to help upcoming students look into multiple different undergraduate programs and see how many students are in that major alongside reviews.