-
OutbreakGuardian Logo
-
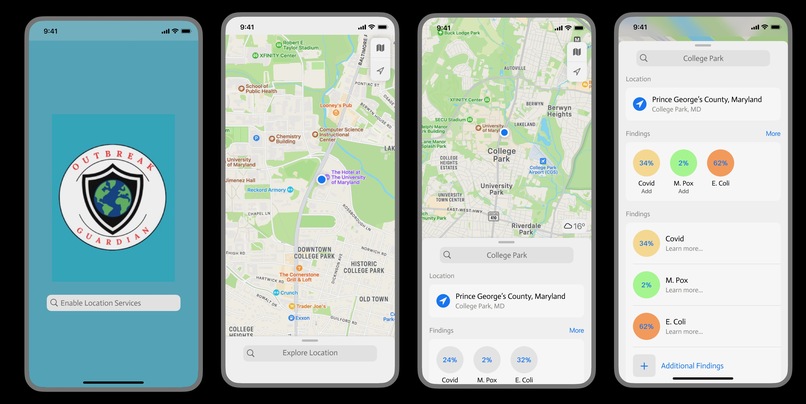
User App (Figma)
-
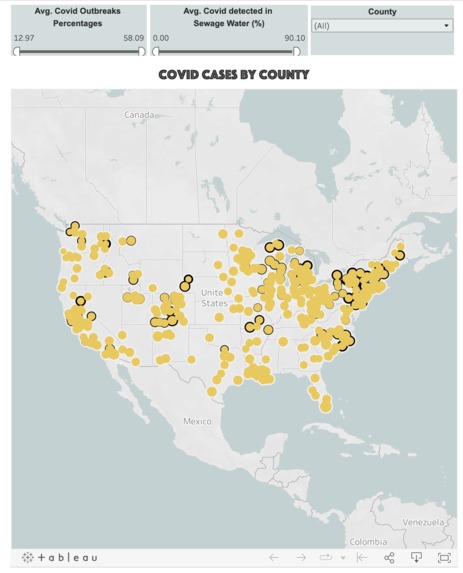
Interactive Covid-19 Dashboard (Tableau)

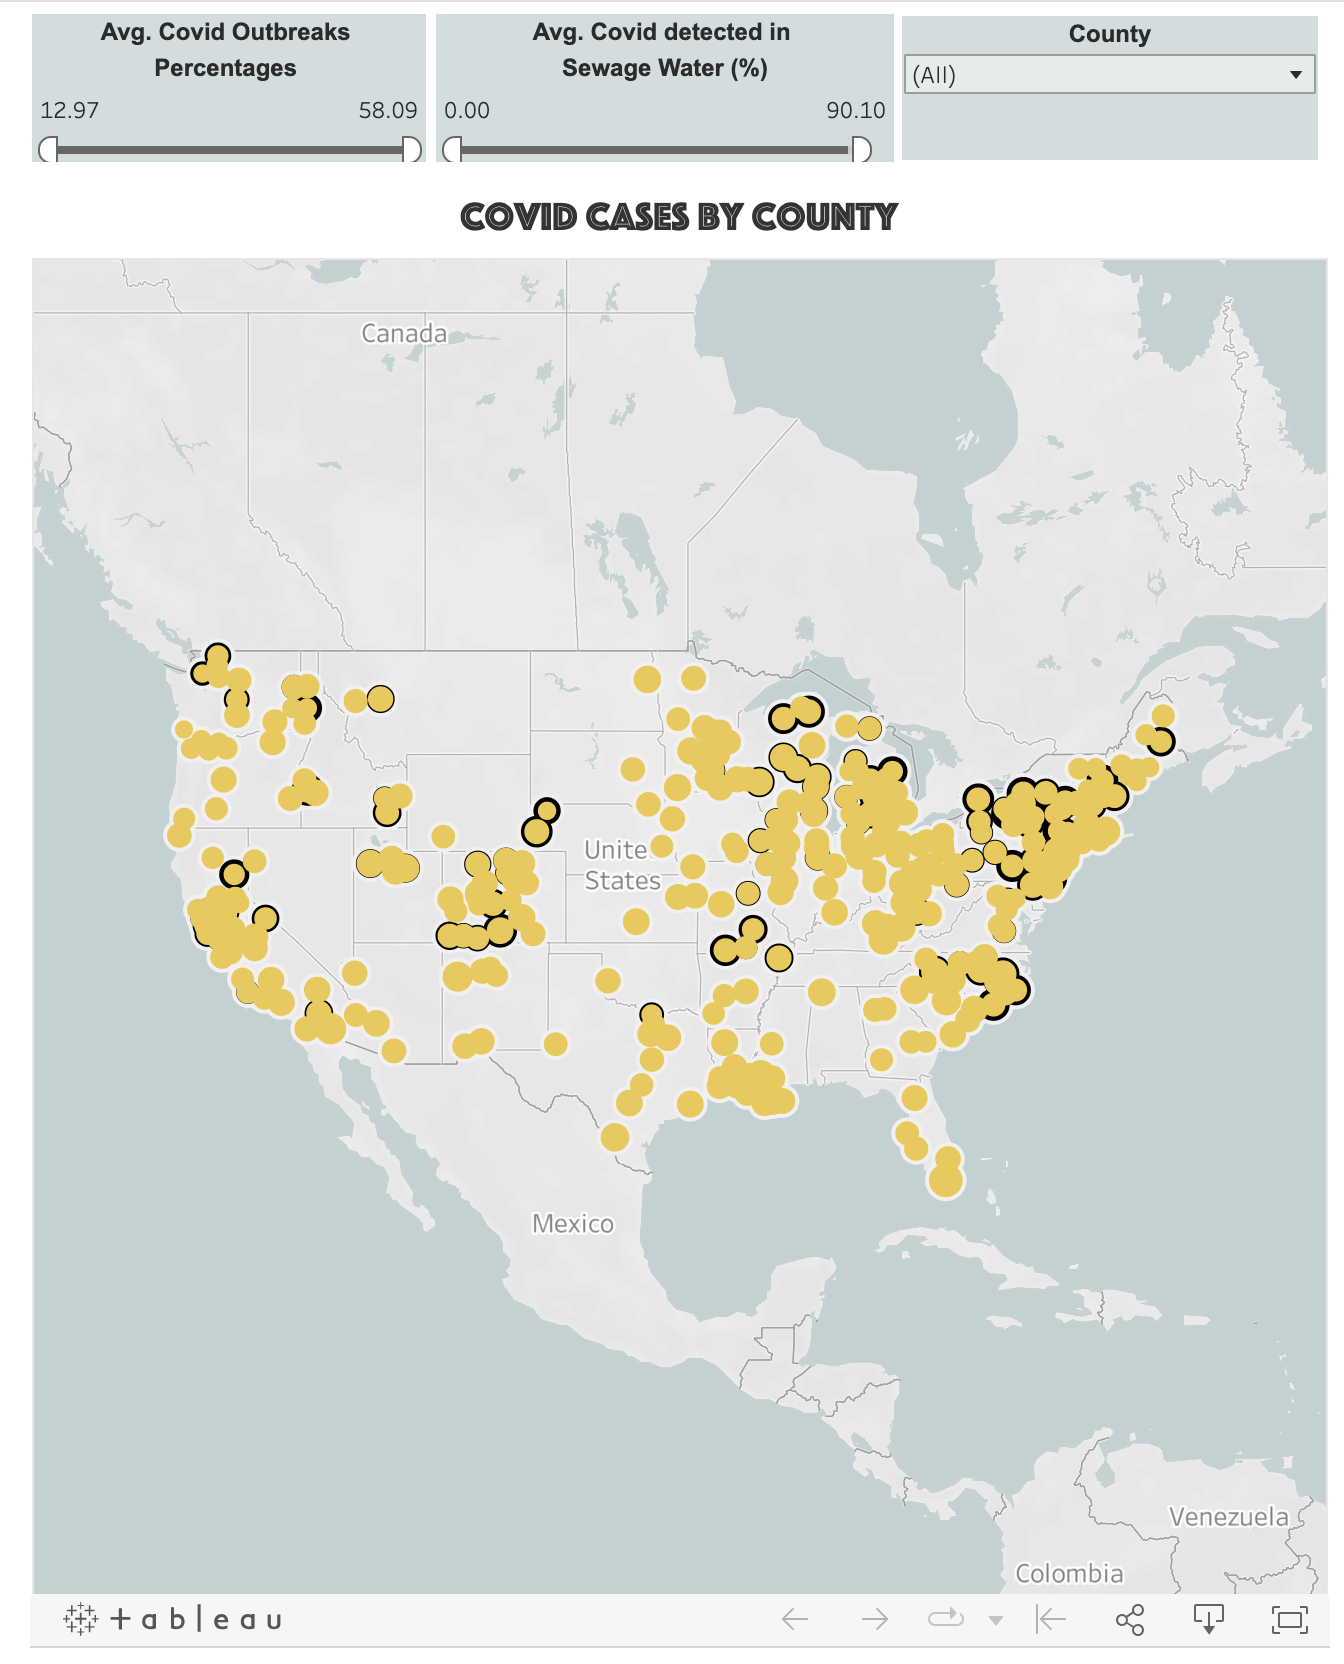
Inspiration
The inspiration behind OutbreakGaurdian is from the recent COVID-19 pandemic, one method the CDC uses to track the spread of the disease in communities is through a National Wastewater Surveillance System. Analyzing wastewater surveillance data can help identify outbreaks and track disease presence.
- 0-30%- low risk
- 30%-50% - moderate risk
- 60% - high risk
What it does
OutbreakGaurdian is for the consumer to identify what diseases are developing in their own neighborhood. This application can help in prevent the spread of the outbreak to improve the quality of life for our residents.
How we built it
We collected our wastewater surveillance data from CDC and EPA. Used Tableau to visualize our data and
Challenges we ran into
The first challenge we ran into was combining and analyzing data from different sources leading to data inconsistencies and format disparities. The second challenge we ran into was building an iOS app to showcase the outbreak risk data; however, we had difficulty switching between different pages using the Xcode button.
Accomplishments that we're proud of
Designing a Figma UIUX design with potential outbreak threats other than COVID-19 in sewer water.
What we learned
We discovered a robust positive correlation between sewage water data and the occurrence of COVID-19 cases. This connection was seen in urban areas where higher sewage levels were observed, potentially contributing to increased COVID-19 cases. This insight highlights the positive relationship between sewage water levels and positive COVID-19 cases, especially in densely populated regions.
What's next for OutbreakGuardian
We want to incorporate an alert system for various outbreaks using location services.

Log in or sign up for Devpost to join the conversation.