Devpost
Participate in our public hackathons
Devpost for Teams
Access your company's private hackathons
Grow your developer ecosystem and promote your platform
Drive innovation, collaboration, and retention within your organization
By use case
Blog
Insights into hackathon planning and participation
Customer stories
Inspiration from peers and other industry leaders
Planning guides
Best practices for planning online and in-person hackathons
Webinars & events
Upcoming events and on-demand recordings
Help desk
Common questions and support documentation
Sort by:
GradMove: your city move with insights on median rent, healthcare, transportation, and wages simplified. Engage with our interactive chatbot for any advice, making your transition smooth and informed.
To empower businesses through innovative AI solutions, enhancing efficiency and driving growth. Backend: https://github.com/jagadeesh-r1/hack-cewit2024 frontend: https://github.com/Joyaba9/HACK-24
Forecasting disease outbreaks in your area.
Use AI agents to do more, faster, cheaper A/B tests!
To the given dataset, we integrate weather, vegetation indices, and population to develop a two-fold AI strategy. The first model returns fire-prone regions, and the second - the severity of wildfires
Are you a chronic overspender? Do you suffer from consumerism? We'll take you on a humbling journey through your financial decisions - from 3 am McDonald's DoorDash orders to Amazon impulse buys.
Website dedicated to solutions to car dependency. The goal of our project is to raise awareness about the environmental impact of cars and provide resource about sustainable transit alternatives.
Introducing TeamUp, a unique way to form teams. Whether it's for group projects in schools, hackathons, or sports, our platform streamlines the process, ensuring a perfect team every time.
Created a visual dashboard with an interactive chloropleth map of London housing prices alongside interacting with the TfL API to assist users in home purchasing/renting decisions.
The best visualisation tool for undergraduates and passionate students.
This is a machine learning based stock price predicting system .
Developing trading algorithms with help of Python Chatbots, Shoonya API, Streamlit Handling for lightning-fast DATA UI Visualisation
Arboricide Analytics gathers energy consumption data from multiple devices (in the same business, household, or lab) and delivers real-time insights on kWh consumed, trees killed, and costs incurred.
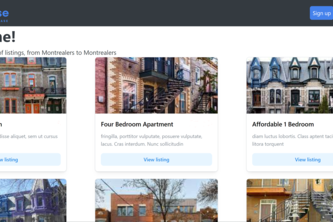
Re-Lease your existing lease, help the housing crisis!
Empowering all with visually-intuitive forex insights and elevated earnings call sentiment analysis – the future of accessible and democratized finance.
McByte or the Fast Food Economics Visualizer, is a website designed to illustrate the correlation between fast food prices and the respective economies of various regions worldwide
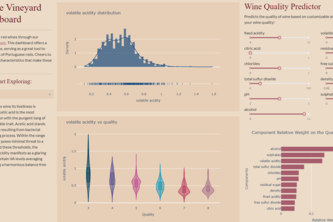
Explore the world of Portuguese red wines with our interactive dashboard!
Bringing finance dashboard monitoring to new heights. Sometimes what you need is at a glance get the feel or overview of a market. With a click, have a live view of a stock you want to keep an eye on.
We used OPS+ to determine the effects of travel on aggregate team offensive performance.
Graph Visualization of National Bank's Exchanges in the Equity Market
A powerful tool that unveils the unseen connections between criminal activities and weather conditions in our city.
Integrating carbon capture with HVAC systems for superior energy efficiency
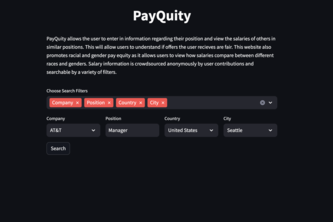
An application that allows users to search for job salaries based off various filters to promote racial and gender pay equity.
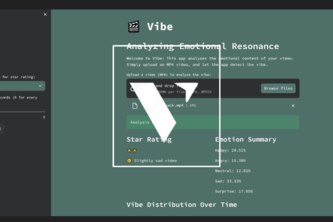
Analyze emotional resonance. Connect with your audience.