Devpost
Participate in our public hackathons
Devpost for Teams
Access your company's private hackathons
Grow your developer ecosystem and promote your platform
Drive innovation, collaboration, and retention within your organization
By use case
Blog
Insights into hackathon planning and participation
Customer stories
Inspiration from peers and other industry leaders
Planning guides
Best practices for planning online and in-person hackathons
Webinars & events
Upcoming events and on-demand recordings
Help desk
Common questions and support documentation
Sort by:
We were provided with an FDA-sourced datasheet containing reports of adverse side effects due to commercial products. Our job was to identify correlations between products and consumer demographics.
Many hours of data wrangling, EDA, linear regression, random forest regression
CraveFeed aims to be a social media for food connoisseurs ,enthusiasts and foodies in general. It also aims to introduce people to various culinary flavours & taste palettes from all across the globe.
Given information about an oil drilling site, we can accurately predict the oil production rate at its peak.
Deciphering FDA data to uncover key demographic patterns in adverse events tied to consumer products
I've harnessed the power of CAERS data to unravel patterns of adverse events. My mission? To safeguard public health.
speedruNUS is a Telegram bot that ranks all CS / CU modules for you to choose from after an interactive personality quiz to allow you to graduate without stress!
Empowering Oil Futures: Precision Peak Rate Prediction for Informed Well Development
Using Python and R to analyze CAERS data for trends to provide regulatory recommendations for the FDA
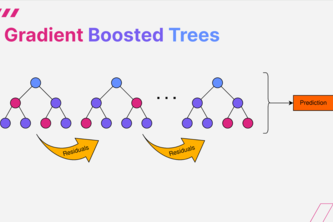
We buillt a complex model to predict the peak oil rate of Chevron oil wells.
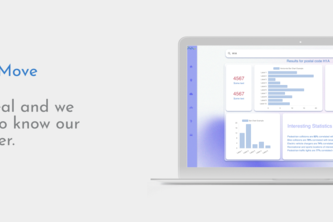
Are you tired of the uncertainty that comes with relocating to a new area? ShouldIMove is here to provide you with comprehensive statistics and insights about your new neighbourhood!
Tagline: CryptoBot: Navigate, Accumulate, Celebrate.
We used OPS+ to determine the effects of travel on aggregate team offensive performance.
Analyzing Chevron's Data.
Get That Bread: Kneading Your Financial Future – Bite into the real cost of living tomorrow, and invest in your dough today!
FishyFin is a hands-on system allowing financial professionals to visualize order trends as well as fishy trades inside of their systems with different exchanges
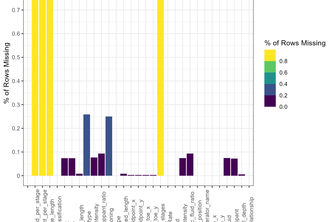
We used innovative data cleaning and feature engineering methods to turn an incomplete dataset into an excellent one. We developed a random forest model for accurate prediction and feature selection.
Comparing the win rates for the Houston Astros for home games vs away games from 2000 to 2023, inclusive.
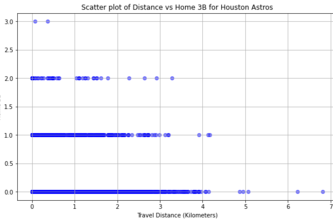
By analyzing the travel distance, number of days from the last break, and other information to determine the impact of travel on the team's performance
Pulse to the Rhythm of Health. A smart wristband prioritizing health, proactive alerts, daily motivation. Elevate well-being and academic success of students effortlessly.
Serving out clean and spicy data!
Using data analytics to show how travel affects MLB team performance so teams can make informed decisions ✈️⚾️
A powerful tool that unveils the unseen connections between criminal activities and weather conditions in our city.
The word on the tip of your tongue