How I Built It
I built this analysis by leveraging the CAERS Product-Based dataset, utilizing Python and popular data science libraries such as pandas, matplotlib, seaborn, and scikit-learn. The process involved data wrangling to handle missing values and duplicates, followed by exploratory data analysis to visualize distributions and identify patterns. Machine learning techniques, specifically logistic regression, were employed to build a predictive model for severe adverse outcomes.
Challenges I Ran Into
One of the challenges faced was dealing with missing data, which required careful handling through forward fill methods. Additionally, ensuring the accuracy and relevance of features for the machine learning model posed its own set of challenges. Navigating through the vast CAERS dataset while aligning with the project objective added complexity.
Accomplishments That I'm Proud Of
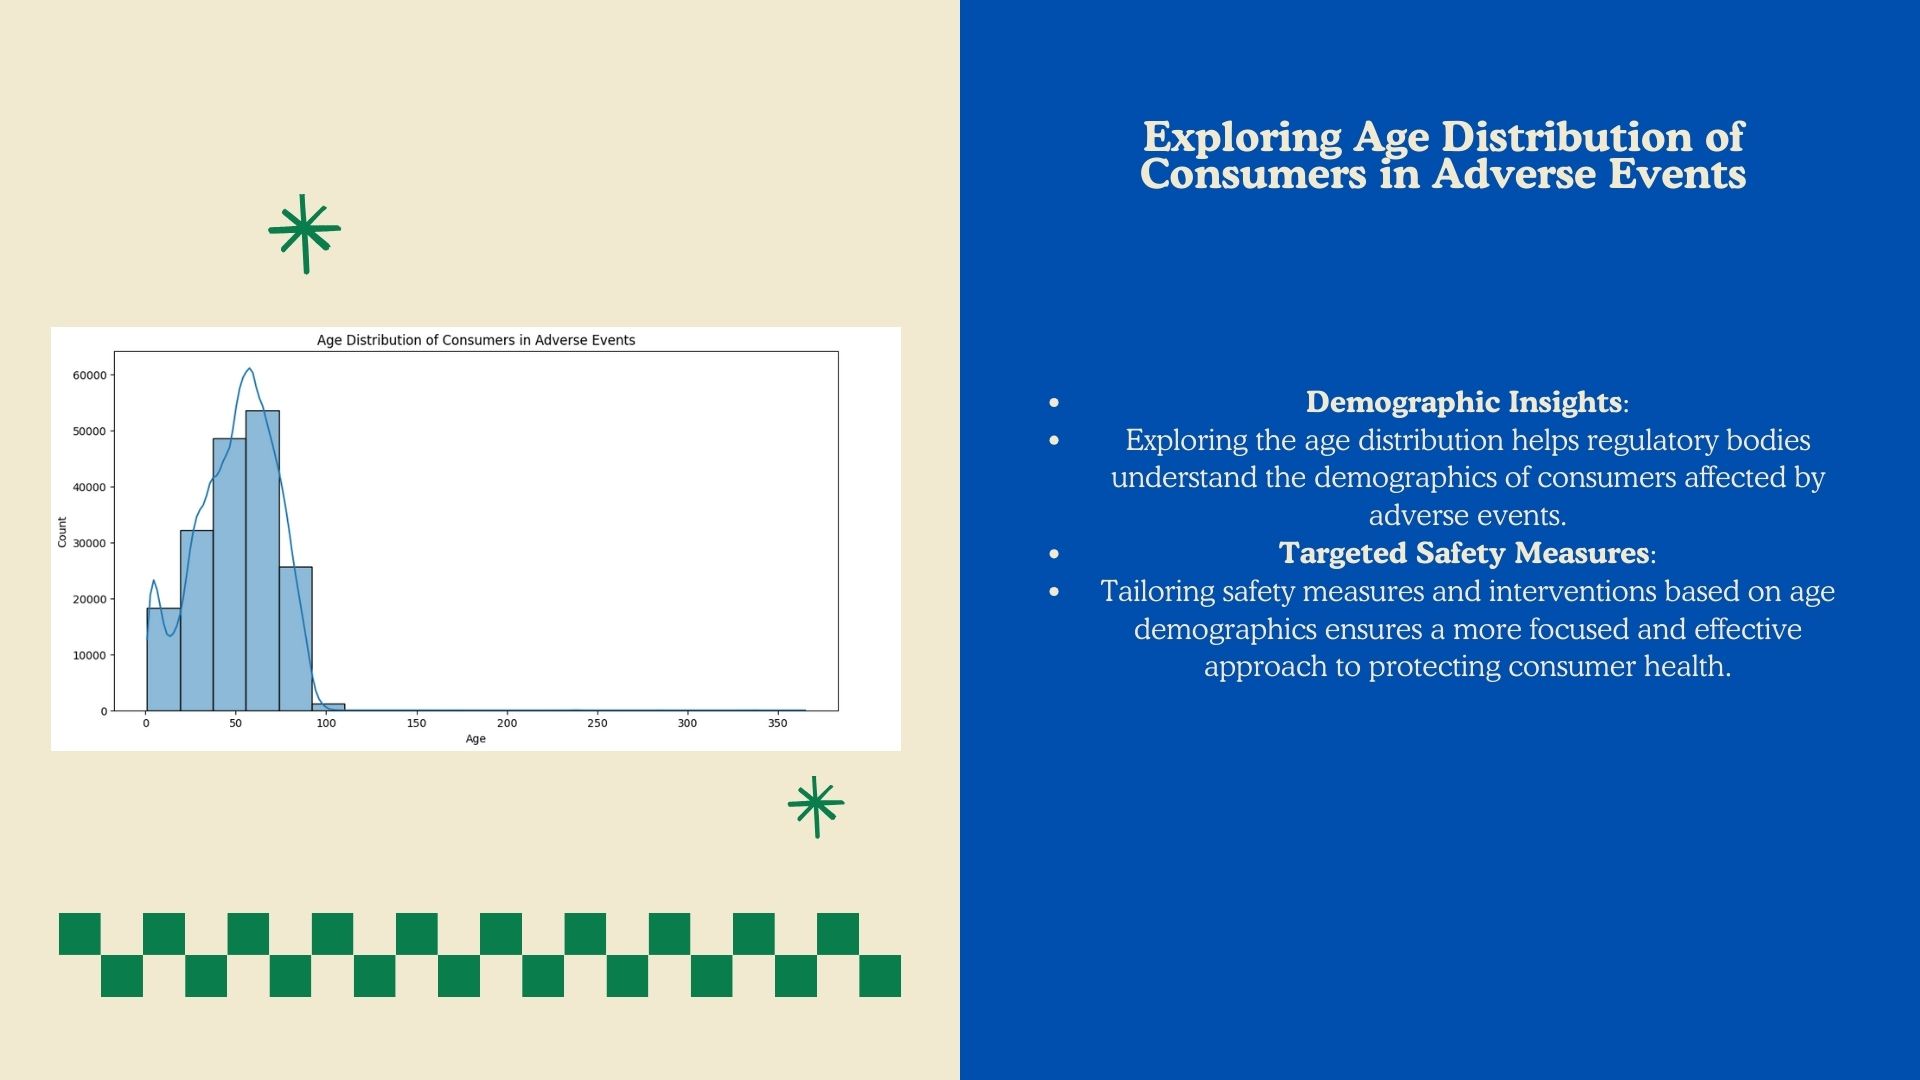
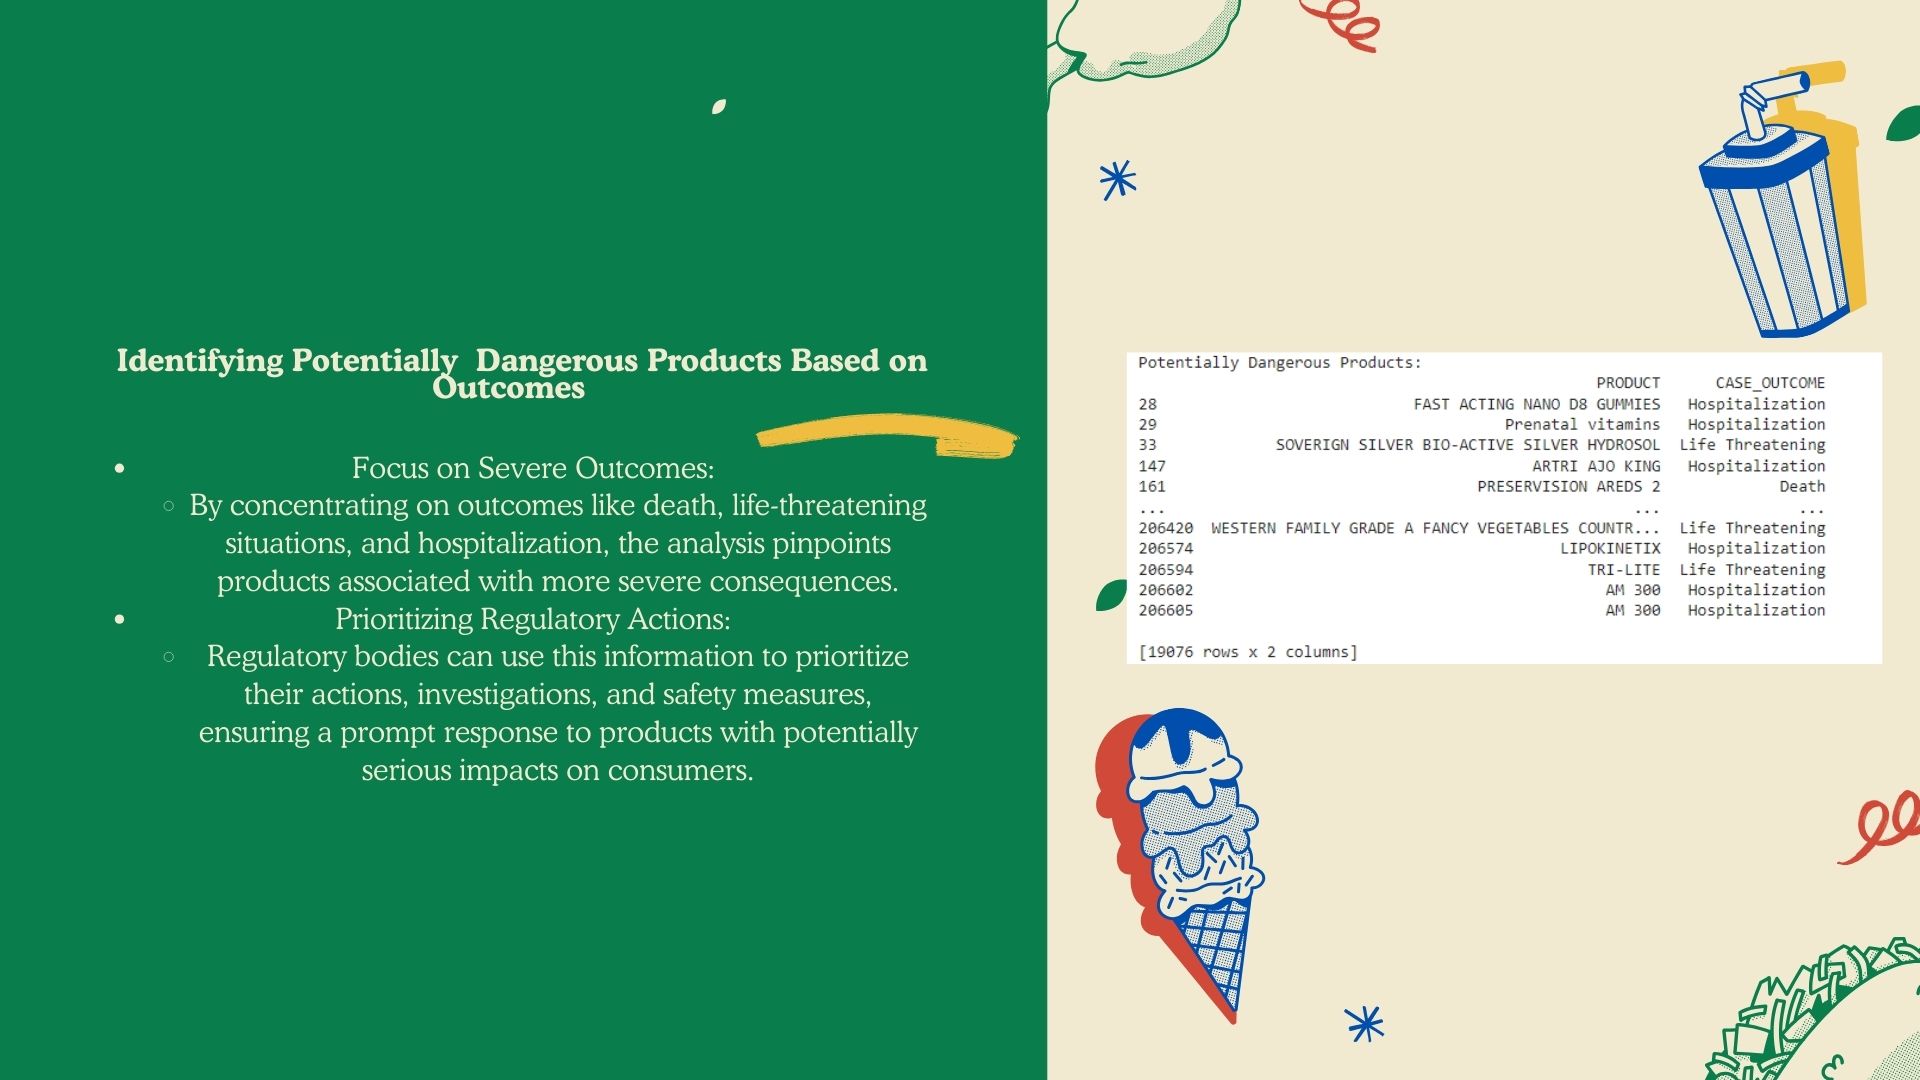
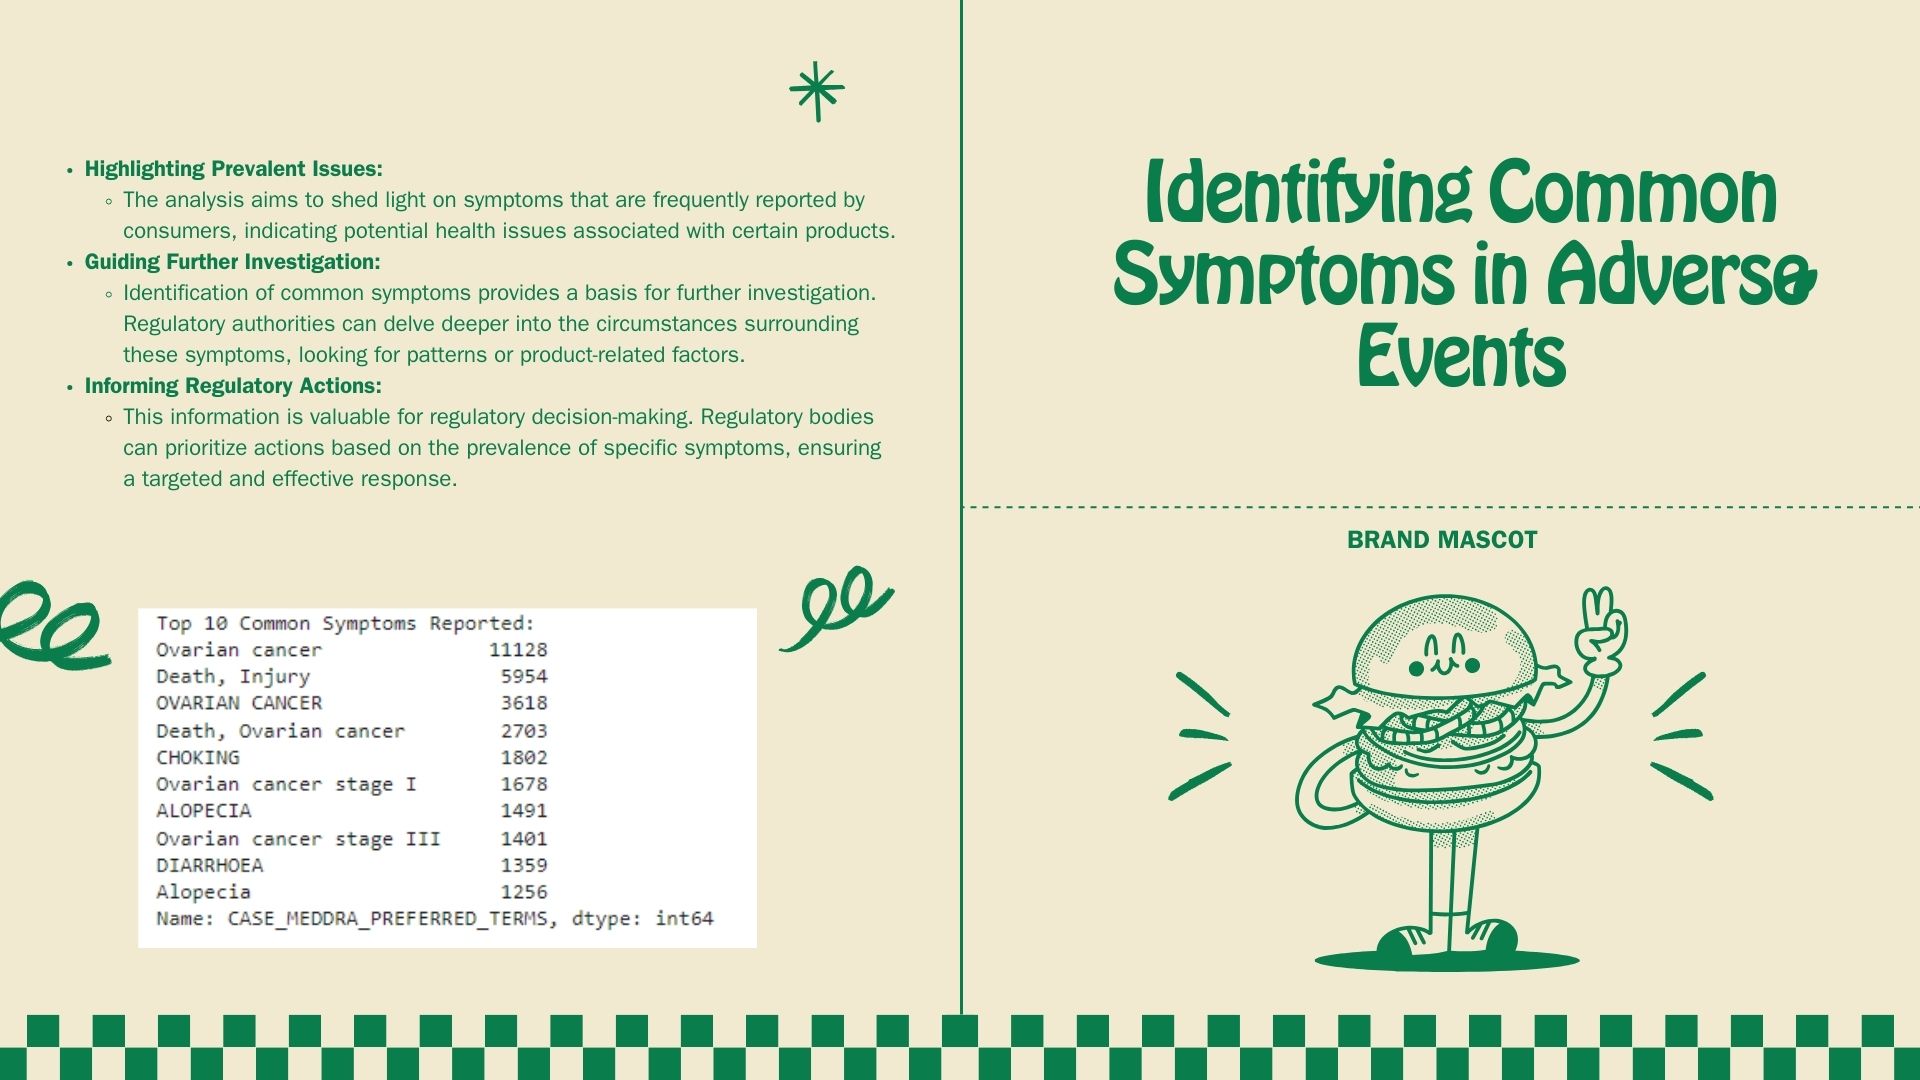
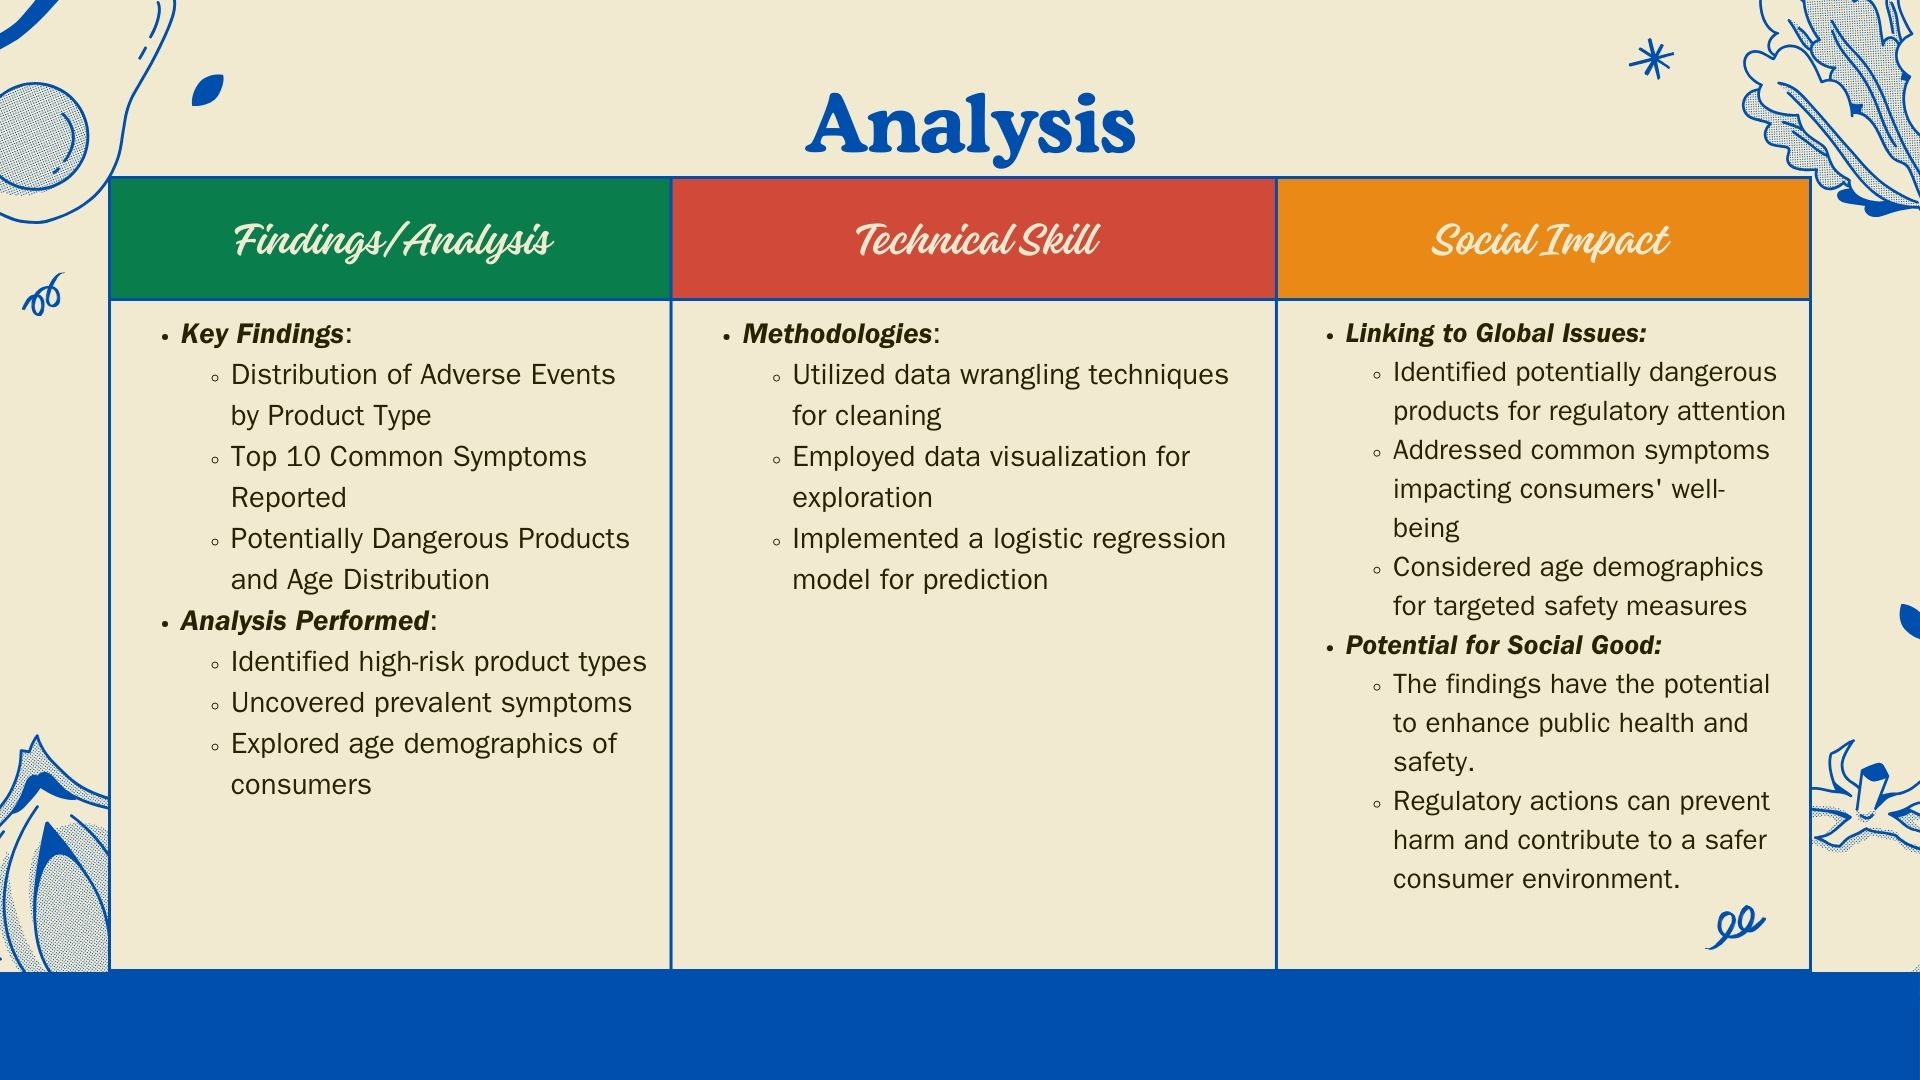
I successfully created meaningful visualizations to understand adverse event distributions, identified common symptoms, and pinpointed potentially dangerous products based on outcomes. Building a predictive model to assess the impact of demographic features on severe outcomes was a notable achievement.
What We Learned
Through this project, I gained insights into the intricacies of adverse event data analysis, including the importance of feature selection in building predictive models. I also learned how to interpret and communicate findings effectively, connecting them to the project's regulatory objectives.
Built With
- matplotlib
- pandas
- scikit-learn
- seaborn
Log in or sign up for Devpost to join the conversation.