-
-
Example Visualization
Inspiration
Upon receiving the beginner's track challenge of analyzing CAERS data of adverse consumer product reports, our team were interesting in discovering potential correlations between victim demographic, the consumed consumer product with adverse effects, and severity of symptoms after food consumption. We aim to conduct our analysis so individuals of different demographics can better learn the consumer products they are likely of increased risks of, and how much risks are potentially at stake in terms of symptom severity, to mitigate cases of adverse consumer product incidents.
What it does
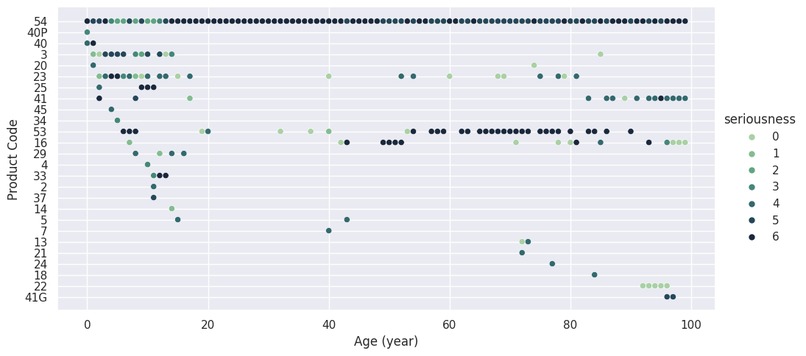
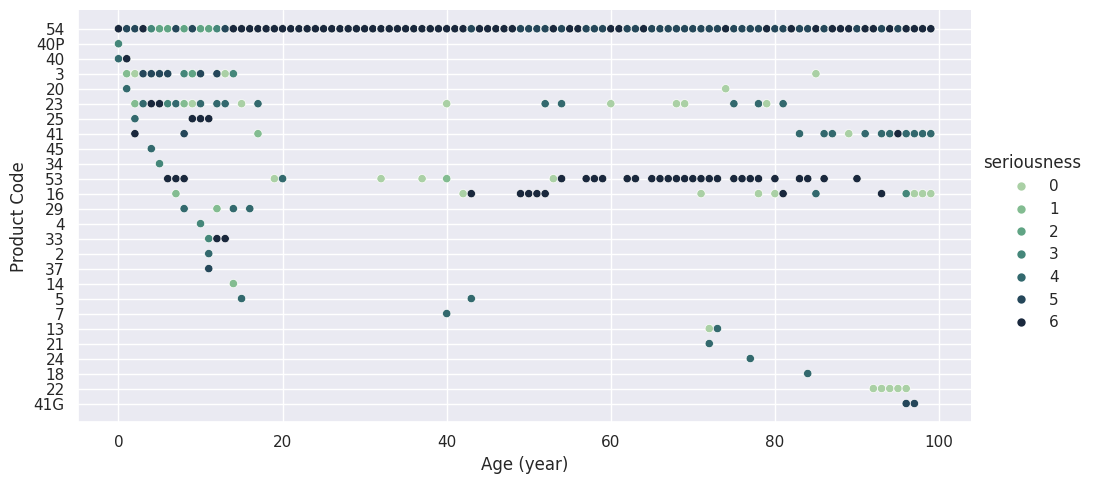
Our project predicts the consumer products that specific demographics are most at risk of. Our team considered demographic attributes of age and gender of victims recorded in the CAERS report. For each demographic, we also considered the historical data's severity upon product consumption to predict the likely severity level upon consuming said products. The most potentially adverse product types for each demographic, along with its predicted severity, are visualized in scatterplots.
How we built it
Our team started with cleaning and transforming our given data, clearing out null value entries, removing characteristics of each victim unnecessary for our analysis, and standardizing values such as time and symptom severity (presented as "seriousness". in our visualization). We then utilized the cleaned data to train and test a machine learning model based on the decision tree algorithm. With the prediction data, we visualized the most suspected adverse food product types for each demographic, with identification of predicted severity that is most likely going to occur for given demographic, into scatterplots.
Challenges we ran into
Our team consisted of two first-year students from the school of engineering and the school of natural sciences respectively, with very limited experience with Python and data science. We basically had to go with what we have learned from the one hour beginner workshop. This led to increased difficulty of figuring out what is viable to achieve with our time and resources, navigating the tools that are useful for our analysis, , and many other things, let alone the approaches we want to take with the data and debugging errors.
Accomplishments that we're proud of
- Made use of essential and popular packages for data science analysis
- Implemented learned machine learning models
- Created beautiful and informative visualizations
- Learning all of data science on spot
- AI in Education - Learned technical skill of machine learning as students new to data science
What we learned
- The overall cycle of developing a data science project
- How to transform data for effective data analysis
- Different machine learning models and what they are useful for
- Popular packages for data science analysis (Pandas, NumPy, MatPlotLib, Seaborn, Scikit-Learn)
- How to communicate data analysis
- Research skills for taking on unfamiliar tasks in short amount of time
What's next for Decoding Food Dangers
The next steps for our project are to refine the accuracies of our machine learning model, potentially making use of the data that have missing information in statistically meaningful way. Additionally, we can make use of other statistical techniques to discover patterns associated to the product types, such as clusters in certain age ranges, the frequency of appearance of products in different cases, and deeper analysis in severity and what likely led to them.
Built With
- github
- google-colab
- machine-learning
- matplotlib
- numpy
- pandas
- python
- seaborn


Log in or sign up for Devpost to join the conversation.