

Inspiration
One of our colleagues grew up on a farm in Iowa. We wanted to see if we could mash up the USDA datasets to help existing farmers become more productive. As we undertook this challenge, we kept a few design principles in mind: keep the data local and relevant to farmers, and layer interesting data on maps to draw insightful conclusions.
What it does
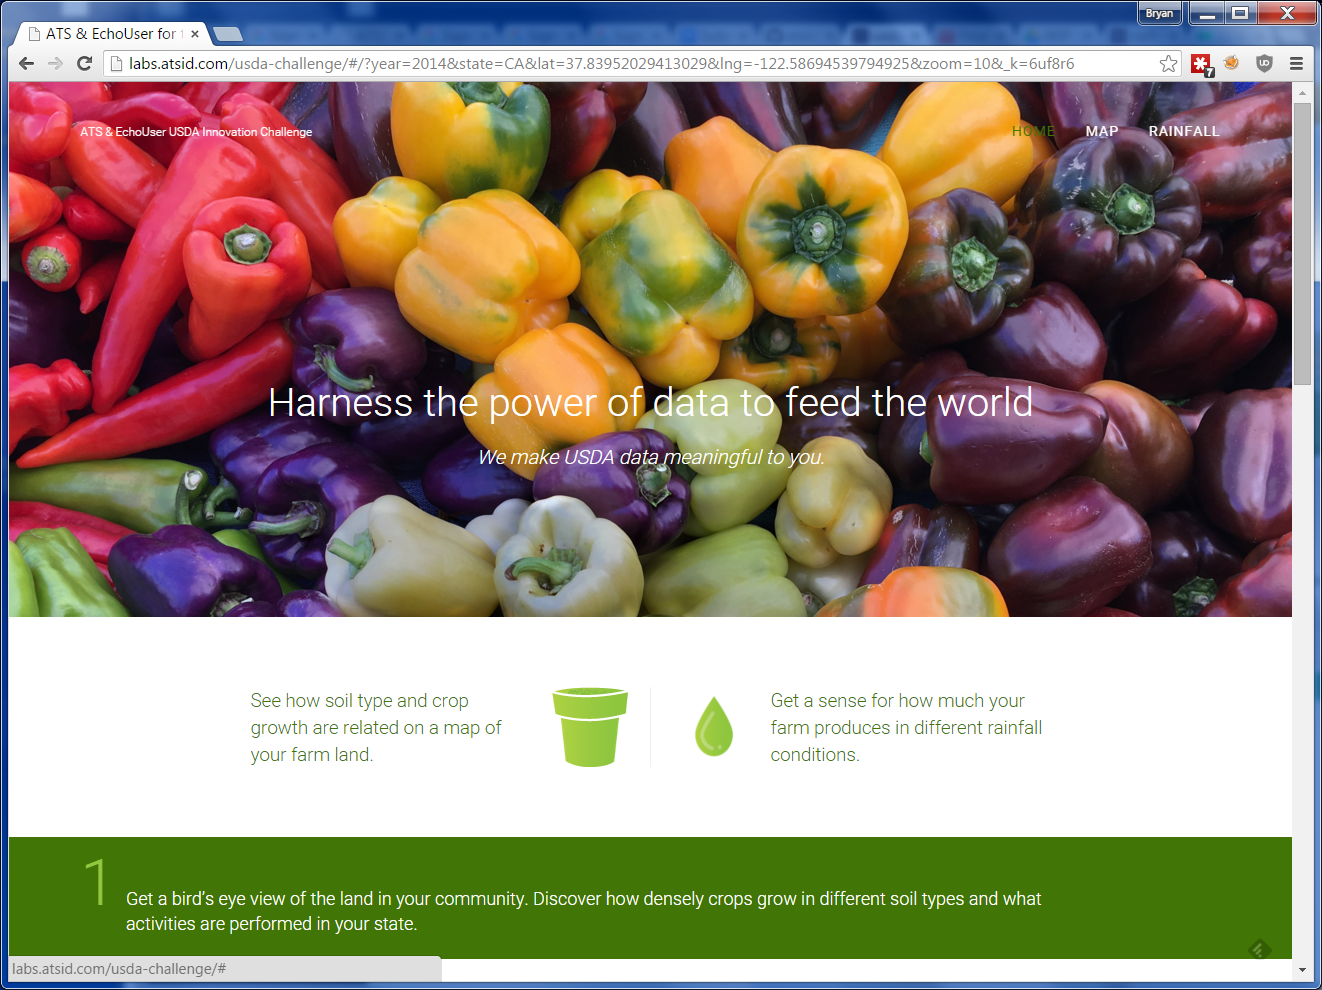
Our application maps your land and growth density data to identify problem spots and see how well your neighbors have taken care of their land, because you might be looking to expand your acreage. The rainfall and crop yield graphs reveal which crops performed the best in challenging precipitation years so that you can plan for dry years.
How we built it
We started with farmer interviews and data exploration. We tried to see what questions actual farmers are asking that we could answer from the data provided by the USDA. The number one issue that all of the farmers mentioned was water. We decided to combine the USDA data with a dataset from National Oceanic and Atmospheric Administration (NOAA) that contains precipitation and temperature data.
Architecturally the application is built using using Javascript, Node.js, React.js, Dc.js, and the google-map API. We use a combination of Bower, Node.js, and Gulp to test package and deploy the application. We tried to keep the entire application client side to simplify testing and development. We used github.com to host the source code during development. The project is public for anyone who would like to look under the covers.
Challenges We ran into
Constrained Data
We were constrained by the limited data in the datasets. For example, yield data was only available from the surveys that occur every five years. The activities data was not available in the granularity that we wanted and it is in the form of percentage of land on which each activity was performed over a year, rather than area-specific data about where herbicide was applied to specific plots of land.
Time
Given more time, we would have been able to implement visual details we had built into the planned experience using hi-fidelity wireframes that added an element of fun and polish, such as using a raindrop and leaf for the rainfall and yield graph.
We would like to explore more external datasets and pull data out of them to make meaningful connections. We would like to compare the temperature data from the existing NOAA dataset to yield data in the application.
Behavior Change
In terms of behavior, farmers don’t have the time to create or maintain online presence, so despite what we learned about the need to share experiences more efficiently in a more targeted manner online, we would have had to tread carefully with such a solution. Additionally, many farmers initially decided to farm in order to get away from the computer. Therefore, any technological application we build has to distill the data into digestible and actionable chunks that require minimal time to analyze. Where possible, we analyze for the farmer and point out information of interest.
Scope
Some of our most compelling ideas were out of scope for this project because they would have required us to use machine learning techniques to identify and recognize patterns from existing data and make recommendations for useful courses of action for the farmers. Other ideas, such as creating a social platform, would require building an active user base overnight.
Accomplishments that we're proud of
We reached a wide spectrum of farmers and began to really understand their workflow, motivations, and challenges.
We addressed both the hackathon’s challenge and farmers’ needs: An important part of sustainability is keeping food production and distribution local. Our map-based application appeals to farmers by showing them exactly what is happening on their land and in the surrounding local community. The Farmed application helps them understand their land holistically, using history as a teaching tool, so that they can make decisions that support increased productivity. Weather is the number one challenge cited by farmers. Our application arms them with historical weather data that they can use to plan crops for projected drought years. It is flexible enough for us to add real time weather predictions for short-term planning as part of future work.
The Farmed application focuses on a specific type of farmer and is designed with him in mind. We ensure that the farmer’s interaction with our application will be enjoyable and to the point.
What we learned
An Aging Population
Current farmers are aging out, resulting in a loss of knowledge. The US may soon see a lack of people growing healthy food close to home. The US is losing farms at an alarming pace, and the majority of farm subsidies go to animal feed and sugar, not healthy food for people.
Sharing Experience
Farmers, especially the young ones who are just starting out, cannot easily support or learn from each other, but it’s important to them to be able to share information, new approaches, and advice on how to respond to different challenges. They need to make decisions such as when to plant and harvest, what crops grow well in their area, what works with regards to soil type and weather patterns, and how to deal with adverse conditions. Farmers primarily plan their crops by spending time researching online or they get advice by talking to other farmers at farmers markets. They would like to receive information in the moment, but people are busy, and finding the right person to talk to is all about being at the right place at the right time. One way to facilitate sharing would be to combine farm journals and weather data across people and locations.
Finger to the Wind
We are trying to quantify things people aren’t used to quantifying. These things usually go by gut feeling, such as gauging soil moisture. Everything is in the farmer’s head, and they make decisions based on their experience. Farmers learn from their mistakes by reviewing their farm journals. There is an opportunity to help farmers focus attention during critical times with alerts that then lead to recommended responses. We would like to add recommendations to the Farmed application in the future.
Sustainability
Sustainability, like the term ‘organic’, means different things to different people. To many farmers, sustainability means taking care of the land, growing the soil, and managing the farm in such a way that the farm is a closed system that sustains itself. To some, sustainability is about being able to feed the nation in an accountable way for many generations to come. To others, sustainability is about feeding the local community and maintaining a balanced personal lifestyle.
What's next for ATS / EchoUser USDA
- Add soil survey data over the vegetation density data.
- Add temperature data over the rainfall and yield data.
- Train the application to suggest varieties to grow and activities to perform based on past performance in certain conditions (e. g. what sort of nutrient level adjustments need to be made for certain soil types).
- Help farmers focus attention during critical times with alerts that then lead to recommended responses.
- Connect farmers to each other to share their experiences dealing with infestations and the weather.
- Connect farmers to arrange transportation to markets, and coordinate truck routes and deliveries, in order to reduce the environmental impact.
A Walk Through Farmed
- Begin typing 'West Milford Road, Milford, NE, United States' into the search box above the map. You can select it from the autocomplete options.
- Click on the Plant Density tile on the bottom left corner of the map. The Map should be overlaid with vegetation density data. The green represents more dense areas.
- Select the year 2010 from above the map. The map will refresh with the vegetation density from the year 2010. Also notice below the map that the percentage of fields where pesticide was applied, manure was spread, and herbicide was applied is displayed for 2010 below the map.
- Scroll down to the 'Section that says "What do you grow?"
- Select the different crops one at a time. The crop yield to rainfall graph will update. It displays the yield data matched up with the rainfall data for that year. The rainfall data is calculated from the closest weather stations to where the map is centered.
- Notice the Monthly Rainfall graph. This graph shows the average rainfall for each month against the actual rainfall for the weather stations closest to the center of the map.


Log in or sign up for Devpost to join the conversation.