Devpost
Participate in our public hackathons
Devpost for Teams
Access your company's private hackathons
Grow your developer ecosystem and promote your platform
Drive innovation, collaboration, and retention within your organization
By use case
Blog
Insights into hackathon planning and participation
Customer stories
Inspiration from peers and other industry leaders
Planning guides
Best practices for planning online and in-person hackathons
Webinars & events
Upcoming events and on-demand recordings
Help desk
Common questions and support documentation
Sort by:
We show how rises in sea level will lead to financial losses and losses in housing stock.
Taxi Driver? Uber Driver? We will show you where to pick up your next passengers for maximum income.
We are connecting tree data with civic engagement, based on election turnout and 311 calls
Mapping NYC's urban harvest
What are the costs by zip code?
98% of U.S. Commuters favor Public Transportation for Others. Satirical though it may be, we aim to fix this attitude
Our site aims to display the impact of various modes of transportation on air quality, specifically ozone levels.
Shows how food inspections and fines affect Yelp ratings
Did you know?
Find a sweet spot to start your new business in Montreal using Yelp business info and open data.
Urban H2O is an interactive map of water quality complaints in NYC.
Analysing address-electorate changes in NSW from 2013 - 2016
Modify transit to favor local business
Redistributing and consolidating Staten Island's bus system based on hubs.
A data story that visualizes the problem, understand the decision drivers and uncover observations to optimize route
More efficient, effective local service for Staten Island
tagline dummy
Use the latest machine learning techniques to improve graduation rates
Actionable recommendations to increase graduation rate using machine learning along with interactive visualizations
Global Symptom Exploration Using Machine Learning and Data Visualization
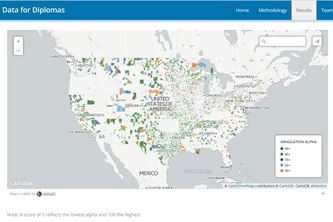
Interactive map of relative graduation rates plus an analysis of how school size impacts graduation rates.
Интерактивная карта участковых и отделов полиции
Data visualization to motivate concrete policy change
Визуализация застройки по дате, периоду и архитектурному стилю