Devpost
Participate in our public hackathons
Devpost for Teams
Access your company's private hackathons
Grow your developer ecosystem and promote your platform
Drive innovation, collaboration, and retention within your organization
By use case
Blog
Insights into hackathon planning and participation
Customer stories
Inspiration from peers and other industry leaders
Planning guides
Best practices for planning online and in-person hackathons
Webinars & events
Upcoming events and on-demand recordings
Help desk
Common questions and support documentation
co-founder of @rocketgraph
See where you stand in the open source world.
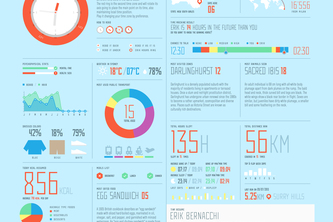
Bank Statement Reinvented through Data Visualization
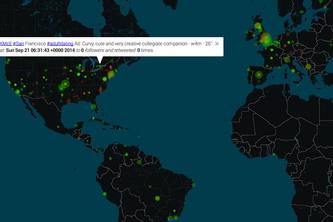
Real-time weather visualization via Twitter geotagging.
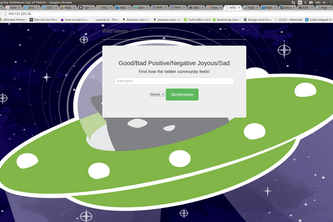
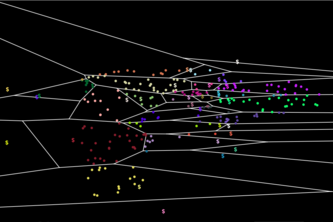
A query-able twitter application that allows you to visualize the sentiment of a current keyword or phrase on twitter
A web app that graphs the mood of a twitter user's recent tweets
Extracting as much structured information as possible from unstructured text using text analysis and visualization.
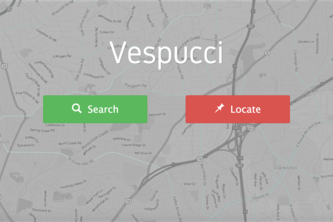
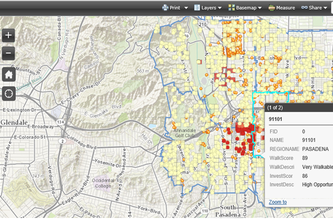
Figure out which real estate locations are undervalued
interactive space visualizations and data analysis
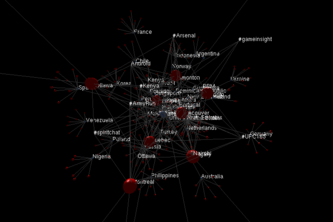
Geographically visualizing the sentiment and influence of tweets
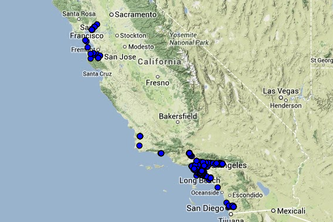
Show the clusters of real life customers in relation to each vendor you have!
We created a dynamic visualization of millions of taxi routes in New York City
Statistics,archive and EXPORT your weekly discover spotify playlists
Analyzing the usage of tabs provided by Literacy Lab
Hands free weightlifting data analytics
Always keep in the loop no matter where you travel in the world in a matter of instants
Use beacons to find out where employees spend their time in-office to better plan spaces for productivity
EEG, motor movement, and speech analytics for public speaking


![Spotlist [Free]](https://d112y698adiu2z.cloudfront.net/photos/production/software_thumbnail_photos/000/338/823/datas/medium.jpg)
![Spotlist [Premium]](https://d112y698adiu2z.cloudfront.net/photos/production/software_thumbnail_photos/000/338/829/datas/medium.jpg)