What it does
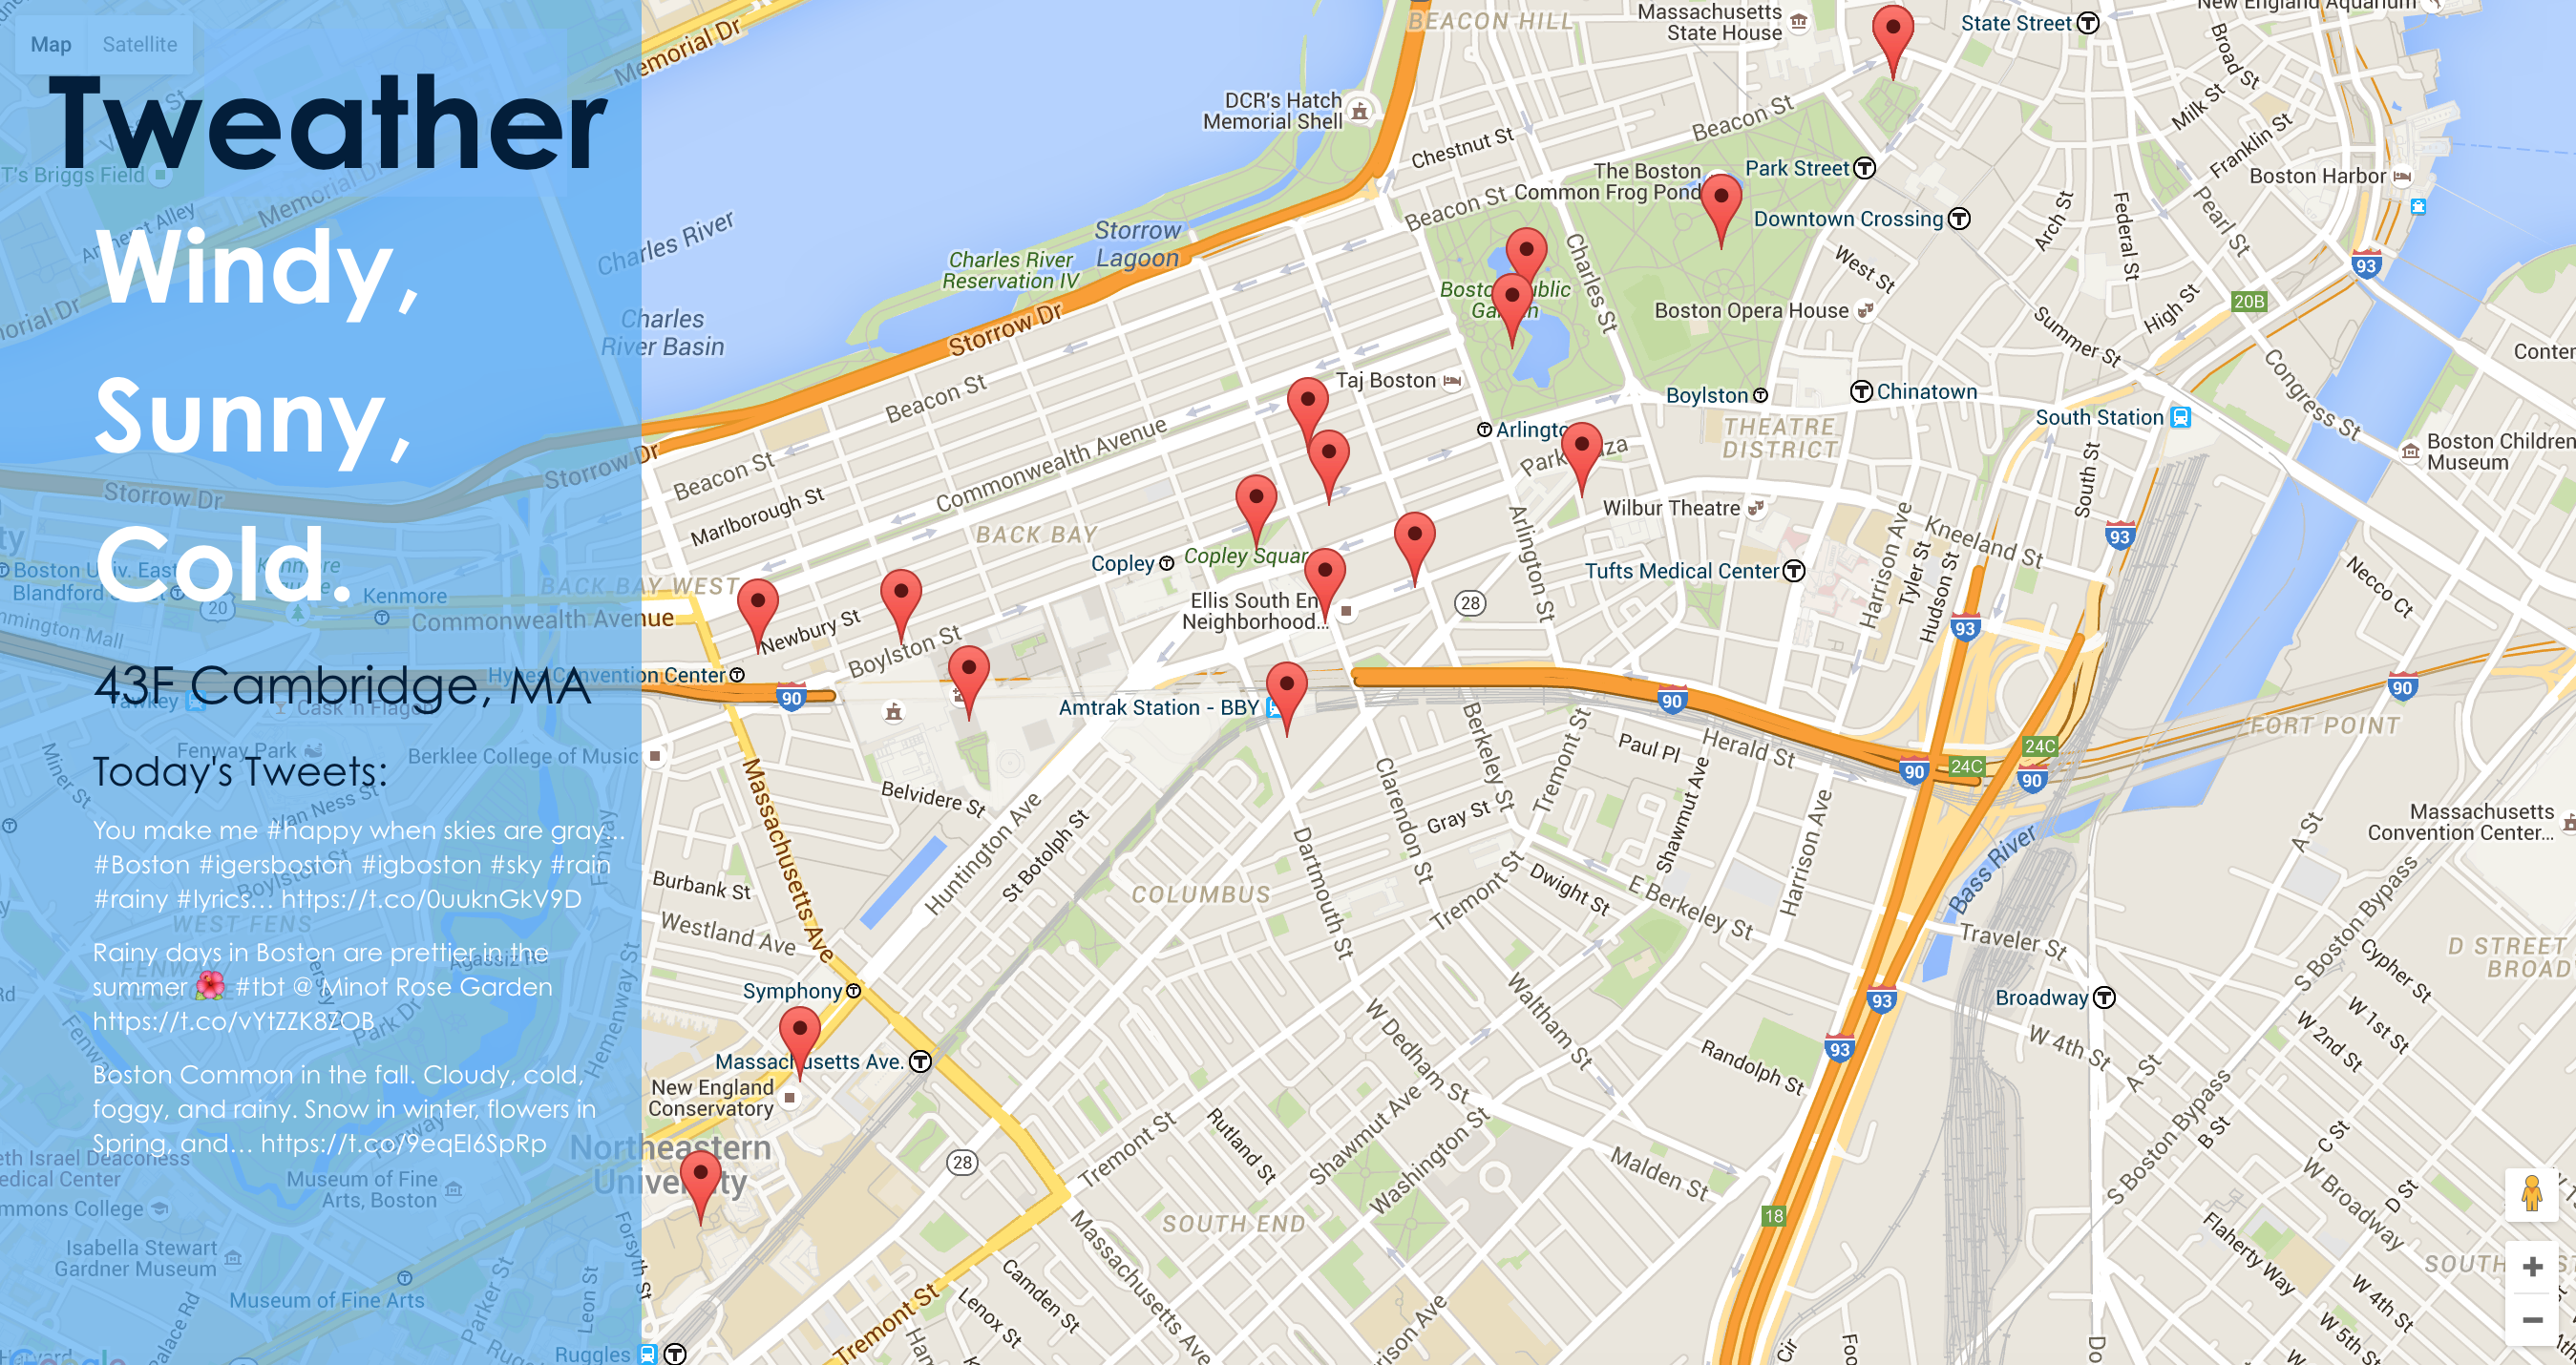
Given a location and a date, Tweather forms a corpus of recent, nearby geotagged Tweets. Tweather then performs rudimentary sentiment analysis on the Tweets to form a qualitative description of local weather. Using the Google Maps API, Tweather creates a visualization of how people are responding to the weather.
How I built it
We used Python as a backend for pulling and analyzing Twitter data, as well as Javascript, HTML, and Flask for creating the webpage.
Challenges I ran into
Figuring out how to integrate Flask with Javascript was our biggest issue.
What we learned
After several failed attempts at other hackathons, we finally learned how to integrate Python code into a webpage. We also learned how to parse JSON objects, how to use the Google Maps API, and how to scrape data from Twitter.
What's next for Tweather
We're hoping to make the site update in real-time, so the user can see new Tweets without refreshing.


Log in or sign up for Devpost to join the conversation.