Devpost
Participate in our public hackathons
Devpost for Teams
Access your company's private hackathons
Grow your developer ecosystem and promote your platform
Drive innovation, collaboration, and retention within your organization
By use case
Blog
Insights into hackathon planning and participation
Customer stories
Inspiration from peers and other industry leaders
Planning guides
Best practices for planning online and in-person hackathons
Webinars & events
Upcoming events and on-demand recordings
Help desk
Common questions and support documentation
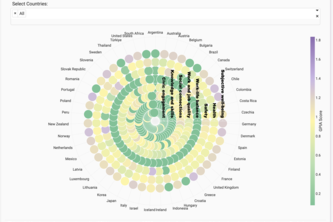
An interactive dashboard visualizing gender parity across countries, domains, and time using OECD well-being data — revealing where male or female outcomes differ and how parity evolves globally.
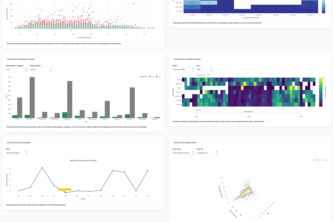
Unlock the psychology of banking. This interactive story goes beyond demographics to decode the hidden drivers of customer financial decisions, revealing what truly motivates a 'yes' to a campaign.
HealthScope: A vibrant, modern dashboard that visualizes health data to reveal patterns in age, risk, and disease. Designed for clarity, insight, and smarter healthcare decisions.
State-wise insights on literacy, schooling, youth, and menstrual hygiene supporting SDGs 3, 4, 5, 6. Spot gaps, compare states, and drive better outcomes for women, children, and future generation.
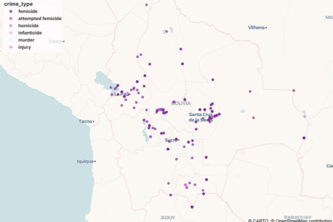
A data-driven storytelling project that transforms news into a visual narrative of femicide in Bolivia, revealing patterns of violence and restoring visibility to women whose lives were taken.
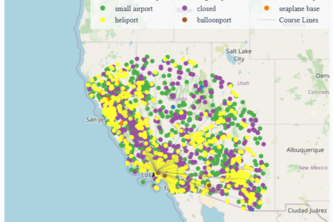
An interactive dashboard to explore airports in the United States by type and elevation discover extreme and remote airports with ease.
Cute pink dashboard, focusing on women's well-being