Devpost
Participate in our public hackathons
Devpost for Teams
Access your company's private hackathons
Grow your developer ecosystem and promote your platform
Drive innovation, collaboration, and retention within your organization
By use case
Blog
Insights into hackathon planning and participation
Customer stories
Inspiration from peers and other industry leaders
Planning guides
Best practices for planning online and in-person hackathons
Webinars & events
Upcoming events and on-demand recordings
Help desk
Common questions and support documentation
Sort by:
We built a web app that displays real-time campus CO2 emissions, correlates historical energy load with emissions, and predicts 12 hour energy load via an AI model for Engie's MLH coding challenge.
What if somebody else had played that role?
The record label for your pocket.
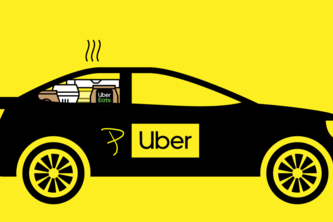
A smarter way to book an Uber. Predicts the cheapest time to book an Uber - based on weather conditions - in the next ten hours.
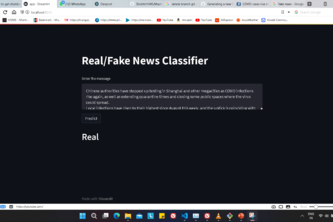
AI model that can predict if a news is real or fake before it goes viral in social media.
using machine learning algorithms to predict whether the news is fake or real.
Provides a near-term forecast of procedures for patients by using their latest unstructured patient visit summaries
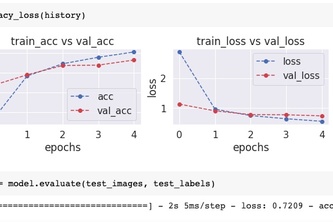
This model will be able to determine whether the provided news is fake or not with 0.934 accuracy.
In this project,we predicted the quality of education by taking parameters like infrastructure,passout, and Ph.D. qualification of teachers, by using ML we sort out the errors in the education system.
Be smart and protect your heart.
This project is made to show the importance of education. And analysis of education field that in which areas development is required.
Disease Prediction
Our goal is to use historical data and crowdsourcing to build an optimization model and platform to empower gig economy workers with the ability to make informed decisions
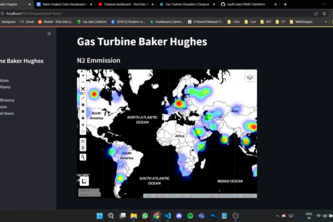
Our Gas turbine visualizer acts as the first step towards a monitoring sustainable energy future by understanding and visualizing where today's energy system's worst problems exist.
This code can take a scrambled image split into 4 quadrants and predict its correct order with ~75% accuracy.
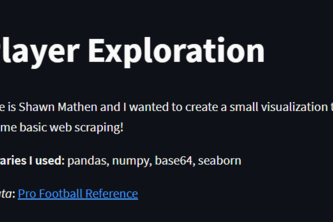
Have you ever really wanted to see the best running back in the NFL, but the Pro Football Reference website is so unappealing and rough on the eyes? My app makes it easier to view this information!
We took five mystery-embedded articles and used metrics to compare the embeddings. Then we sorted the comparisons and gauged the meaning of the articles based on the different metric outputs.
We explored the association global emission changes over the decade, and how they may relate to real-time climate events happening today, such as heat waves.
A web application developed to allow anyone to visualize the data that makes up the San Francisco Flood Health Vulnerability Index by neighborhood.
The Relationship Between Political Affiliation & Greenhouse Gas Emissions in Counties Across the U.S.
We analyze how the count of wildfires and its consequences have changed over time as a function of climate change, and its indications for our climate and health.
Using the Harvard Twitter dataset, we harvest geospatial and temporal data to see how certain states react to climate disasters in the context of climate change.
This is our analysis of the Storm Events across the United States, with a focus on the damage caused by calamities in the Tornado Alley
We created a project that would allow us to predict the number of deaths based on the year, event type, month, and state. We assessed the linear model to see if it would allow us to predict deaths.