Devpost
Participate in our public hackathons
Devpost for Teams
Access your company's private hackathons
Grow your developer ecosystem and promote your platform
Drive innovation, collaboration, and retention within your organization
By use case
Blog
Insights into hackathon planning and participation
Customer stories
Inspiration from peers and other industry leaders
Planning guides
Best practices for planning online and in-person hackathons
Webinars & events
Upcoming events and on-demand recordings
Help desk
Common questions and support documentation
Sort by:
Visualizing medical data to analyze the seriousness of the drug, analyzing number of cases, drug effects, visualizing using geo, mapping, bargraph improve decision-making and understand impact of it.
Using a synthetic gauss and feed forward neural network, we generate data to mimic a given dataset. Our approach follows trends and accurately extends datasets.
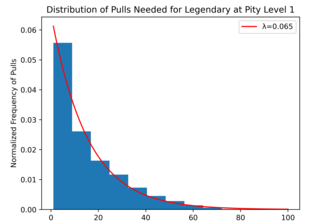
We use a mixture model to describe how loot box rewards depend on a player's "pity score," a metric which measures the number of consecutive attempts since a player last obtained a legendary item.
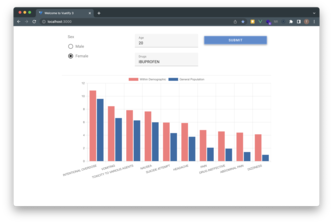
Visualize your personalized drug risk with our software. Based on your demographic data, see how your individual factors may impact side effects. Empower your health decisions!
Helping MMA fans bet confidently using AI to determine the likelihood of the outcome; while formulating a more compelling approach to MMA rankings that disregard the hype and rewards objectively.
Data Analysis and Visualization of Video Games Sales
AxisCare is an interactive dashboard presenting the investigative analysis of the gaps in access to health-care in the United States, taking the case of Covid-19 as a basis of exploration.
The 'Cultivating Coders with Data' project aims to leverage insights generated from the dataset. It provides the opportunity for audiences of all relevant industries to drill down in detail.
Prediction of weather of seattle using logistic regression
InfoGroc is an cross-platform innovative app that tracks your grocery spending and compares it to a database. Know exactly where your money is going and make smart financial decisions with InfoGroc.
Analysis of weather
Algorithm visualization illustrates how algorithms work in a graphical way. It mainly aims to simplify and deepen the understanding of algorithms operation.
To enhance the privacy of the yellow cabs dataset, we identify critical attributes. Then, we employ Laplacian noising for continuous attributes and an ML classifier to mask categorical attributes.
Twitter sentimental analysis
An analysis of Genshin Impact lootbox pity system.
We explore 5 ways of generating data on yellow cabs that differentially-privatizes the original dataset. Methods build upon previous methods until we result in a stable dataset-generating algorithm.
A smart wearable device for elderly that detects falls and reduces response time.
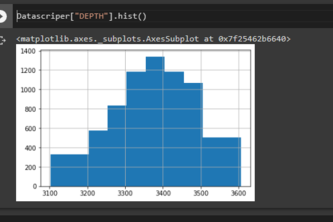
This is Representation of drilling site where there is probability of finding oil.
Animated Bar Chart based on the Titanic 🛳 dataset!
This model takes in text data and predicts the sentiment behind it. The goal is to help businesses and organizations better understand the public sentiment towards their brand, products,and services.
Machine learning web app which takes clinical parameters about a breast cancer patient and tells whether a patient will survive breast cancer or not.
A prediction model to predict air pollution using India for (2015-19)
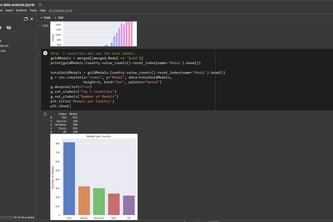
Analysis of the olympics dataset.
Imagine a world where you can detect eye diseases from the comfort of your own home. That's the vision behind Yeuxview. Our app uses machine learning to analyze eye images and detect eye conditions.