-

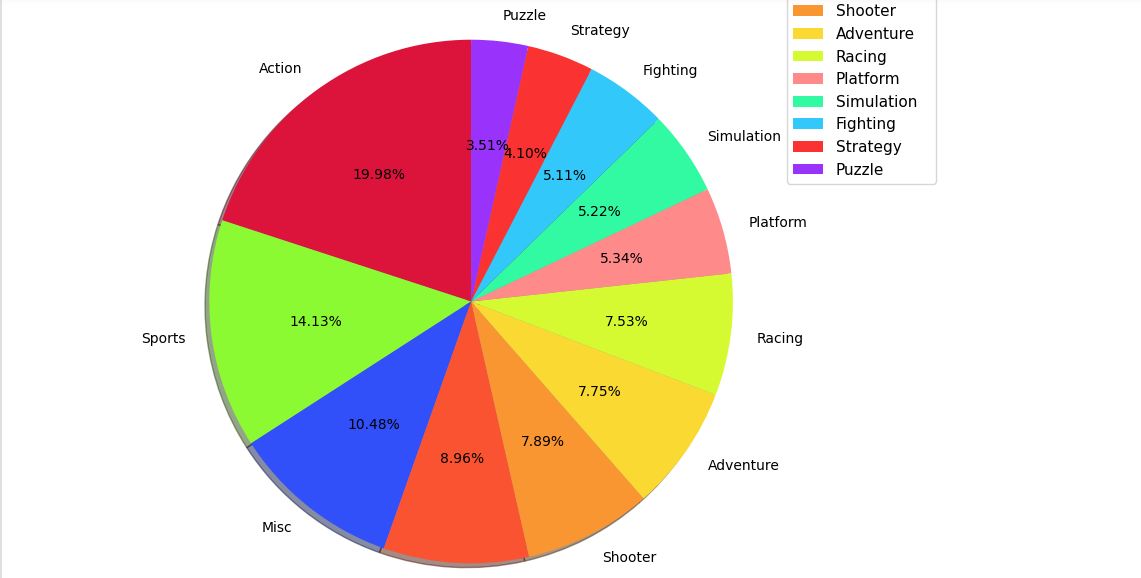
Pie Chart
-

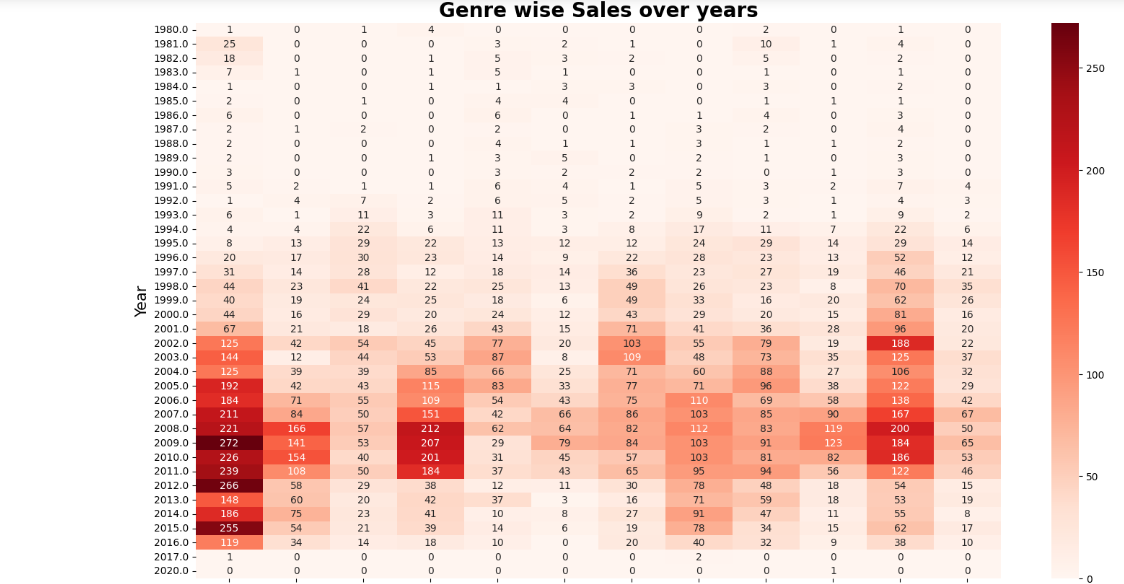
Heat map
-
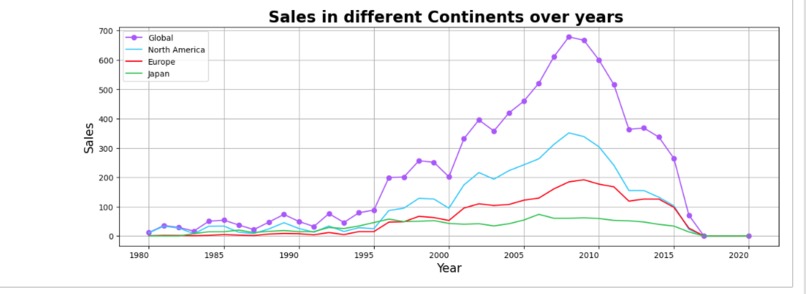
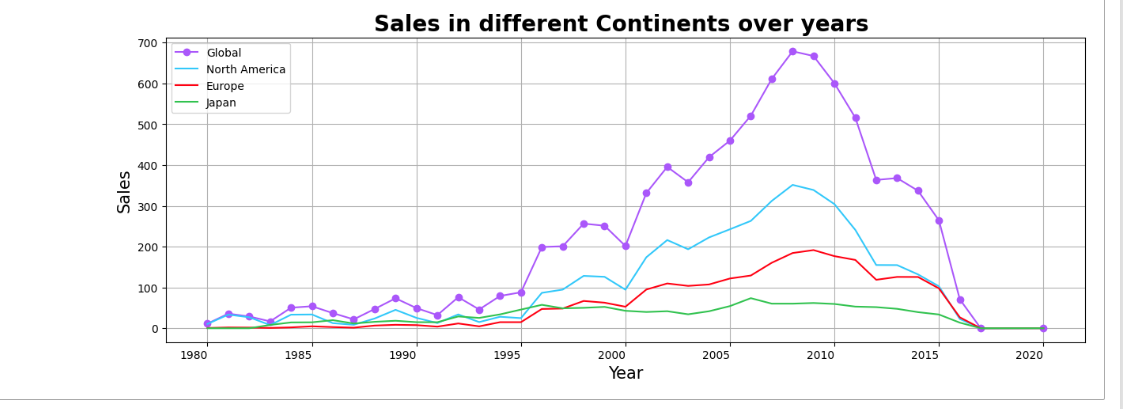
Line graph
Inspiration
GHW amazing challenges are the biggest inspiration.
What it does
Analysis a video games Sales dataset and visualization performed using pie chart, heatmap, bar charts and line plots.
How we built it
Platform used: Jupyter notebook. Languages used: Python and its libraries numpy, pandas, matplotlib and seaborn.
Challenges we ran into
worked with seaborn for the first time.
Accomplishments that we're proud of
Successfully able to draw insights from the dataset.
What we learned
Data cleaning is a very important part in every DAV project.
What's next for Video-Games-Sales
More queries and better visualizations.


Log in or sign up for Devpost to join the conversation.