Devpost
Participate in our public hackathons
Devpost for Teams
Access your company's private hackathons
Grow your developer ecosystem and promote your platform
Drive innovation, collaboration, and retention within your organization
By use case
Blog
Insights into hackathon planning and participation
Customer stories
Inspiration from peers and other industry leaders
Planning guides
Best practices for planning online and in-person hackathons
Webinars & events
Upcoming events and on-demand recordings
Help desk
Common questions and support documentation
Sort by:
Making friendships happn
Through creating this website, we aim to provide a 'one-stop shop' for all Covid-19 related information. We want our customers to have the tools to make informed decisions during this pandemic!
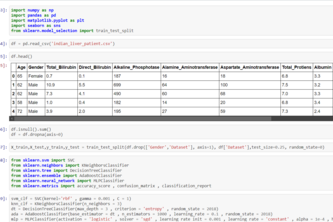
To predict liver disease
Project that uses Data set
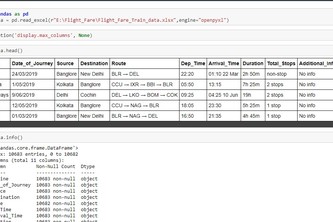
Preprocessing of Flight DataSet Shared on Kaggle
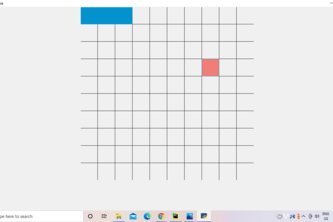
It is a one button game
Harry potter invisible cloak in real life
uses advanced machine algorithms to predictively generate a scene based on two images
Need to attend a meeting but do not have a whiteboard, let's draw it out using our fingers and webcam.
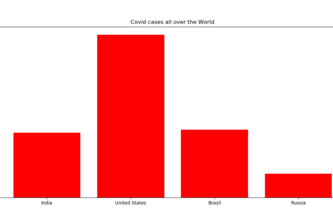
It gives the visualization of given data
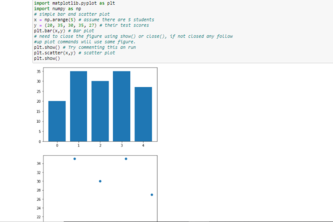
I will be using python and python libraries such as NumPy to and matplotlib to create a graph of some data from an online source such as Kaggle.
#datavisualization
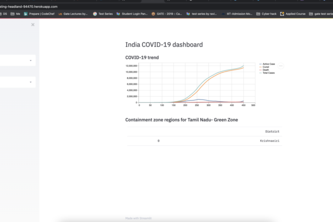
It is mainly used to visualize the active, cured, death cases of covid-19 of historic and daily data. Also used to check for containment zones in India.
this is a data visualization challenge for MLH : LHD share day 3
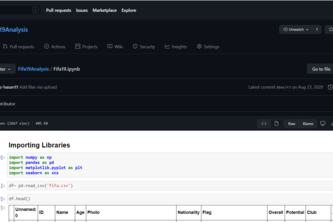
It visualizes FIFA dataset
Visualize Data
Data visualization of house price dataset
Household Power
Data is fun
just what it is.
A music visualizer made in Python
Analysis the biggest cricket league in the world- IPL!
IPL Network
Most Technologies used for a single demo video of my music visualizer script written in python!