-
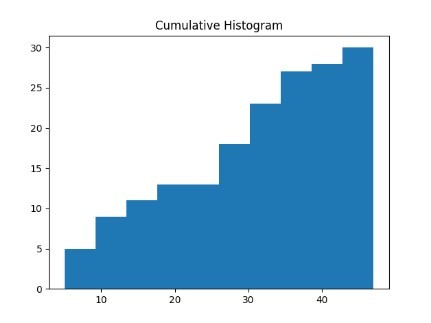
hist3
-
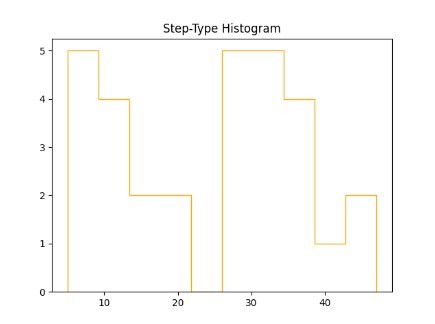
hist2
-
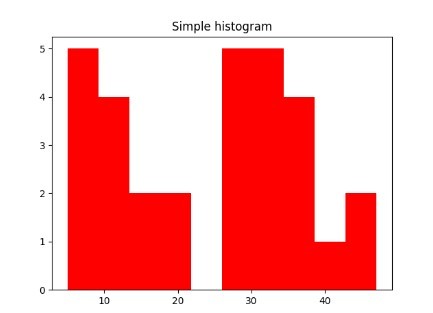
hist1
-
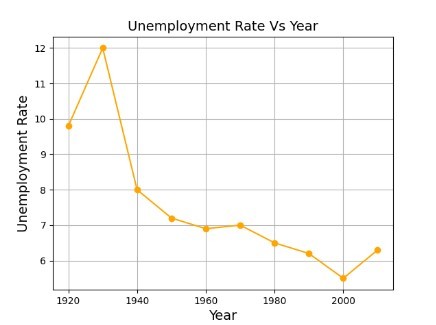
line chart
-
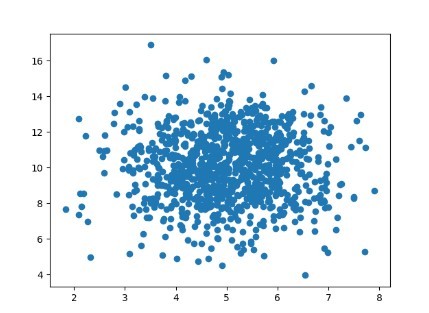
scatter


Inspiration
Seeing a stack of data is boring, visualization is way of making data colourful. It helps you undertsand the data properly.
What it does
It visualizes a dataframe and a randomly generated number
How we built it
I worked in Python in which I used pandas for making dataframe and numpy to get random numbers. I used matplotlib library for doing data visualization.

Log in or sign up for Devpost to join the conversation.