-
-
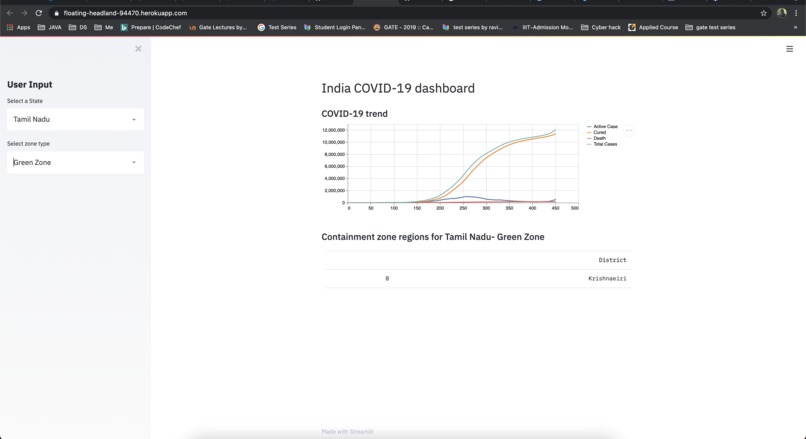
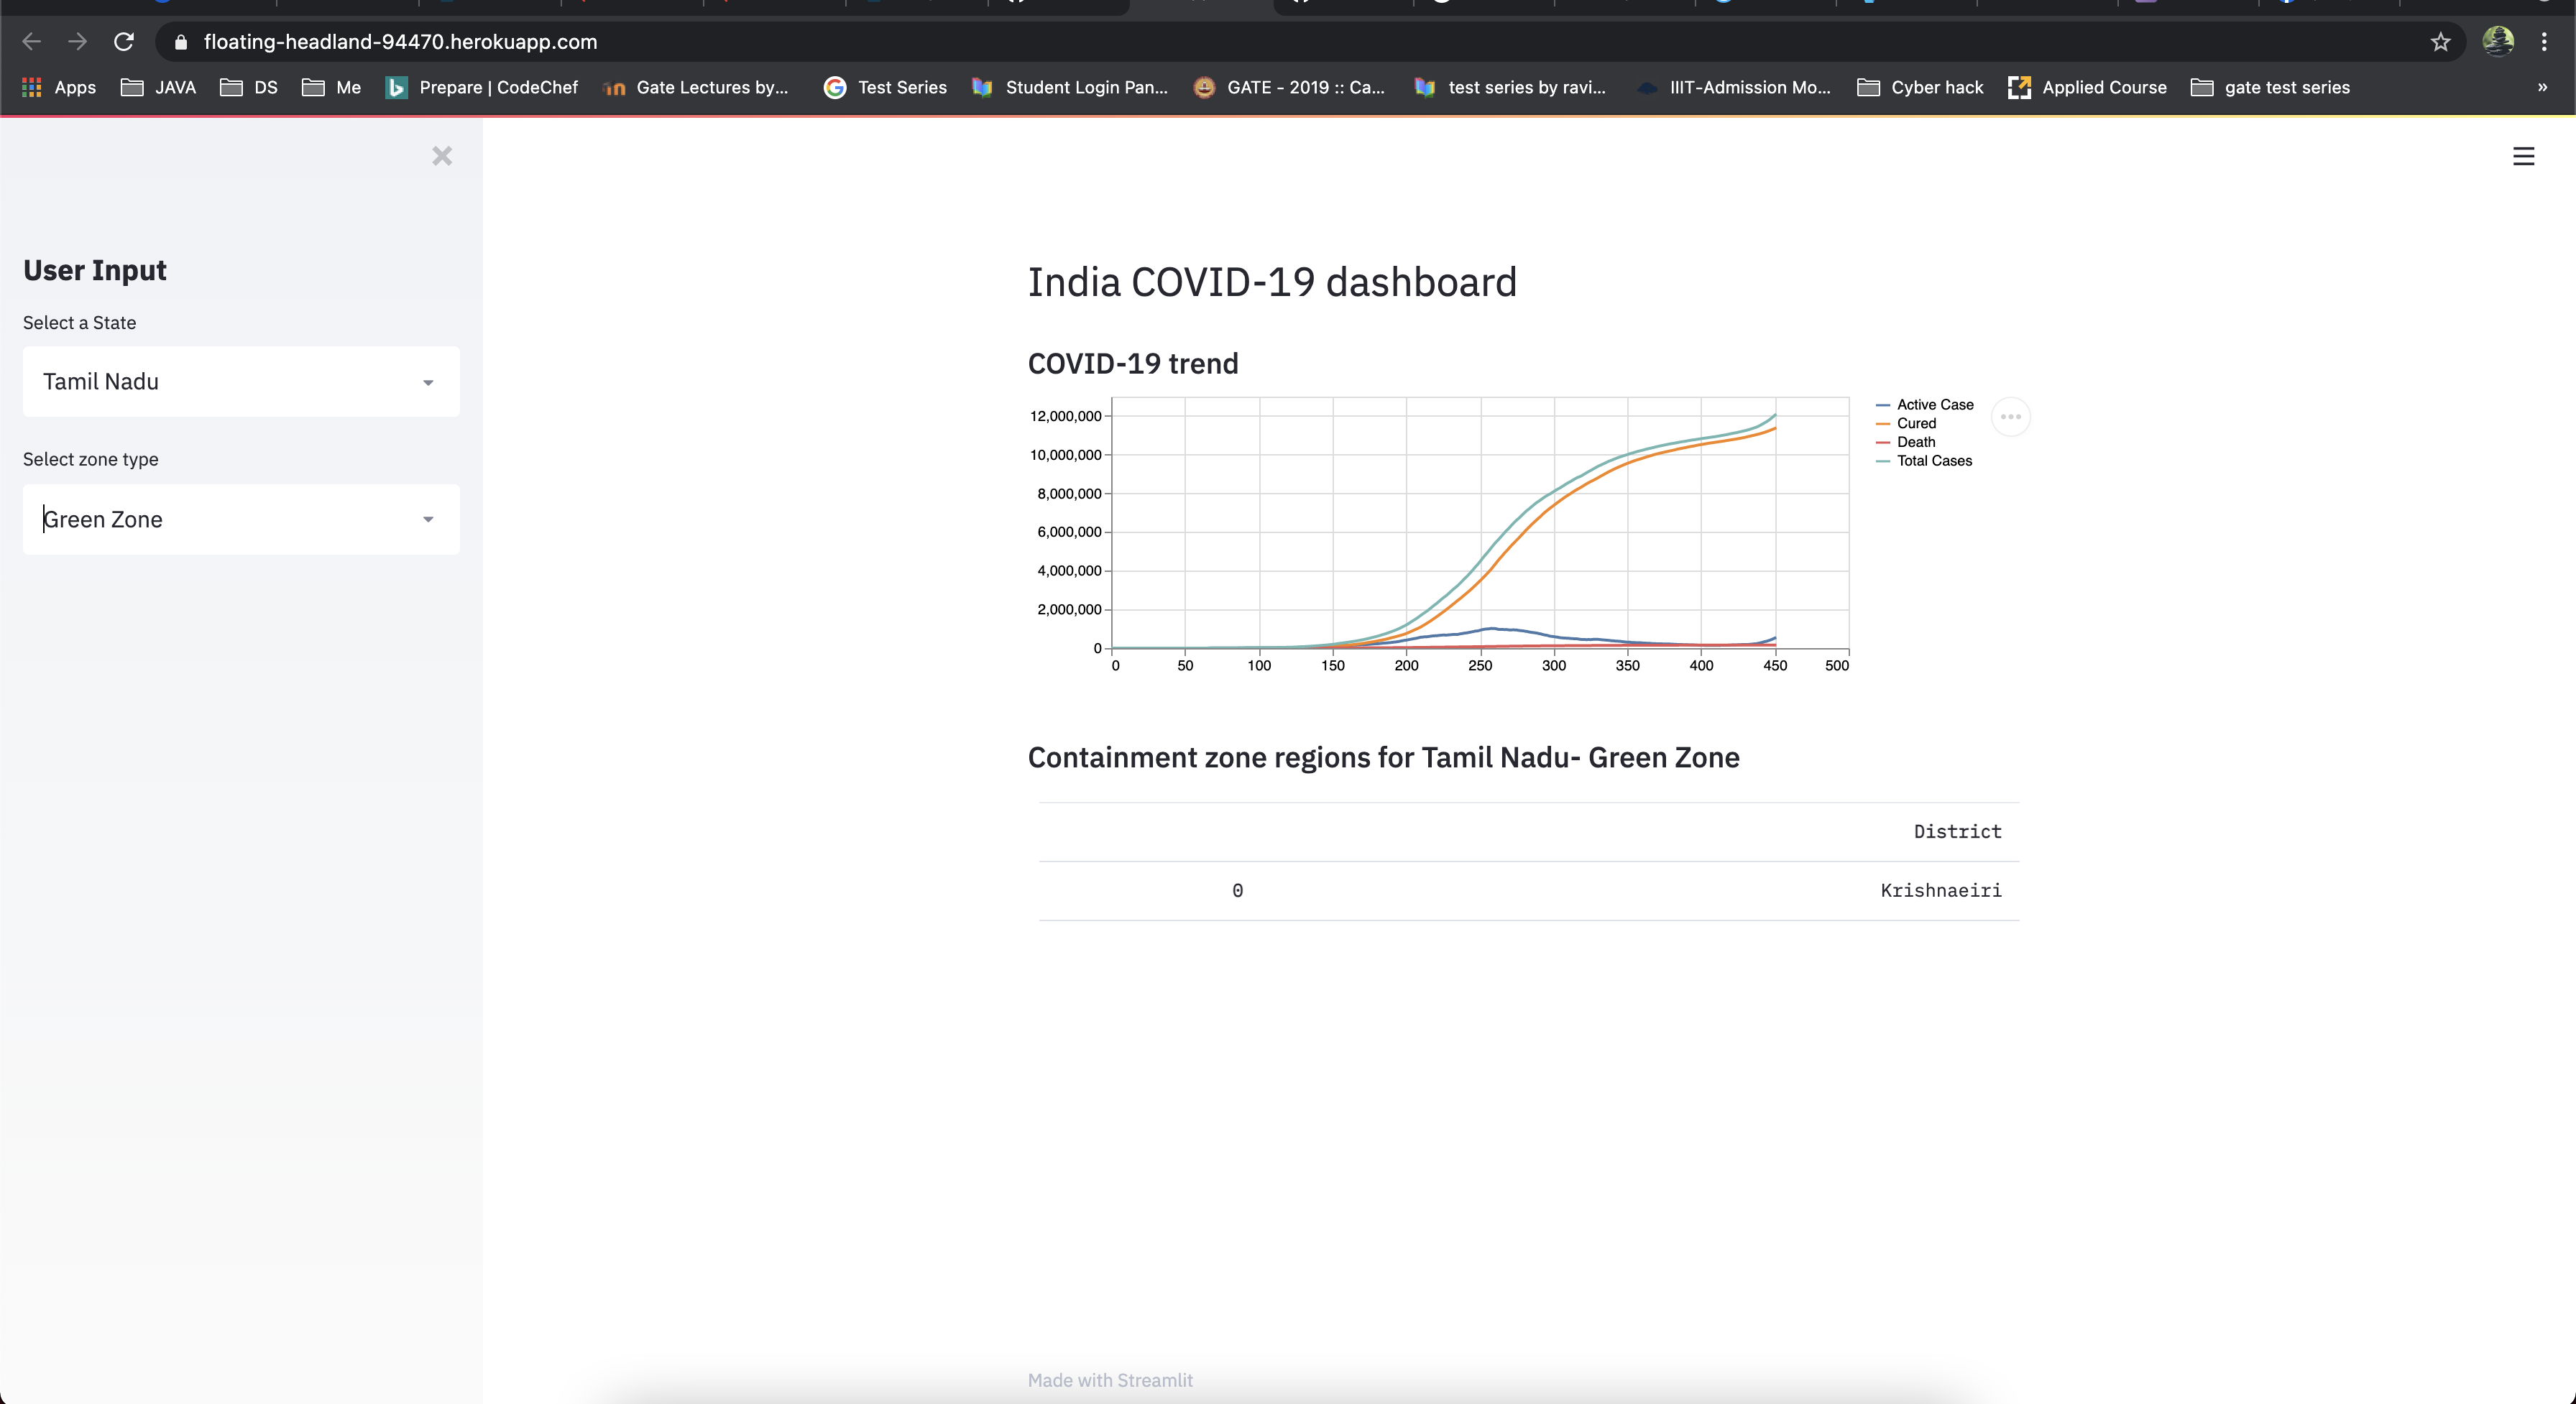
India COVID-19 dashboard
Inspiration
It is developed with the motive to have centralized dashboard for India COVID cases.
What it does
It projects the total number of
- Active
- Cured
- Death
data of COIVD-19 case.It also shows the rate of fluctuation in first wave and second wave of covid cases impact in India.
How we built it
- First trusted dataset source was identified.
- Then decided to use streamlit as a tool for visualization
Accomplishments that we're proud of
It really provides the centralized dashboard for this usecase and can be used easily to compare the first wave and second wave impact.

Log in or sign up for Devpost to join the conversation.