-
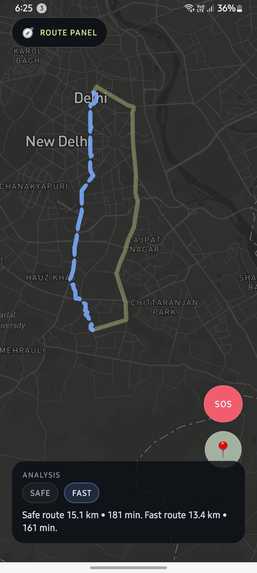
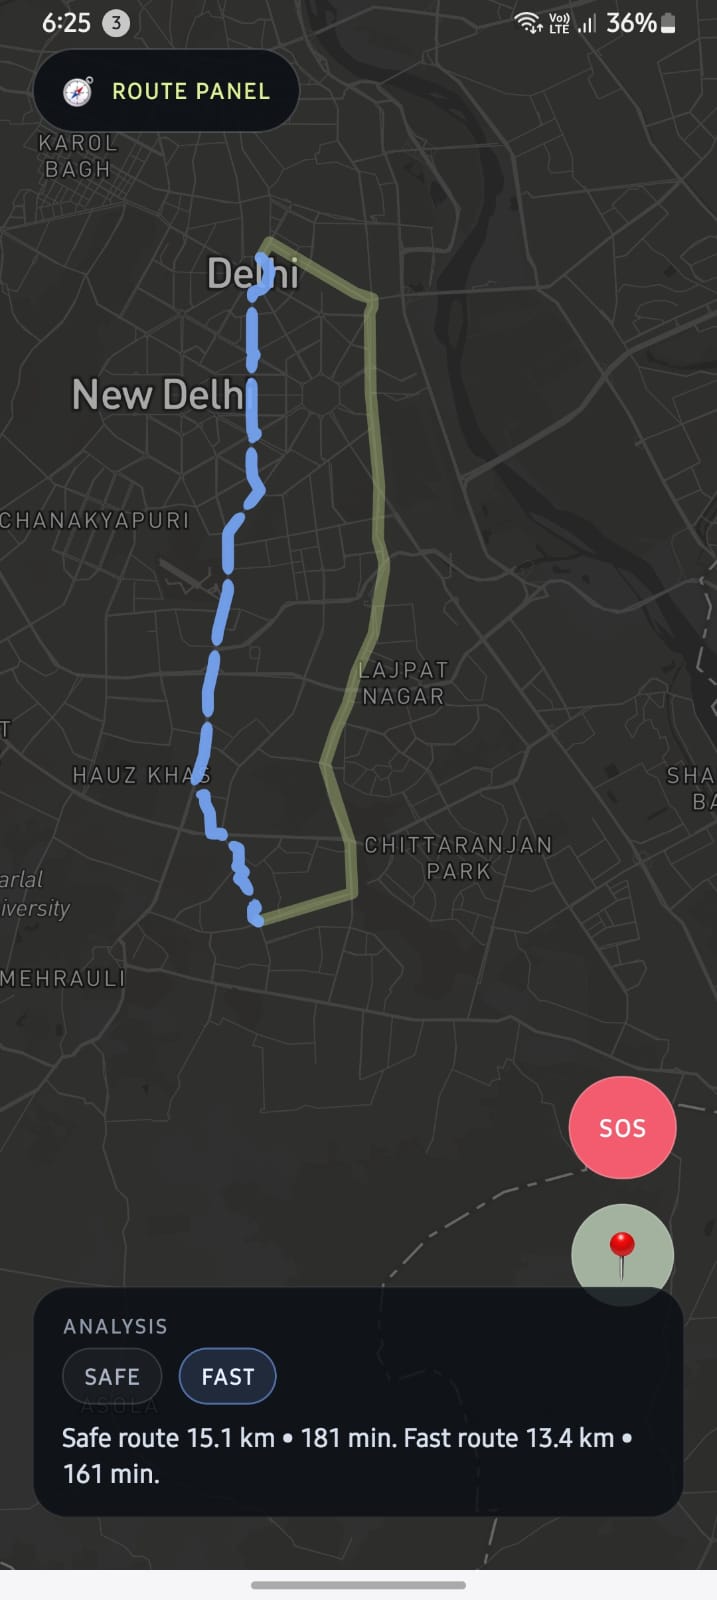
Mobile view with SAFE/FAST toggle and persistent SOS button.
-
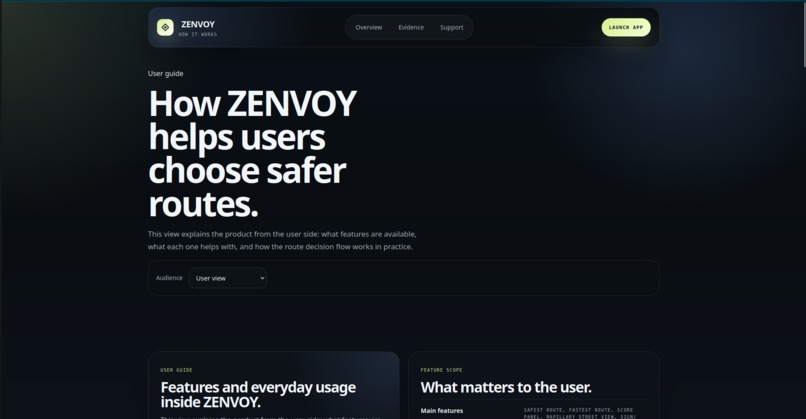
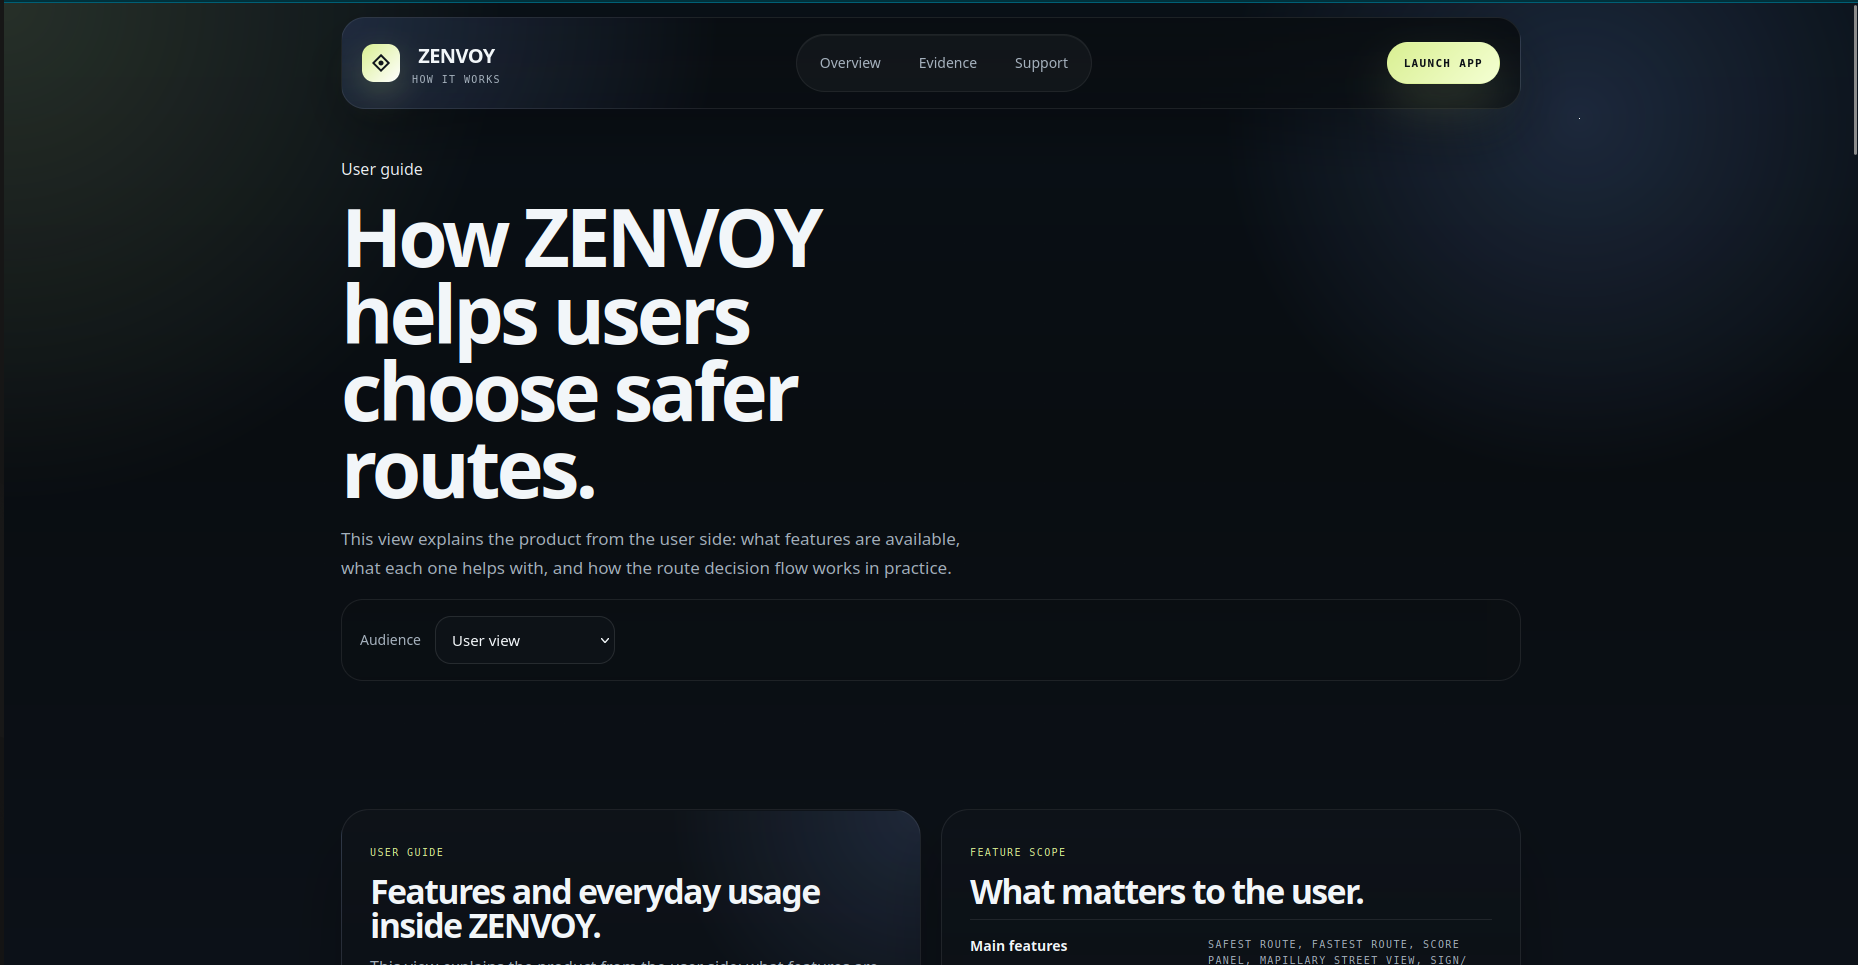
"How It Works" landing page with User and Developer views.
-
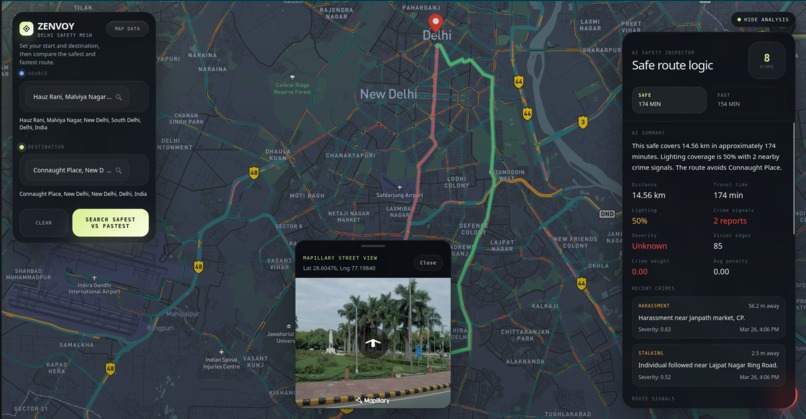
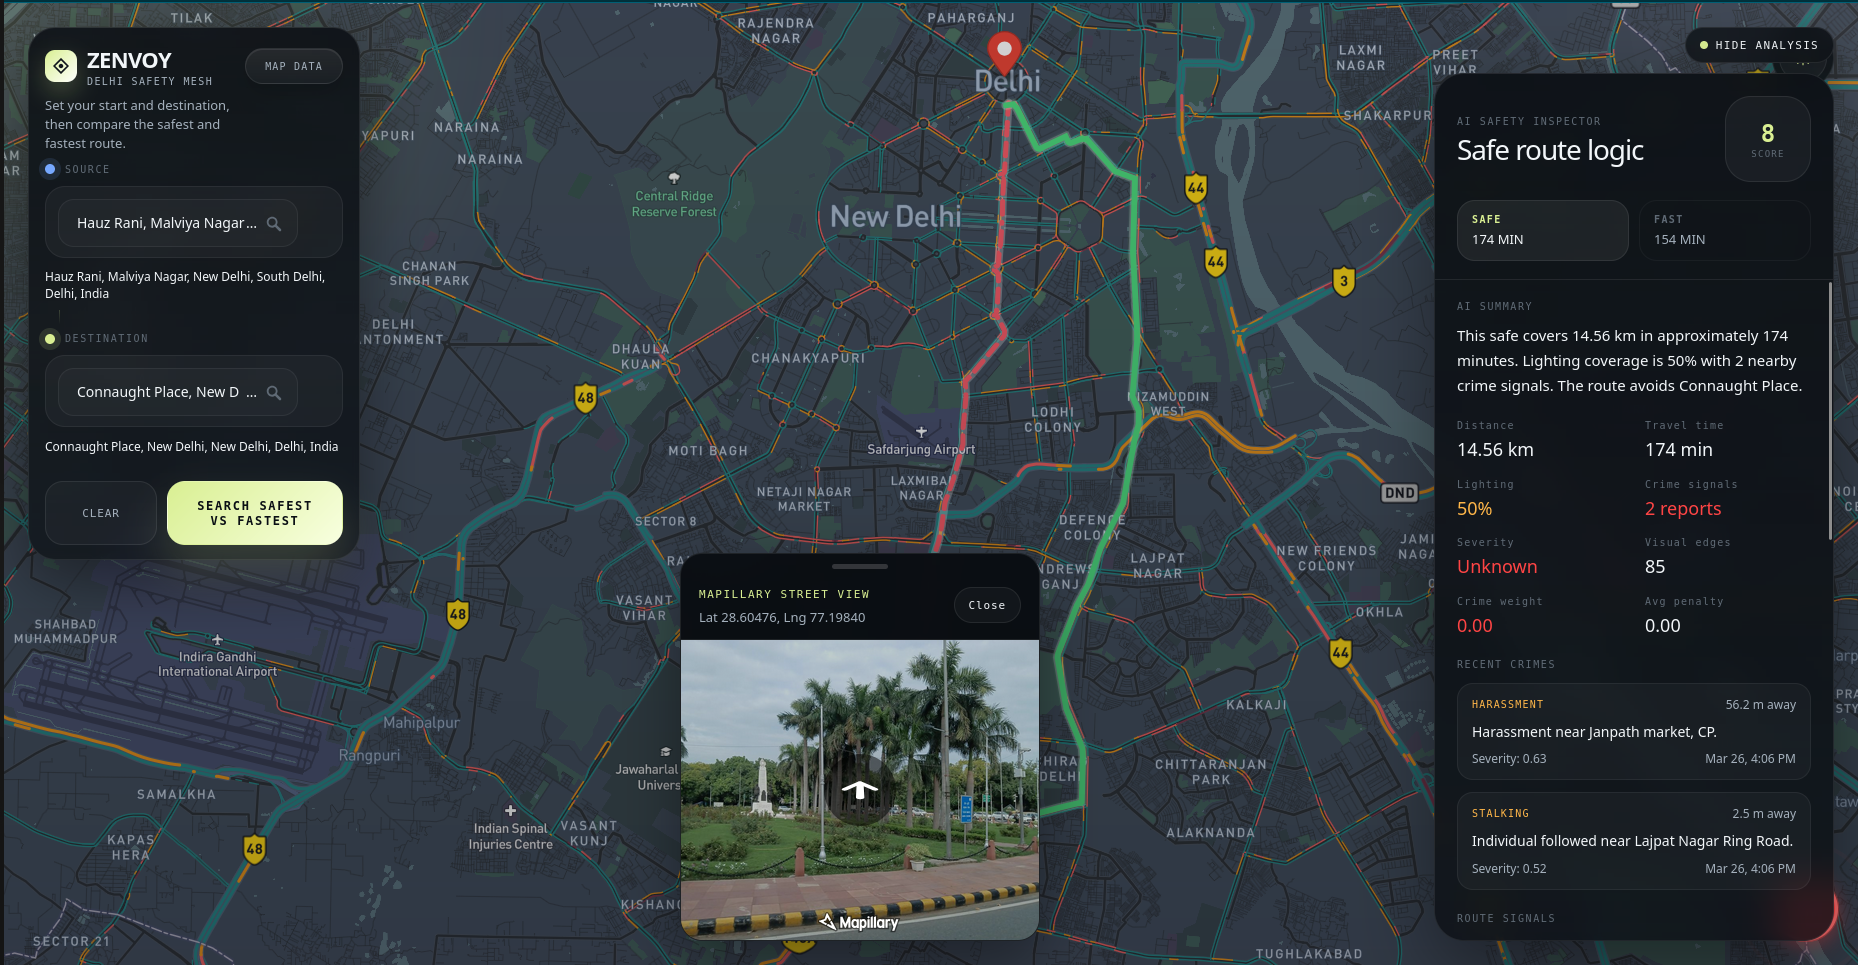
Dark map with Safety Inspector, crime reports, and street-view on click.
-
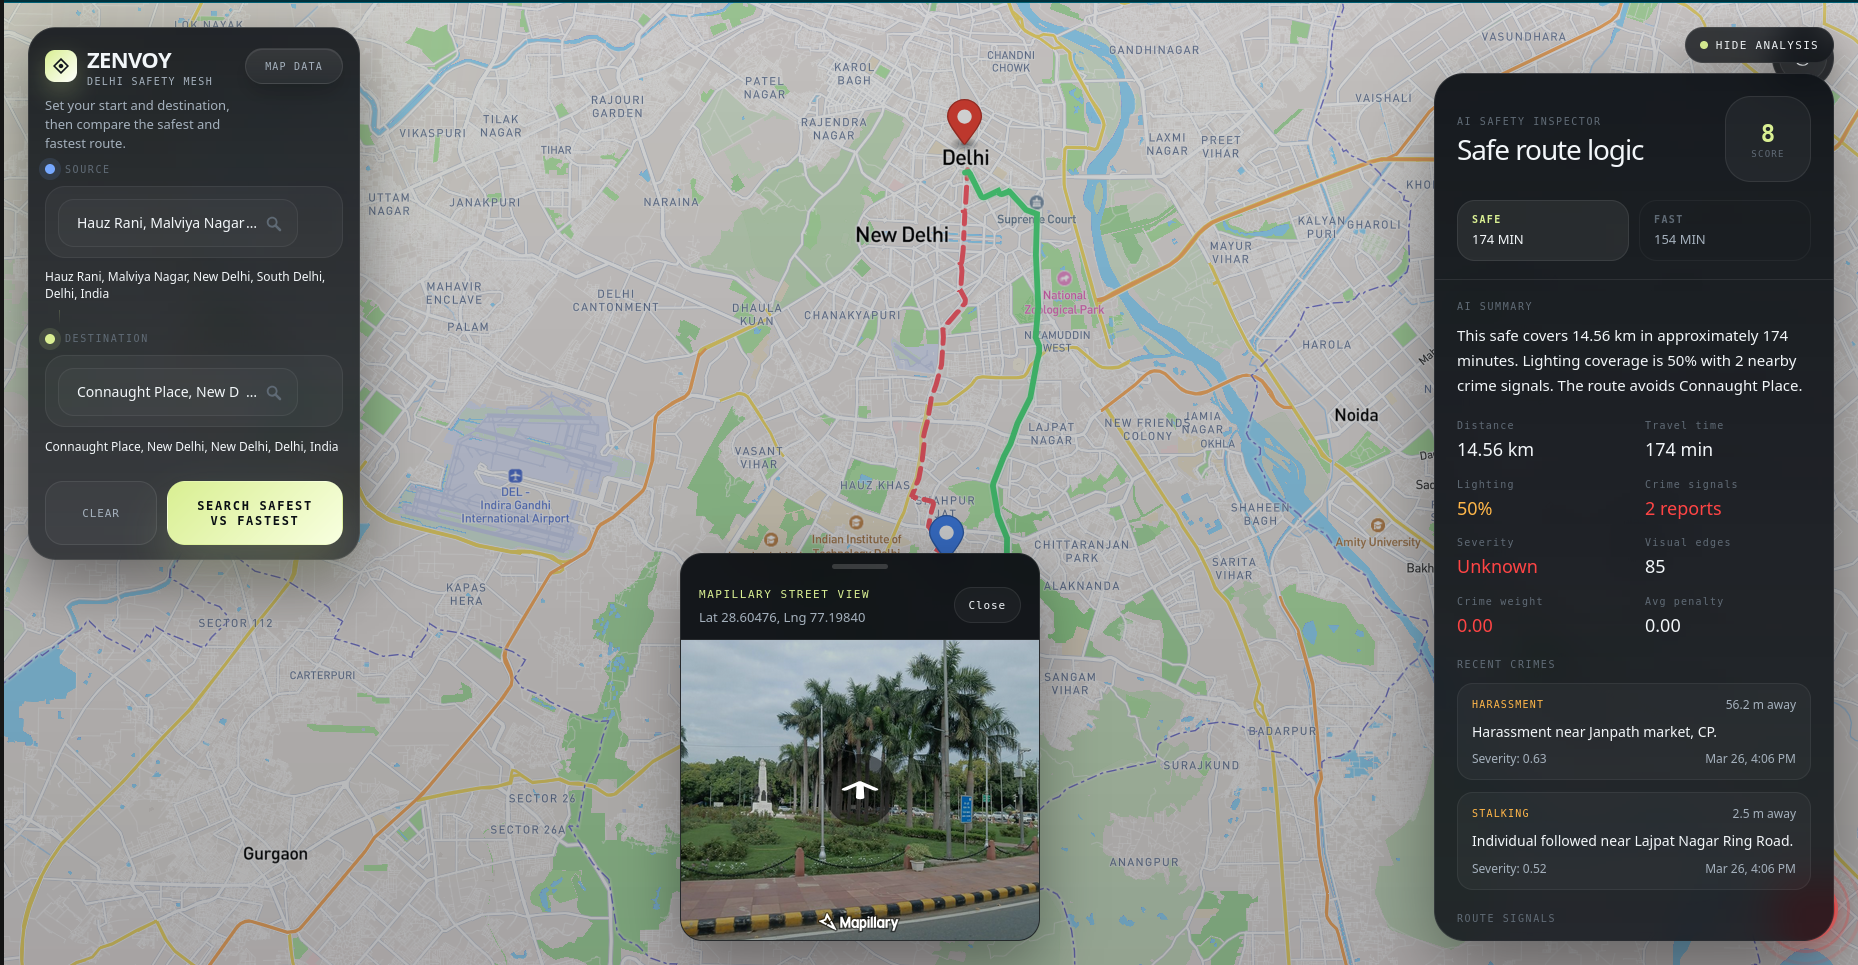
Route comparison with AI Safety Score 8/10, crime signals, and Mapillary street-view.
-
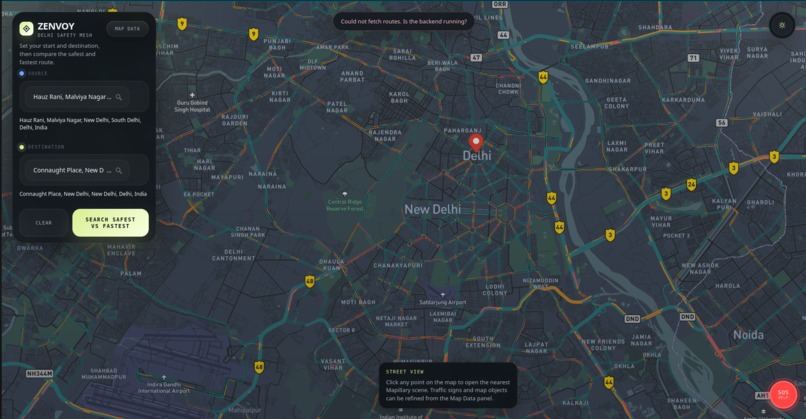
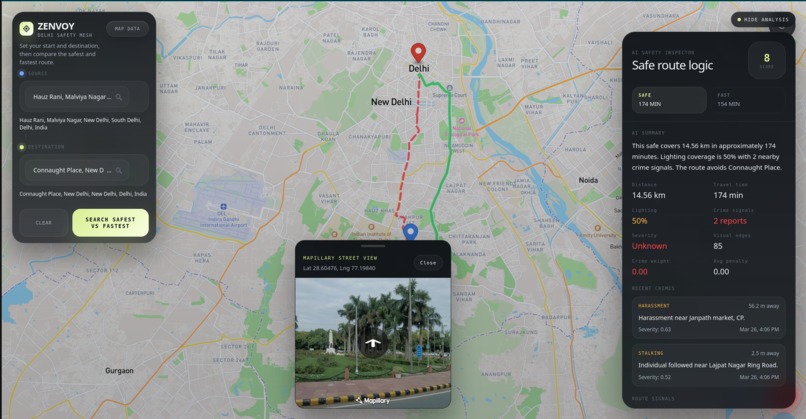
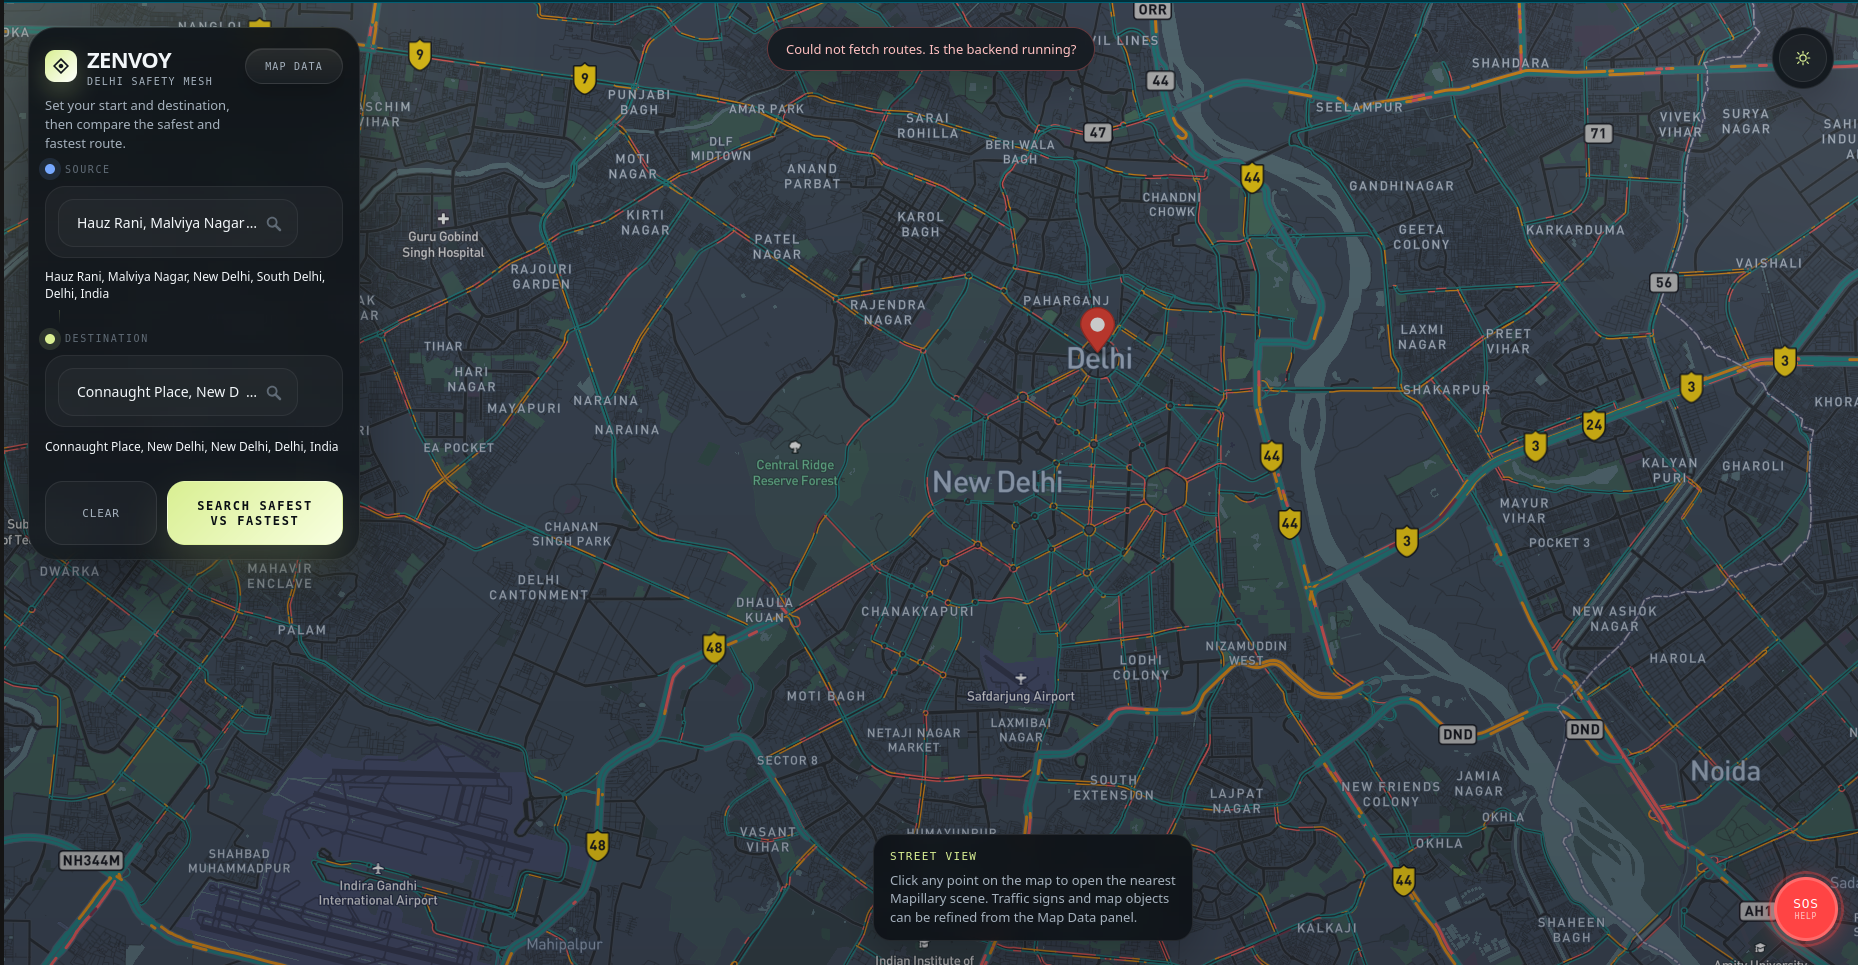
Idle state with Street View tooltip, SOS button, and error handling.
ZENVOY — Safety-First Urban Navigation
Inspiration
It's 10 PM. You're walking home alone. Google Maps shows a shortcut through a dark lane. Do you take it?
Most people hesitate. And that hesitation is the problem Zenvoy was built to solve.
Modern navigation apps are optimized entirely for speed. They don't ask:
- Is this road well-lit?
- Have crimes been reported nearby?
- Does this shortcut cut through a known risk zone?
We are students from Delhi — a city where the gap between the fastest route and the safest route can matter enormously. We built Zenvoy to make route decisions evidence-based instead of instinct-based. Not just for Delhi, but for every city where safety is a real consideration before stepping outside.
The core question we wanted to answer was simple:
Can we make navigation feel defensible — not just shorter?
What it does
Zenvoy is a safety-first navigation web app that compares the fastest and safest routes side-by-side on the same live map — and then explains the tradeoff using real signals.
Core Features
🛣️ Dual Route Comparison Both routes render simultaneously — a green solid line (safe) and a red dashed line (fast) — so users can see the tradeoff at a glance before committing.
📊 Safety Score (0–10) Every route receives an explainable safety score built from three real signal sources: nearby crime reports, AI-detected lighting conditions, and street-level visual evidence.
🚨 Crime-Aware Routing Crime incidents are spatially mapped to nearby road segments. Each incident contributes risk based on its severity, distance from the route, and its citywide prevalence weight from official Delhi Police data.
💡 AI Lighting Detection We ran YOLOv8 on Mapillary street-level images to detect streetlights and compute a per-edge lighting score. Dark segments increase the routing cost. This preprocessing runs once and caches results — it does not run per user request.
👁️ Street-Level Verification Users can click anywhere on the map to load the nearest Mapillary image of that street. Before committing to a route, you can actually see what it looks like on the ground.
🧠 Explainable Breakdown Panel Instead of a black-box score, Zenvoy shows:
- Lighting coverage percentage
- Crime count and severity
- Key callouts (e.g., "CCTV detected at 3 intersections", "Dark alley flagged by AI vision")
- A decision trace showing exactly how the score was assembled
🆘 SOS Button A one-tap SOS button available throughout the navigation experience. It triggers a real SMS via Twilio with the user's live GPS coordinates sent to a pre-set emergency contact.
How we built it
Frontend
- React + Vite — component architecture with clean state management
- Mapbox GL JS — dark-themed map rendering and polyline visualization
- Mapillary JS — street-level image lookup triggered by map clicks
- Axios — API communication with a USE_MOCK fallback for demo stability
Backend
- FastAPI — async REST API serving
/route/safe,/route/fast, and/sos - NetworkX + OSMnx — Delhi walking graph loaded at startup, Dijkstra pathfinding at request time
- MongoDB Atlas — geospatial crime incident storage with 2dsphere indexing
AI + Data Pipeline
- YOLOv8 (Ultralytics) — offline street image analysis to produce per-edge lighting scores
- Mapillary API v4 — source of street-level images fed into the vision pipeline
- Gemini LLM — extracts structured crime incidents from Delhi news headlines (async pipeline)
- EventRegistry — news aggregation for the crime ingestion feed
- Twilio — real SMS dispatch for the SOS feature
Safety Scoring Engine
The core of Zenvoy is a deterministic, heuristic safety scoring system — not a black box.
For each road segment, we compute:
safety_cost = length × (1 + crime_penalty + darkness_penalty − visual_bonus)
Where:
crime_penalty= nearby incidents weighted by severity × distance decay × merged type priordarkness_penalty=(1 − light_score) × 2.2visual_bonus= positive visual signal from YOLOv8 scene analysis
The safe route is then the shortest path over risk-adjusted edge costs, not just distance.
The route-level score is computed as:
combined_risk = crime_risk × 0.6 + darkness_risk × 0.25 + (1 − visual_safety) × 0.15
overall_score = clamp((1 − combined_risk) × 10, 0, 10)
We also merged two crime data layers — official Delhi Police aggregate counts and our geocoded seed incidents — into a unified type-prior calibration table. This means rare but severe crime types (like stalking) are weighted correctly even when local sample sizes are small.
Challenges we ran into
Defining "safety" as measurable data was the hardest product challenge. It's easy to say a route is "safe." It's much harder to justify that claim with signals a user can actually trust and inspect.
Merging heterogeneous data sources — road geometry, crime reports, lighting metadata, and street imagery — into a single decision pipeline without creating brittle dependencies was a significant engineering challenge.
Frontend-backend schema mismatches caused silent UI failures. Small differences in how score breakdown fields were named broke critical parts of the safety panel. We had to build strict interface contracts and test both sides against the same mock data shape.
Street-view integration added real UX complexity. Map click → image lookup → loading state → render all had to feel fast and trustworthy, not janky.
Designing for trust was a constant UX challenge. The interface had to explain why one route is safer, not just assert it. Every design decision came back to: will a user trust this enough to act on it?
Accomplishments that we're proud of
- Built a working dual-route comparison system with real-time map rendering
- Engineered a multi-signal safety scoring pipeline from scratch — crime + lighting + visual
- Integrated offline AI vision preprocessing (YOLOv8 on Mapillary) into a live navigation product
- Built a real SOS system that sends actual SMS with live GPS via Twilio
- Created an auditable decision trace — judges and users can inspect every component of the score
- Shipped a polished landing page + documentation alongside the working app
- Maintained a USE_MOCK safety net — the app runs fully even if the backend is unavailable
What we learned
- Safety UX requires explanation, not just scores — users don't trust opaque numbers
- Street-level evidence makes recommendations feel real and verifiable
- Even small data inconsistencies break user confidence — trust is fragile at the UI layer
- Navigation products can be designed around confidence, not just speed
- Real-world city data (crime, lighting, street imagery) is messy — robust engineering matters more than clever algorithms
What's next for Zenvoy
- Real-time crime updates — live ingestion from verified sources, not just daily batches
- Crowd density signals — integrate pedestrian activity as a safety proxy
- Segment-level risk highlighting — show which specific stretch of the route is risky, not just a route-level score
- Time-of-day risk prediction — routes that are safe at noon may not be safe at midnight
- Live trip sharing — send your live location to a trusted contact during navigation
- Mobile app — React Native + Expo version with expo-location for native GPS
- Scalable deployment — move from local FastAPI + ngrok to a production-grade cloud setup
Built With
React Vite Mapbox GL JS Mapillary JS FastAPI Python NetworkX OSMnx MongoDB YOLOv8 Ultralytics Twilio Gemini EventRegistry OpenStreetMap Axios Node.js
Built With
- axios
- eventregistry
- fastapi
- gemini
- gl
- javascript
- mapbox
- mapillary
- mongodb
- networkx
- node.js
- openstreetmap
- osmnx
- python
- react
- twilio
- vite
- yolov8


Log in or sign up for Devpost to join the conversation.