-
-
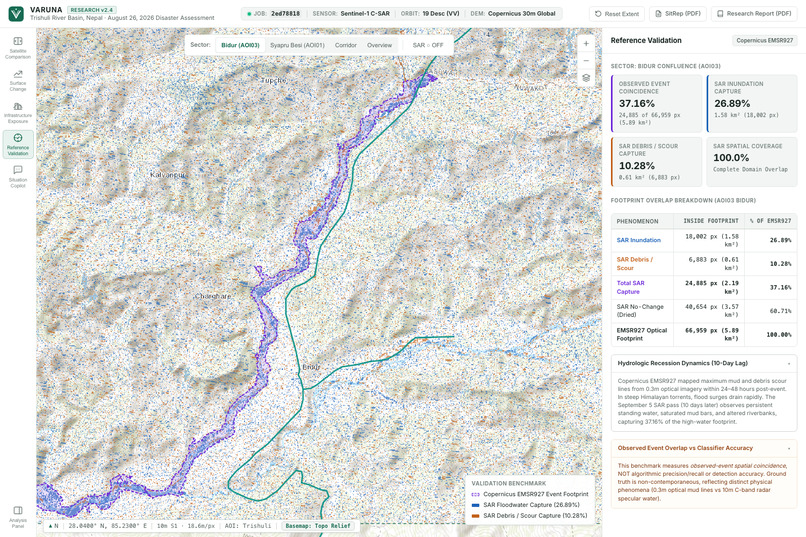
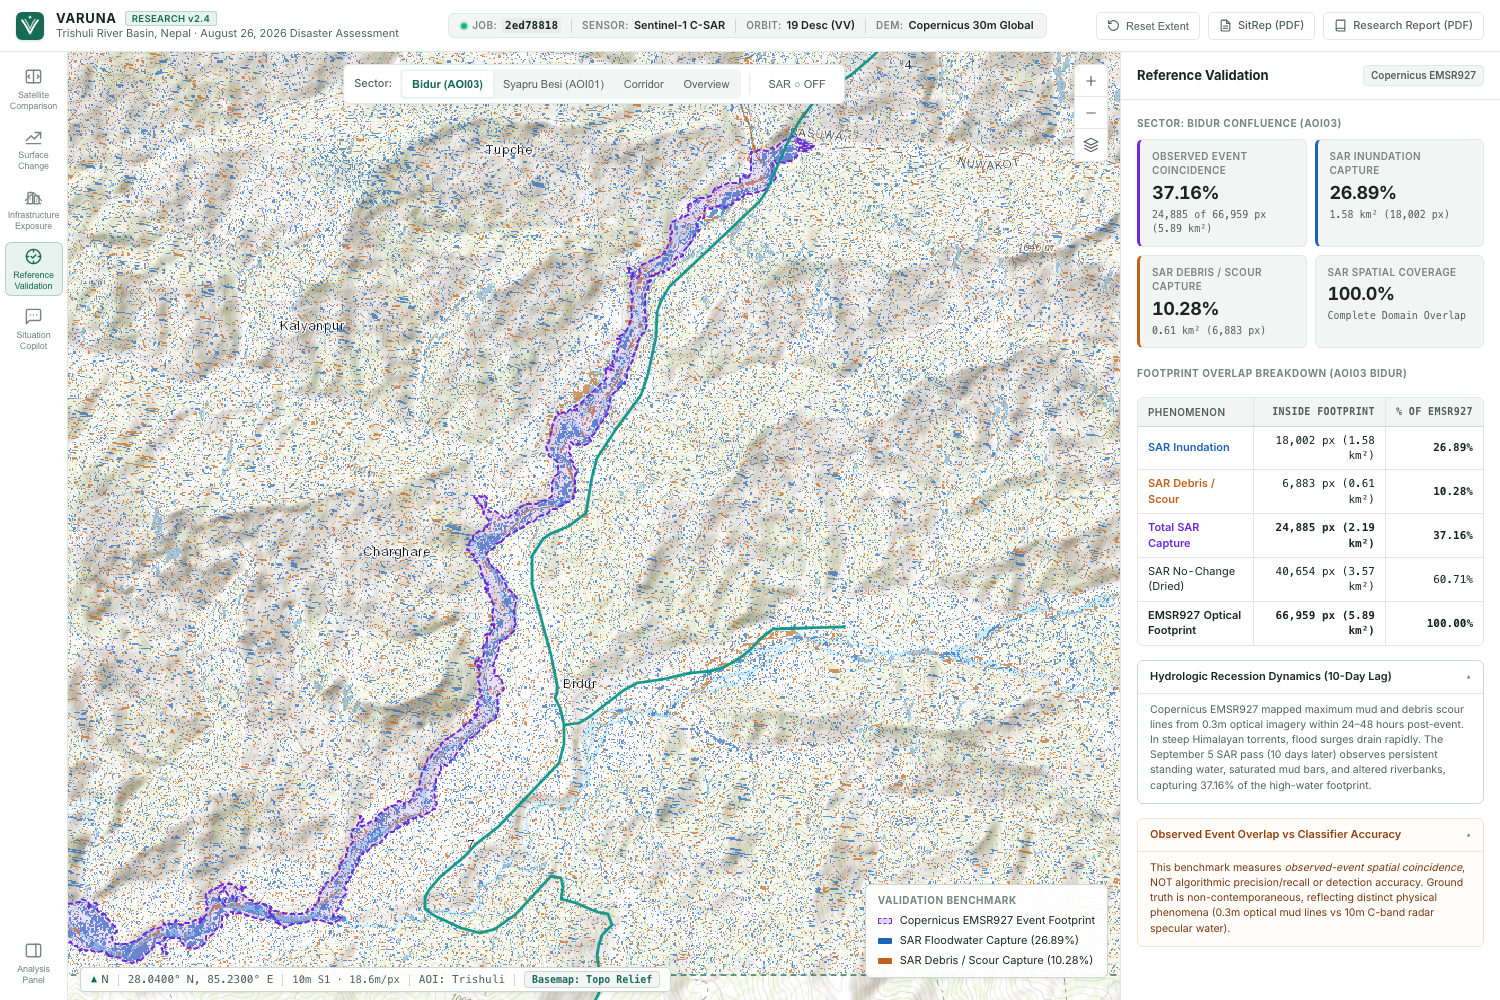
Validation: Comparing findings with independent satellite-based evidence.
-
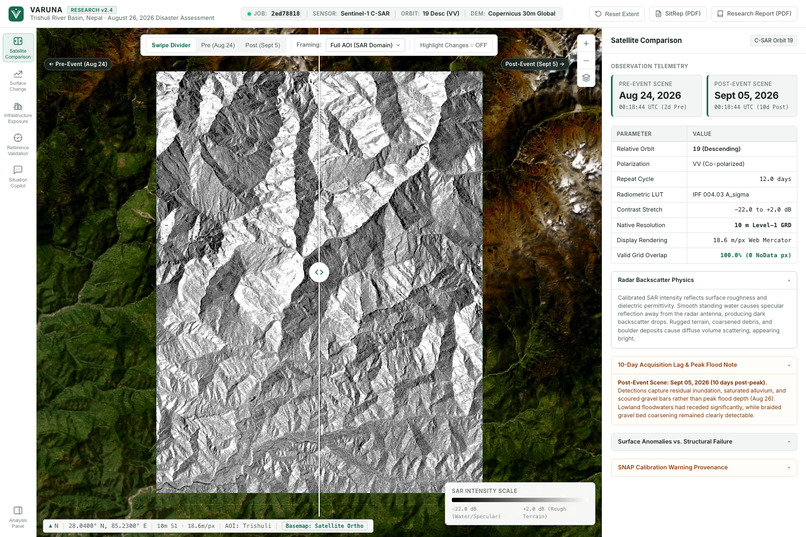
Overview: Satellite-powered flood impact intelligence.
-
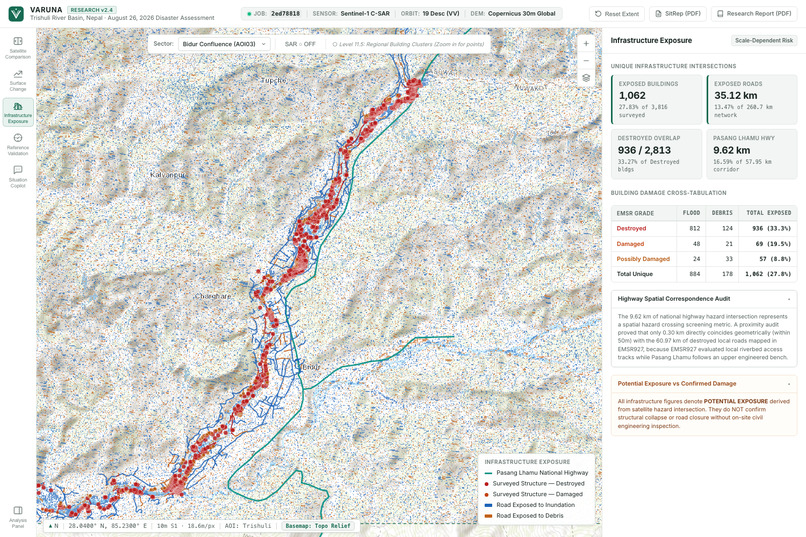
Infrastructure: Mapping buildings and roads potentially at risk.
-
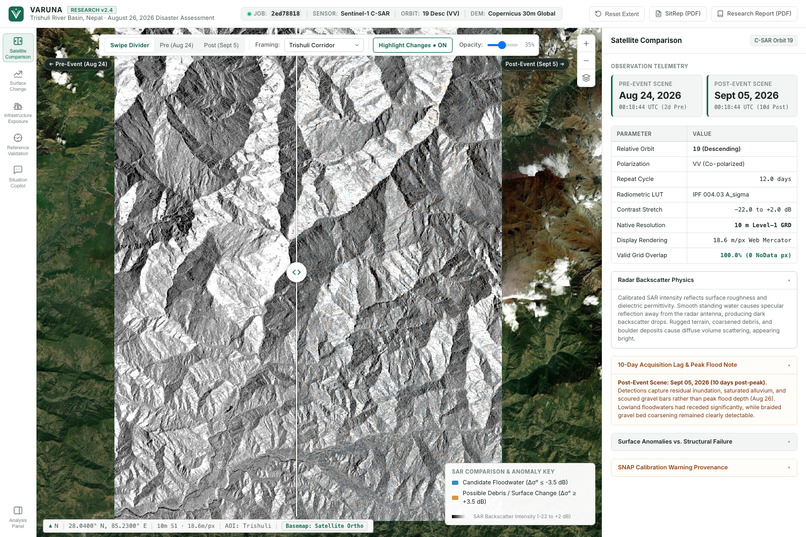
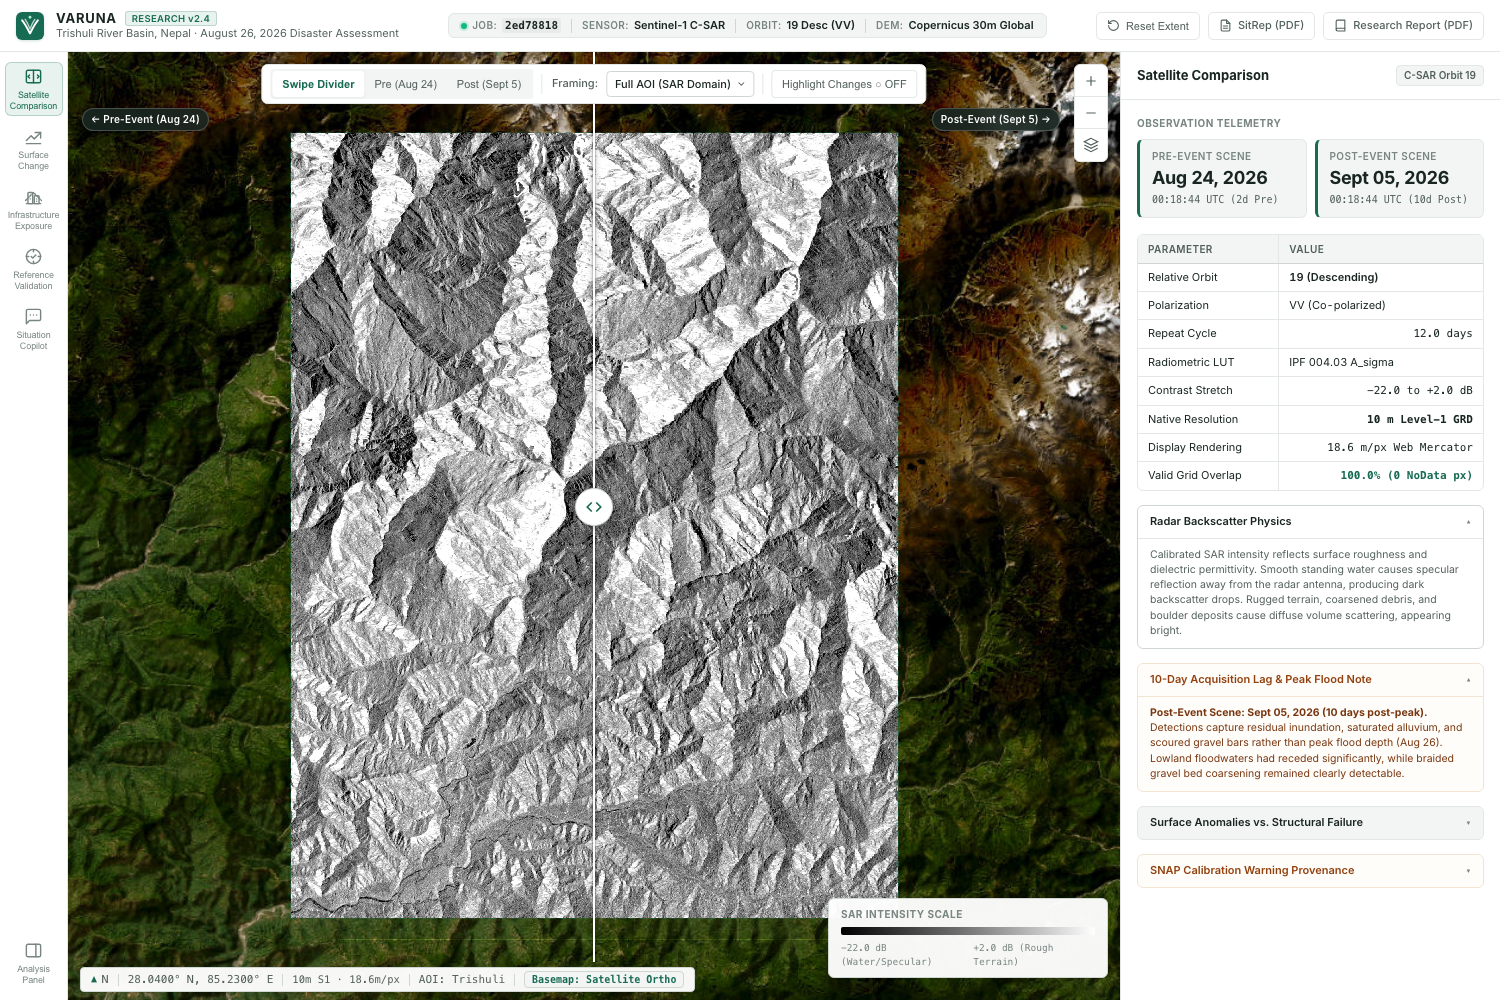
Satellite Comparison: Revealing flood-related changes from space.
-
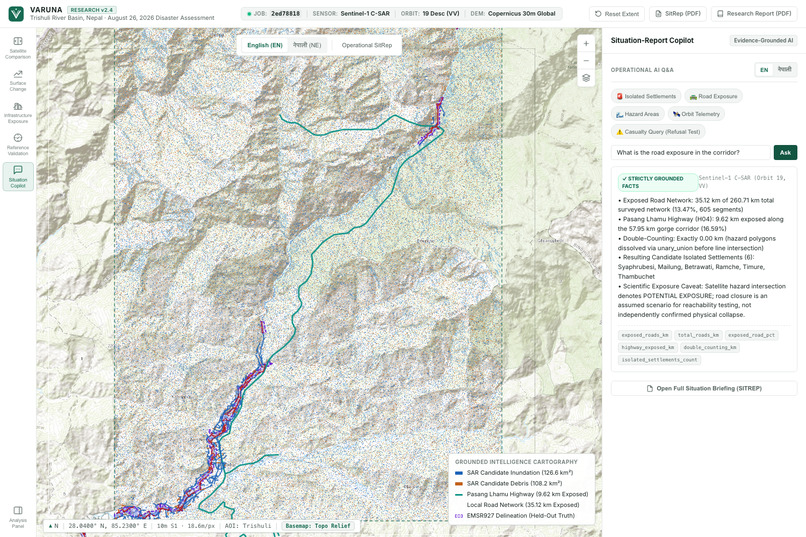
AI Copilot: Turning complex flood data into actionable answers.
-
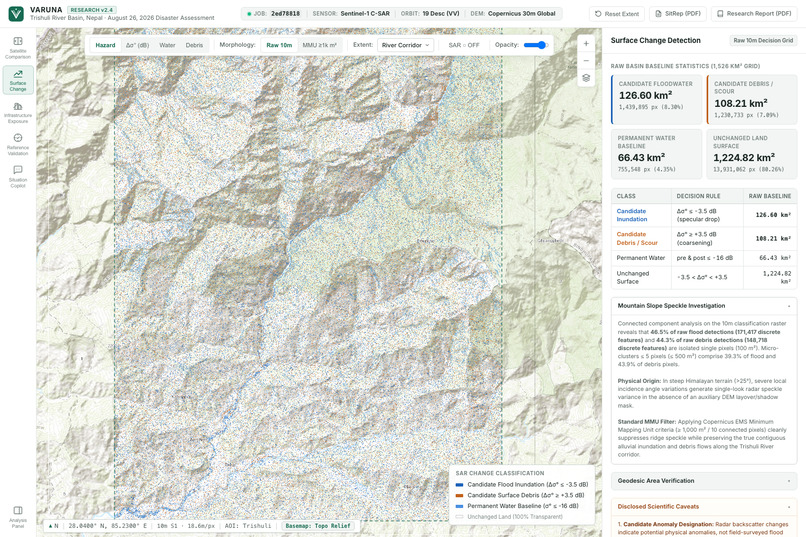
Surface Change: Detecting potential floodwater and debris zones.
VARUNA — Mapping Impact From Space 🌍
Inspiration
When a flood strikes, one of the biggest challenges isn't just the disaster itself. It's understanding what happened afterward.
Which areas are affected? Which roads might be inaccessible? Which communities could be isolated? And how do we find answers when reaching the ground is difficult?
This challenge becomes even greater in mountainous regions, where clouds, damaged infrastructure, and difficult terrain can delay ground assessments.
That led us to a simple question:
What if we could use satellites to understand the impact of a disaster before responders can physically reach the affected areas?
That's how VARUNA began.
Named after the ancient Vedic deity associated with water, VARUNA was built to make satellite observations easier to understand and more useful for disaster response.
Our goal wasn't simply to display satellite images. We wanted to connect what satellites observe with what actually matters to people on the ground.
What it does
VARUNA is a satellite-powered disaster intelligence platform that combines real Sentinel-1 Synthetic Aperture Radar (SAR) imagery, geospatial analysis, infrastructure mapping, and a bilingual AI assistant.
It brings the analysis together through five interconnected workspaces.
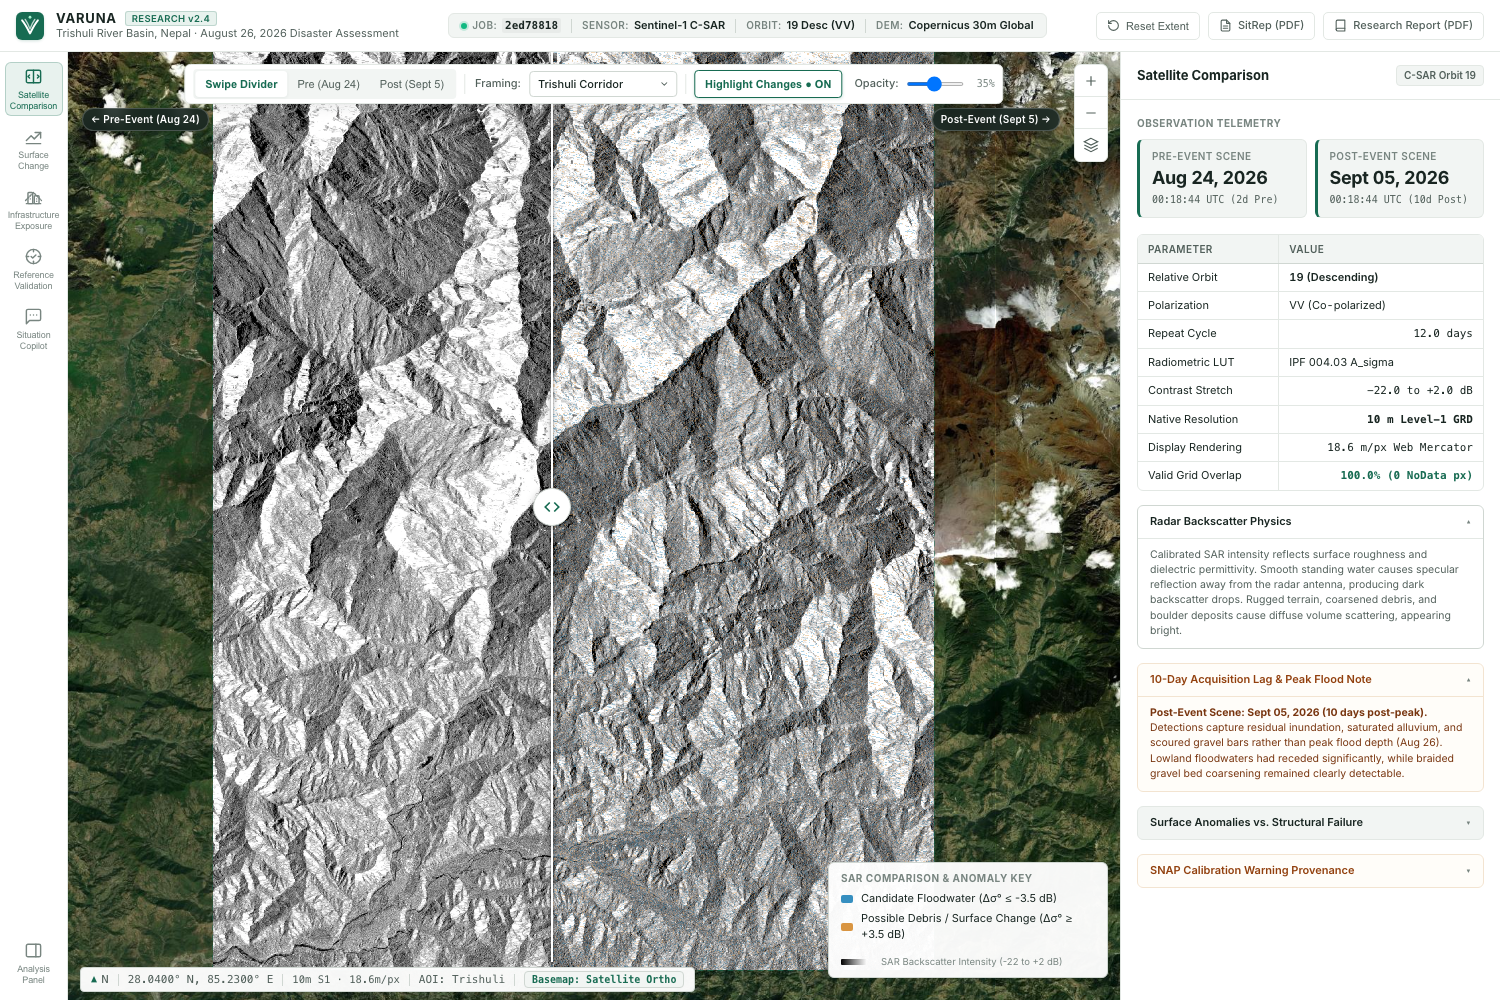
1. Satellite Comparison 🛰️
VARUNA allows users to explore real before-and-after Sentinel-1 radar observations using an interactive comparison slider.
Unlike conventional optical imagery, radar can acquire observations through cloud cover, making it particularly useful during flood events.
The platform highlights significant changes in radar backscatter, helping users identify areas that deserve further investigation.
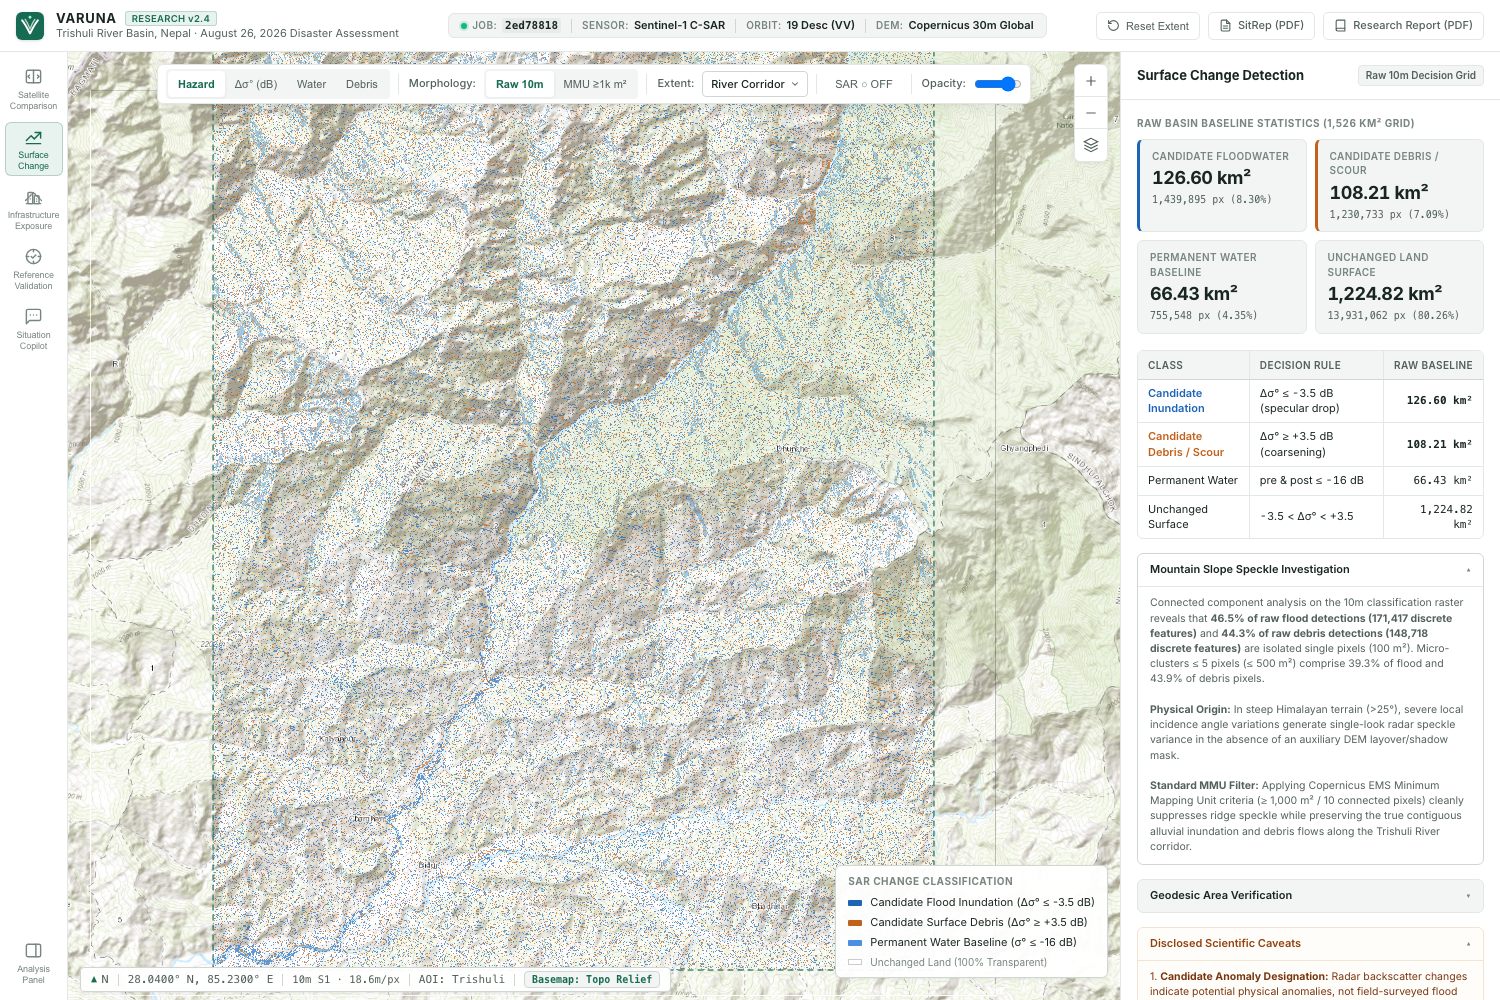
2. Surface Change Detection 🌊
We analyze differences between pre-event and post-event radar observations to identify candidate floodwater and debris-related surface changes.
Blue highlights represent decreases in radar backscatter that may indicate water. Orange highlights represent increases that may indicate debris, roughened surfaces, or other changes.
These are candidate detections, not confirmed flooding or landslide damage.
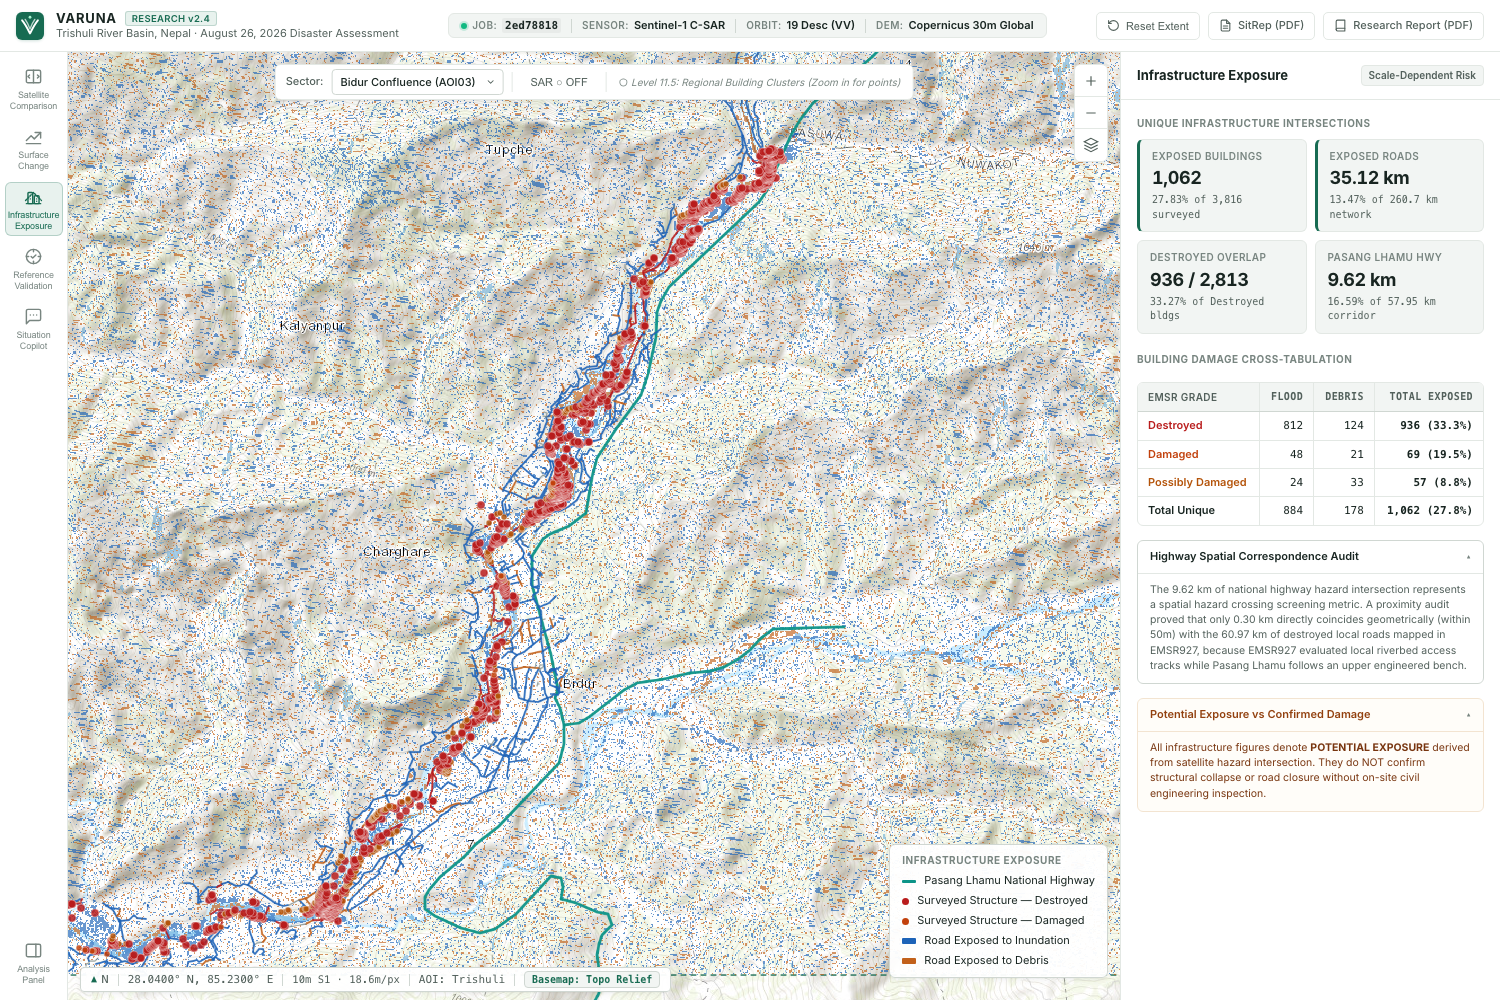
3. Infrastructure Exposure 🏘️
Satellite observations become more useful when we connect them to infrastructure.
VARUNA integrates OpenStreetMap data to identify buildings and road segments intersecting candidate hazard areas.
We also built road-network analysis to explore how hypothetical road closures could affect settlement connectivity and access to important destinations.
*4. Reference Validation *
We compare our results with independent Copernicus Emergency Management Service reference mapping.
Rather than presenting a single percentage as proof of accuracy, VARUNA communicates the geographic and temporal limitations of the comparison.
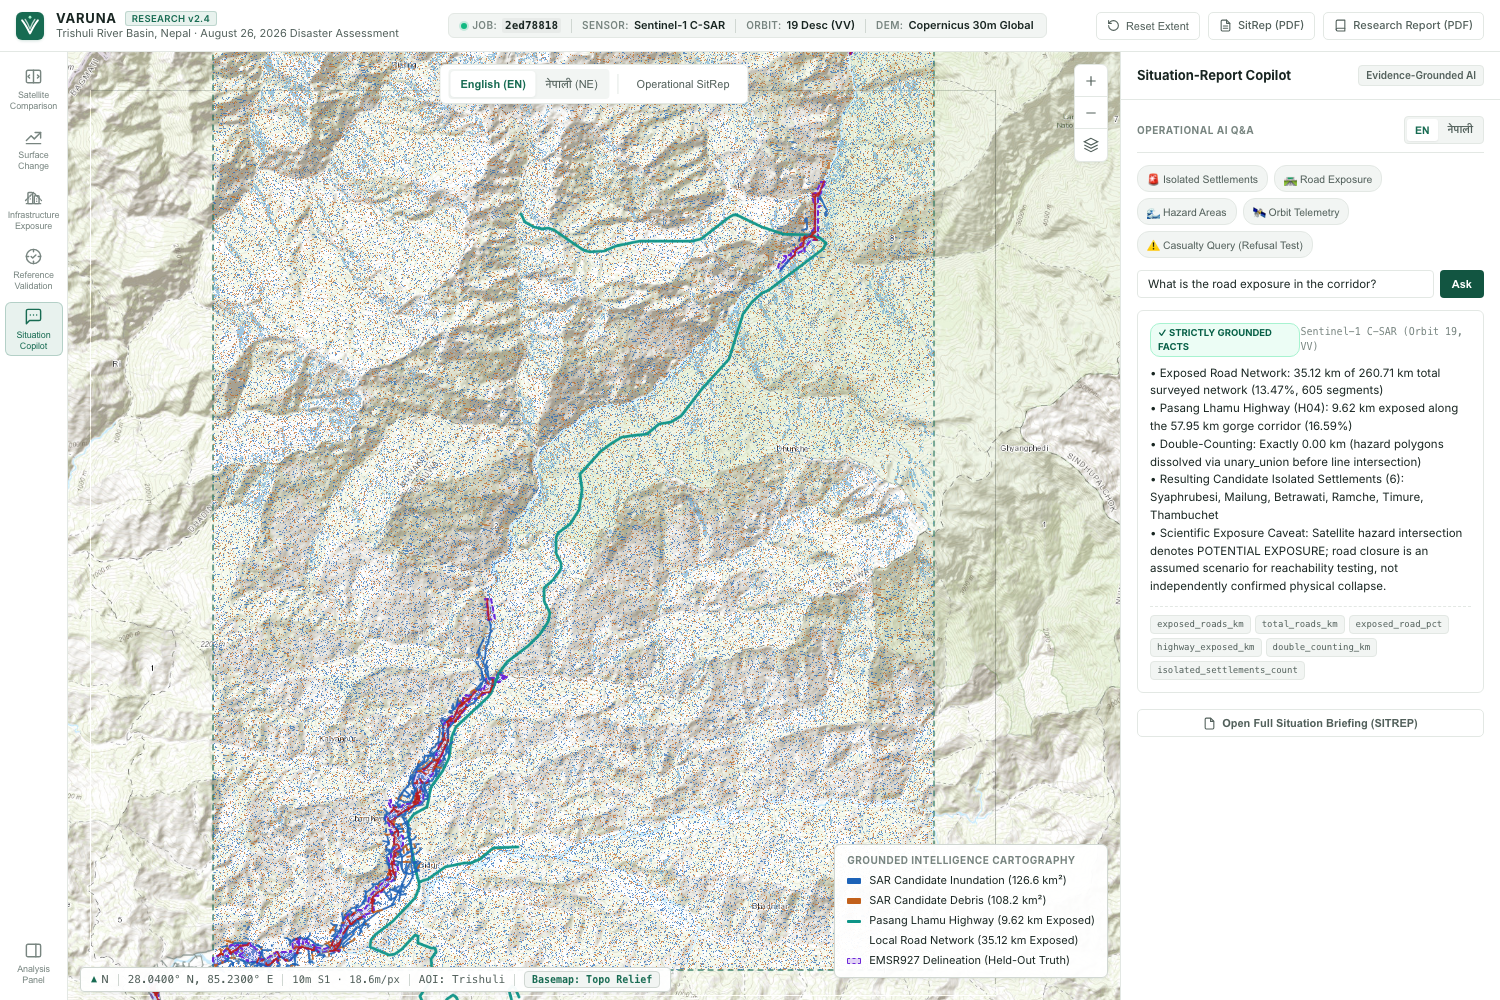
*5. Situation Copilot *
VARUNA includes a bilingual AI assistant that allows users to ask questions about the mapped results in English or Nepali.
The assistant is designed to answer using computed project data, making complex geospatial findings easier to explore.
The platform also produces two downloadable documents: a one-page Situation Report for a quick operational overview and a Research Report describing the methodology, findings, validation, and limitations.
How we built it
We developed VARUNA around a real case study: the August 2026 Trishuli River flood in Nepal.
We used authentic Sentinel-1 SAR observations from August 24, 2026, and September 5, 2026.
Our workflow follows several stages:
- Satellite data acquisition: Obtain real pre-event and post-event Sentinel-1 observations.
- Radar processing: Prepare and compare radar backscatter measurements.
- Change detection: Identify candidate floodwater and debris-related changes using backscatter thresholds.
- Spatial filtering: Reduce small, isolated detections and distinguish raw from filtered results.
- Infrastructure analysis: Overlay candidate hazard areas with OpenStreetMap buildings and roads.
- Connectivity modeling: Evaluate settlement isolation under hypothetical road-closure scenarios.
- Independent comparison: Compare results with Copernicus EMSR927 reference mapping.
- AI and reporting: Present computed findings through an interactive dashboard, bilingual Situation Copilot, and downloadable reports.
We designed the application to make the entire analysis understandable without requiring users to interpret raw radar imagery themselves.
Our results
For the Trishuli River case study, VARUNA produced the following screening results:
| Analysis | Result |
|---|---|
| Raw candidate floodwater | 126.60 km² |
| Filtered candidate floodwater | 62.86 km² |
| Raw candidate debris/scour-related change | 108.21 km² |
| Filtered candidate debris/scour-related change | 46.93 km² |
| Buildings intersecting candidate hazard areas | 1,062 |
| Roads intersecting candidate hazard areas | 35.12 km |
| Settlements potentially isolated in modeled scenarios | 6 |
| EMSR927 Bidur reference spatial coincidence | 37.16% |
These results are not confirmed damage assessments.
The post-event satellite observation was acquired ten days after the flood. Mountainous terrain, radar shadow, layover, and other surface changes introduce uncertainty.
The 37.16% reference coincidence is a spatial comparison, not a classification accuracy score.
We believe making these limitations visible is just as important as showing the results themselves.
Challenges we faced
Understanding real SAR data
One of our biggest challenges was working with actual radar observations instead of ordinary satellite photographs.
Radar backscatter is influenced by several factors, and a change in the signal doesn't automatically tell us what happened on the ground.
Handling mountainous terrain
Our Nepal case study introduced additional complexity because steep terrain can create radar shadow and layover.
This made it especially important to avoid treating every detected change as a confirmed flood or landslide.
Connecting satellite data to human impact
Detecting possible water is only one part of the problem.
We wanted to understand how those changes might affect buildings, roads, and community access. Combining raster observations with infrastructure data and network modeling was a major part of the project.
Validating the results responsibly
Comparing our output with Copernicus reference mapping was challenging because the datasets have different observation times and geographic characteristics.
We learned that validation requires careful interpretation, not just reporting a percentage.
Making complex science understandable
Finally, we had to turn technical geospatial analysis into a dashboard that people could actually explore.
Building the interactive comparison, infrastructure views, bilingual assistant, and reports helped us bridge the gap between scientific processing and accessible communication.
Accomplishments we're proud of
We're especially proud that VARUNA brings multiple capabilities into one connected workflow.
Instead of stopping at satellite change detection, we extended the analysis to infrastructure exposure, modeled road connectivity, independent reference comparison, AI-assisted exploration, and reporting.
We also worked with real Sentinel-1 observations rather than relying on synthetic disaster imagery for the analysis.
Most importantly, we tried to build a system that is honest about uncertainty.
A candidate flood map should not be presented as verified damage. A modeled road closure should not be presented as a confirmed blocked road.
That distinction became one of the most important principles behind VARUNA.
What we learned
This project taught us much more than satellite processing or software development.
We learned that useful disaster intelligence requires combining different kinds of information: satellite observations, geographic context, infrastructure networks, and clear communication.
We also learned that building responsible AI means knowing when the available evidence is insufficient to support a conclusion.
Perhaps our biggest takeaway was this:
Detecting change is a technical problem. Understanding its meaning is a much bigger challenge.
What's next for VARUNA
VARUNA is a prototype, and there is still plenty we want to improve.
Our future priorities include broader testing across real disaster events, stronger terrain-aware detection, better bridge and critical-infrastructure analysis, more detailed hospital-reachability modeling, and faster processing for new locations.
We also want to expand local-language support and make the workflow easier for researchers and emergency-response organizations to reproduce.
Our long-term vision is to make Earth-observation intelligence more accessible, understandable, and useful when it matters most.
Final thought
We started VARUNA with a simple idea: satellites can help us see places that are difficult to reach.
But the real goal is not just to see more.
It's to understand more.
Because when we can't reach the ground, we can still look from space.
Data acknowledgments
Contains modified Copernicus Sentinel data (2026).
Infrastructure data: © OpenStreetMap contributors.
Independent reference mapping: Copernicus Emergency Management Service, EMSR927.
Full methodology, data provenance, reproducibility instructions, and scientific limitations are documented in the project repository.
Built With
- copernicus
- css3
- gdal
- geojson
- geopandas
- geotiff
- git
- github
- html5
- javascript
- networkx
- numpy
- openstreetmap
- pandas
- python
- rasterio
- sentinel-1-sar
- shapely

Log in or sign up for Devpost to join the conversation.