-
-
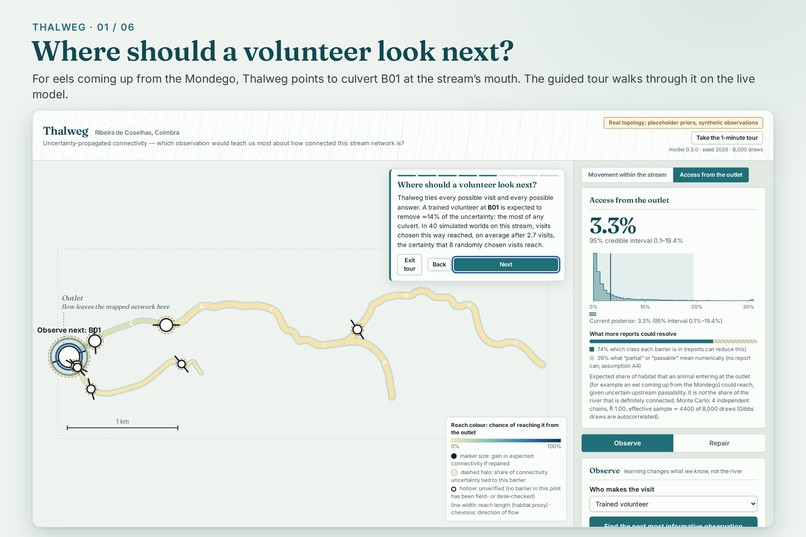
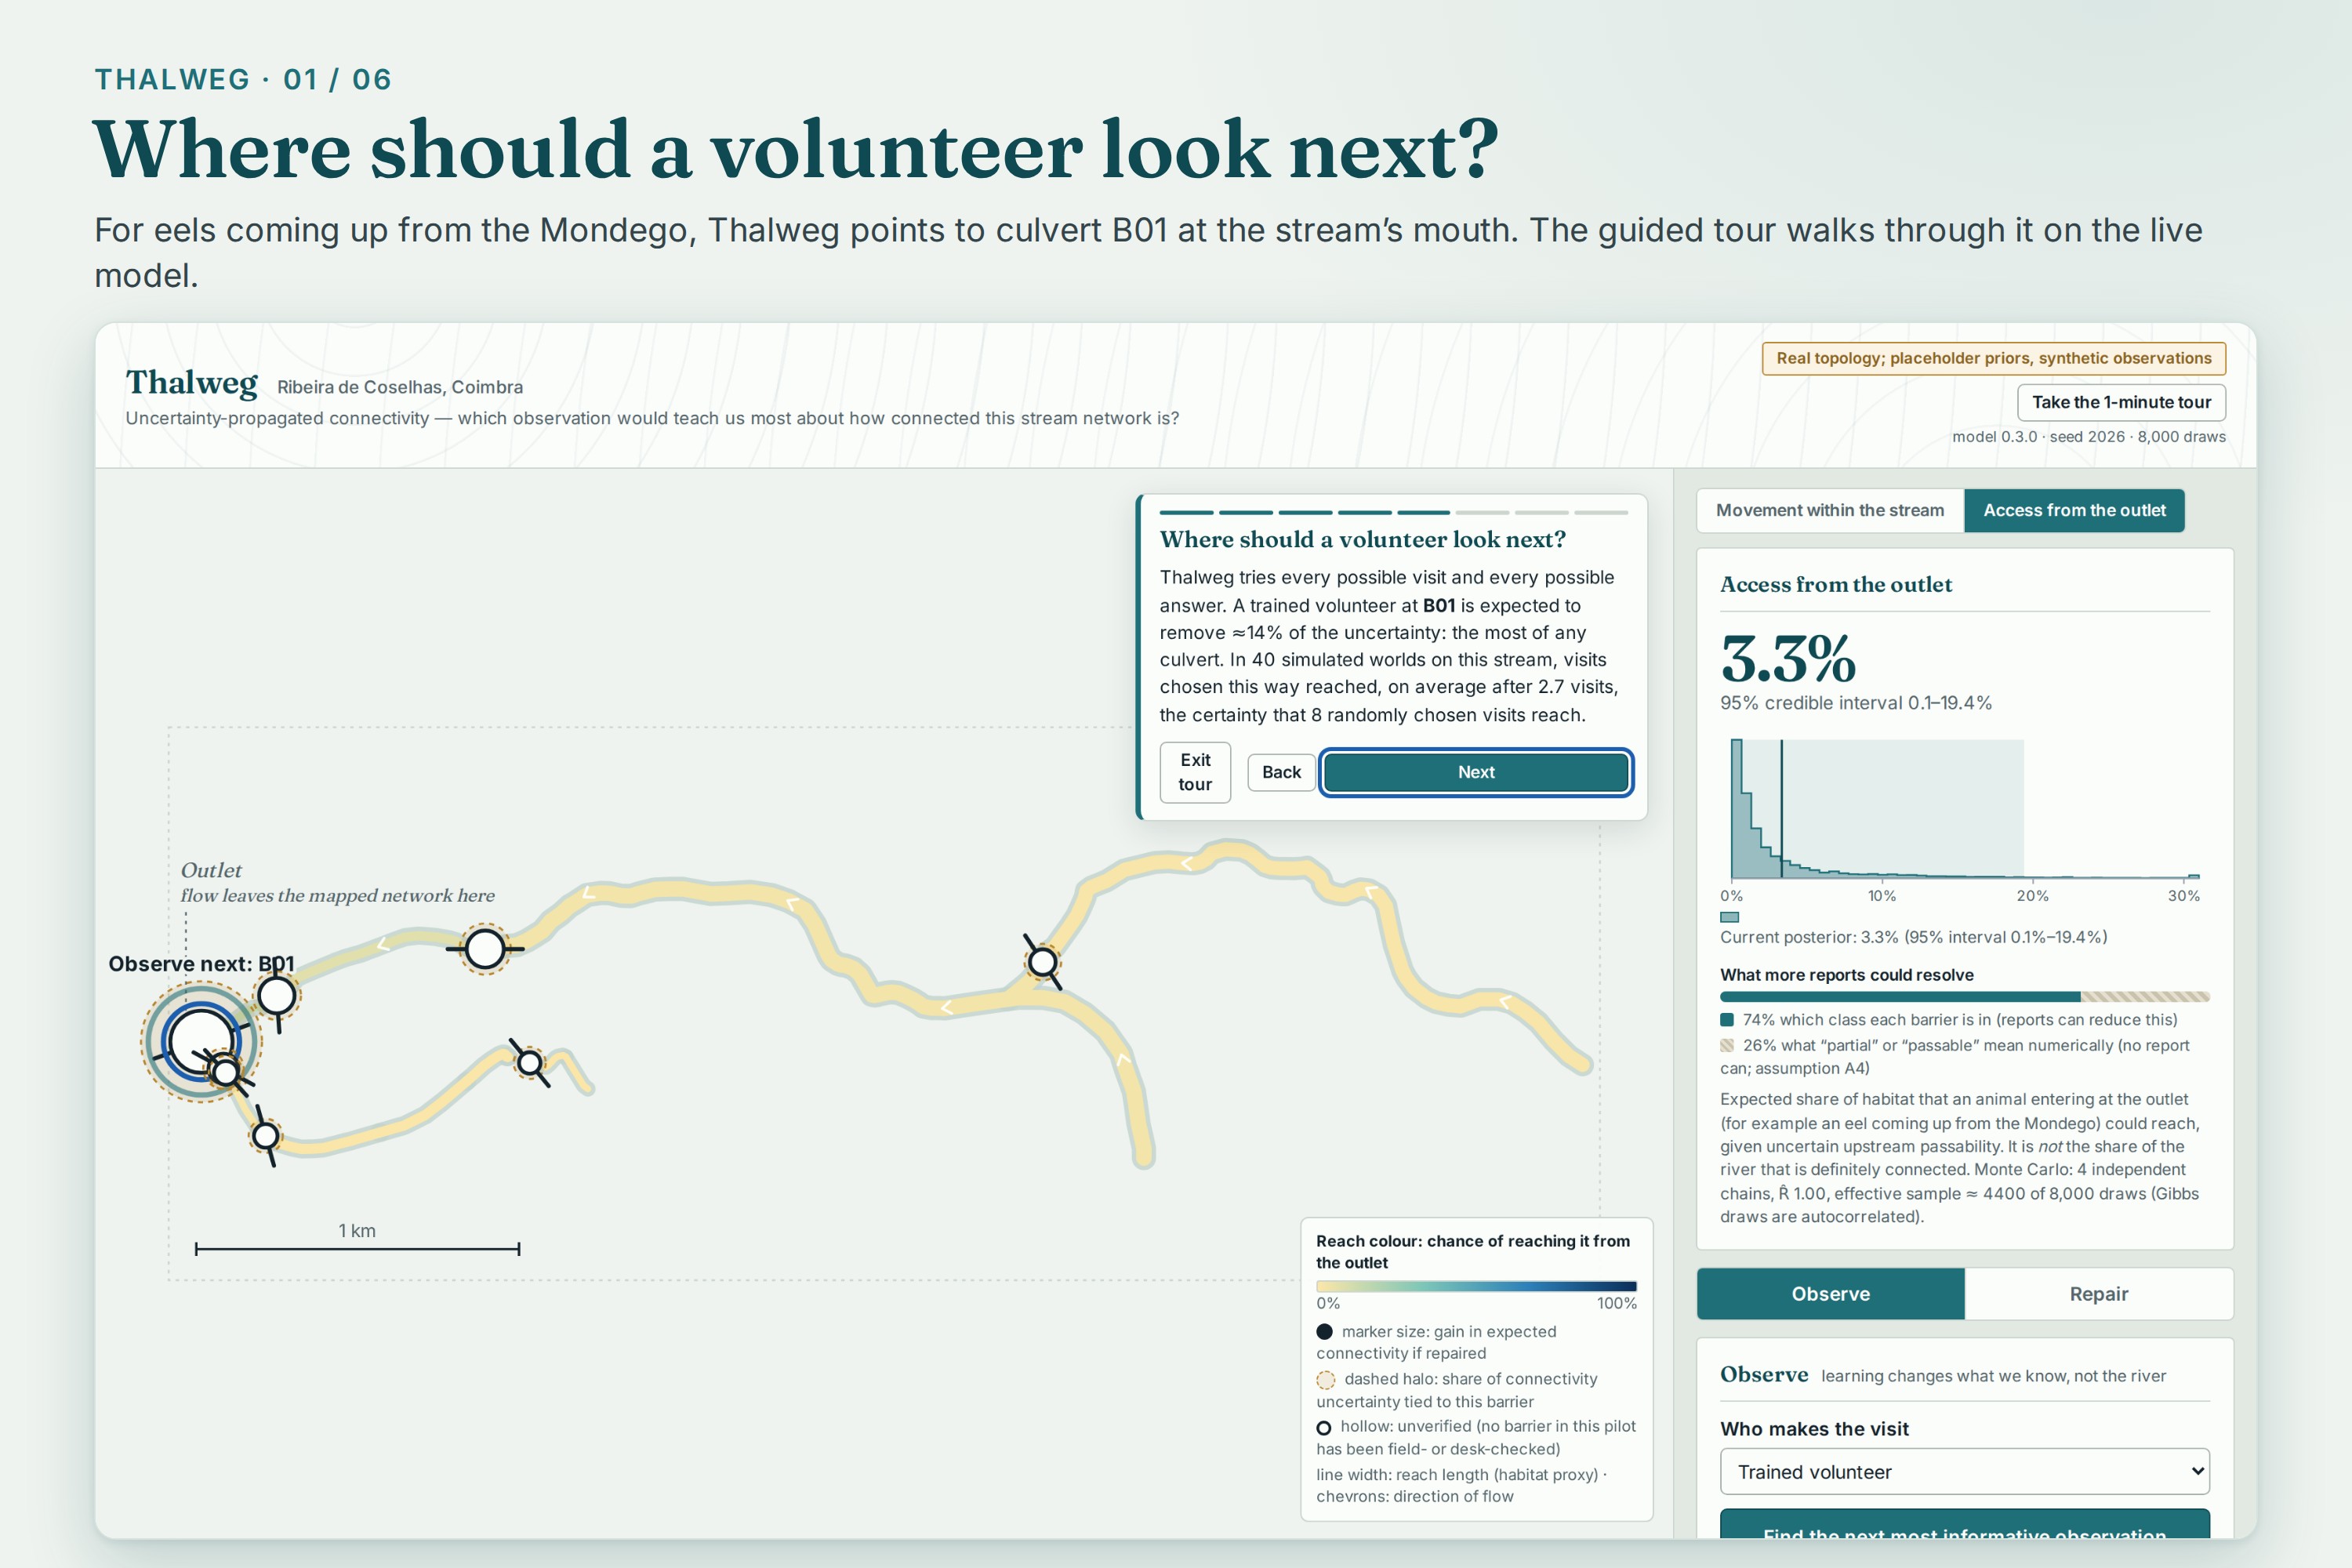
Where should a volunteer look next? For eels coming up from the Mondego, Thalweg points to culvert B01 at the stream's mouth.
-
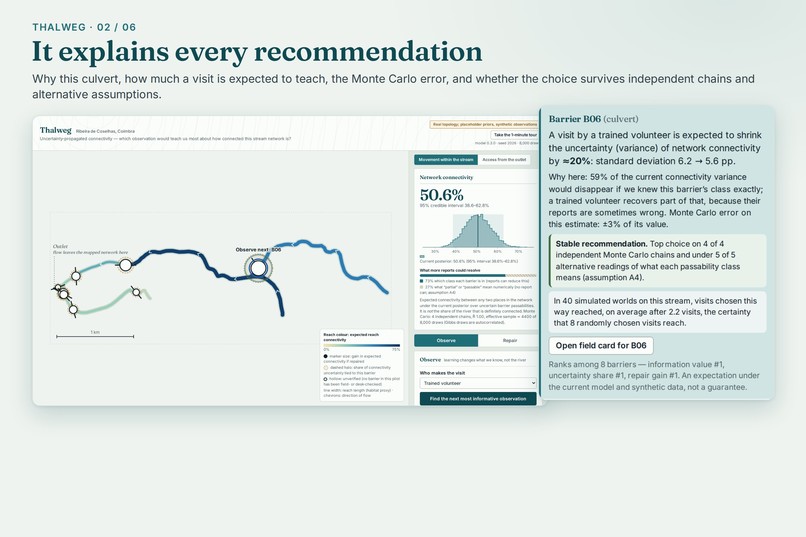
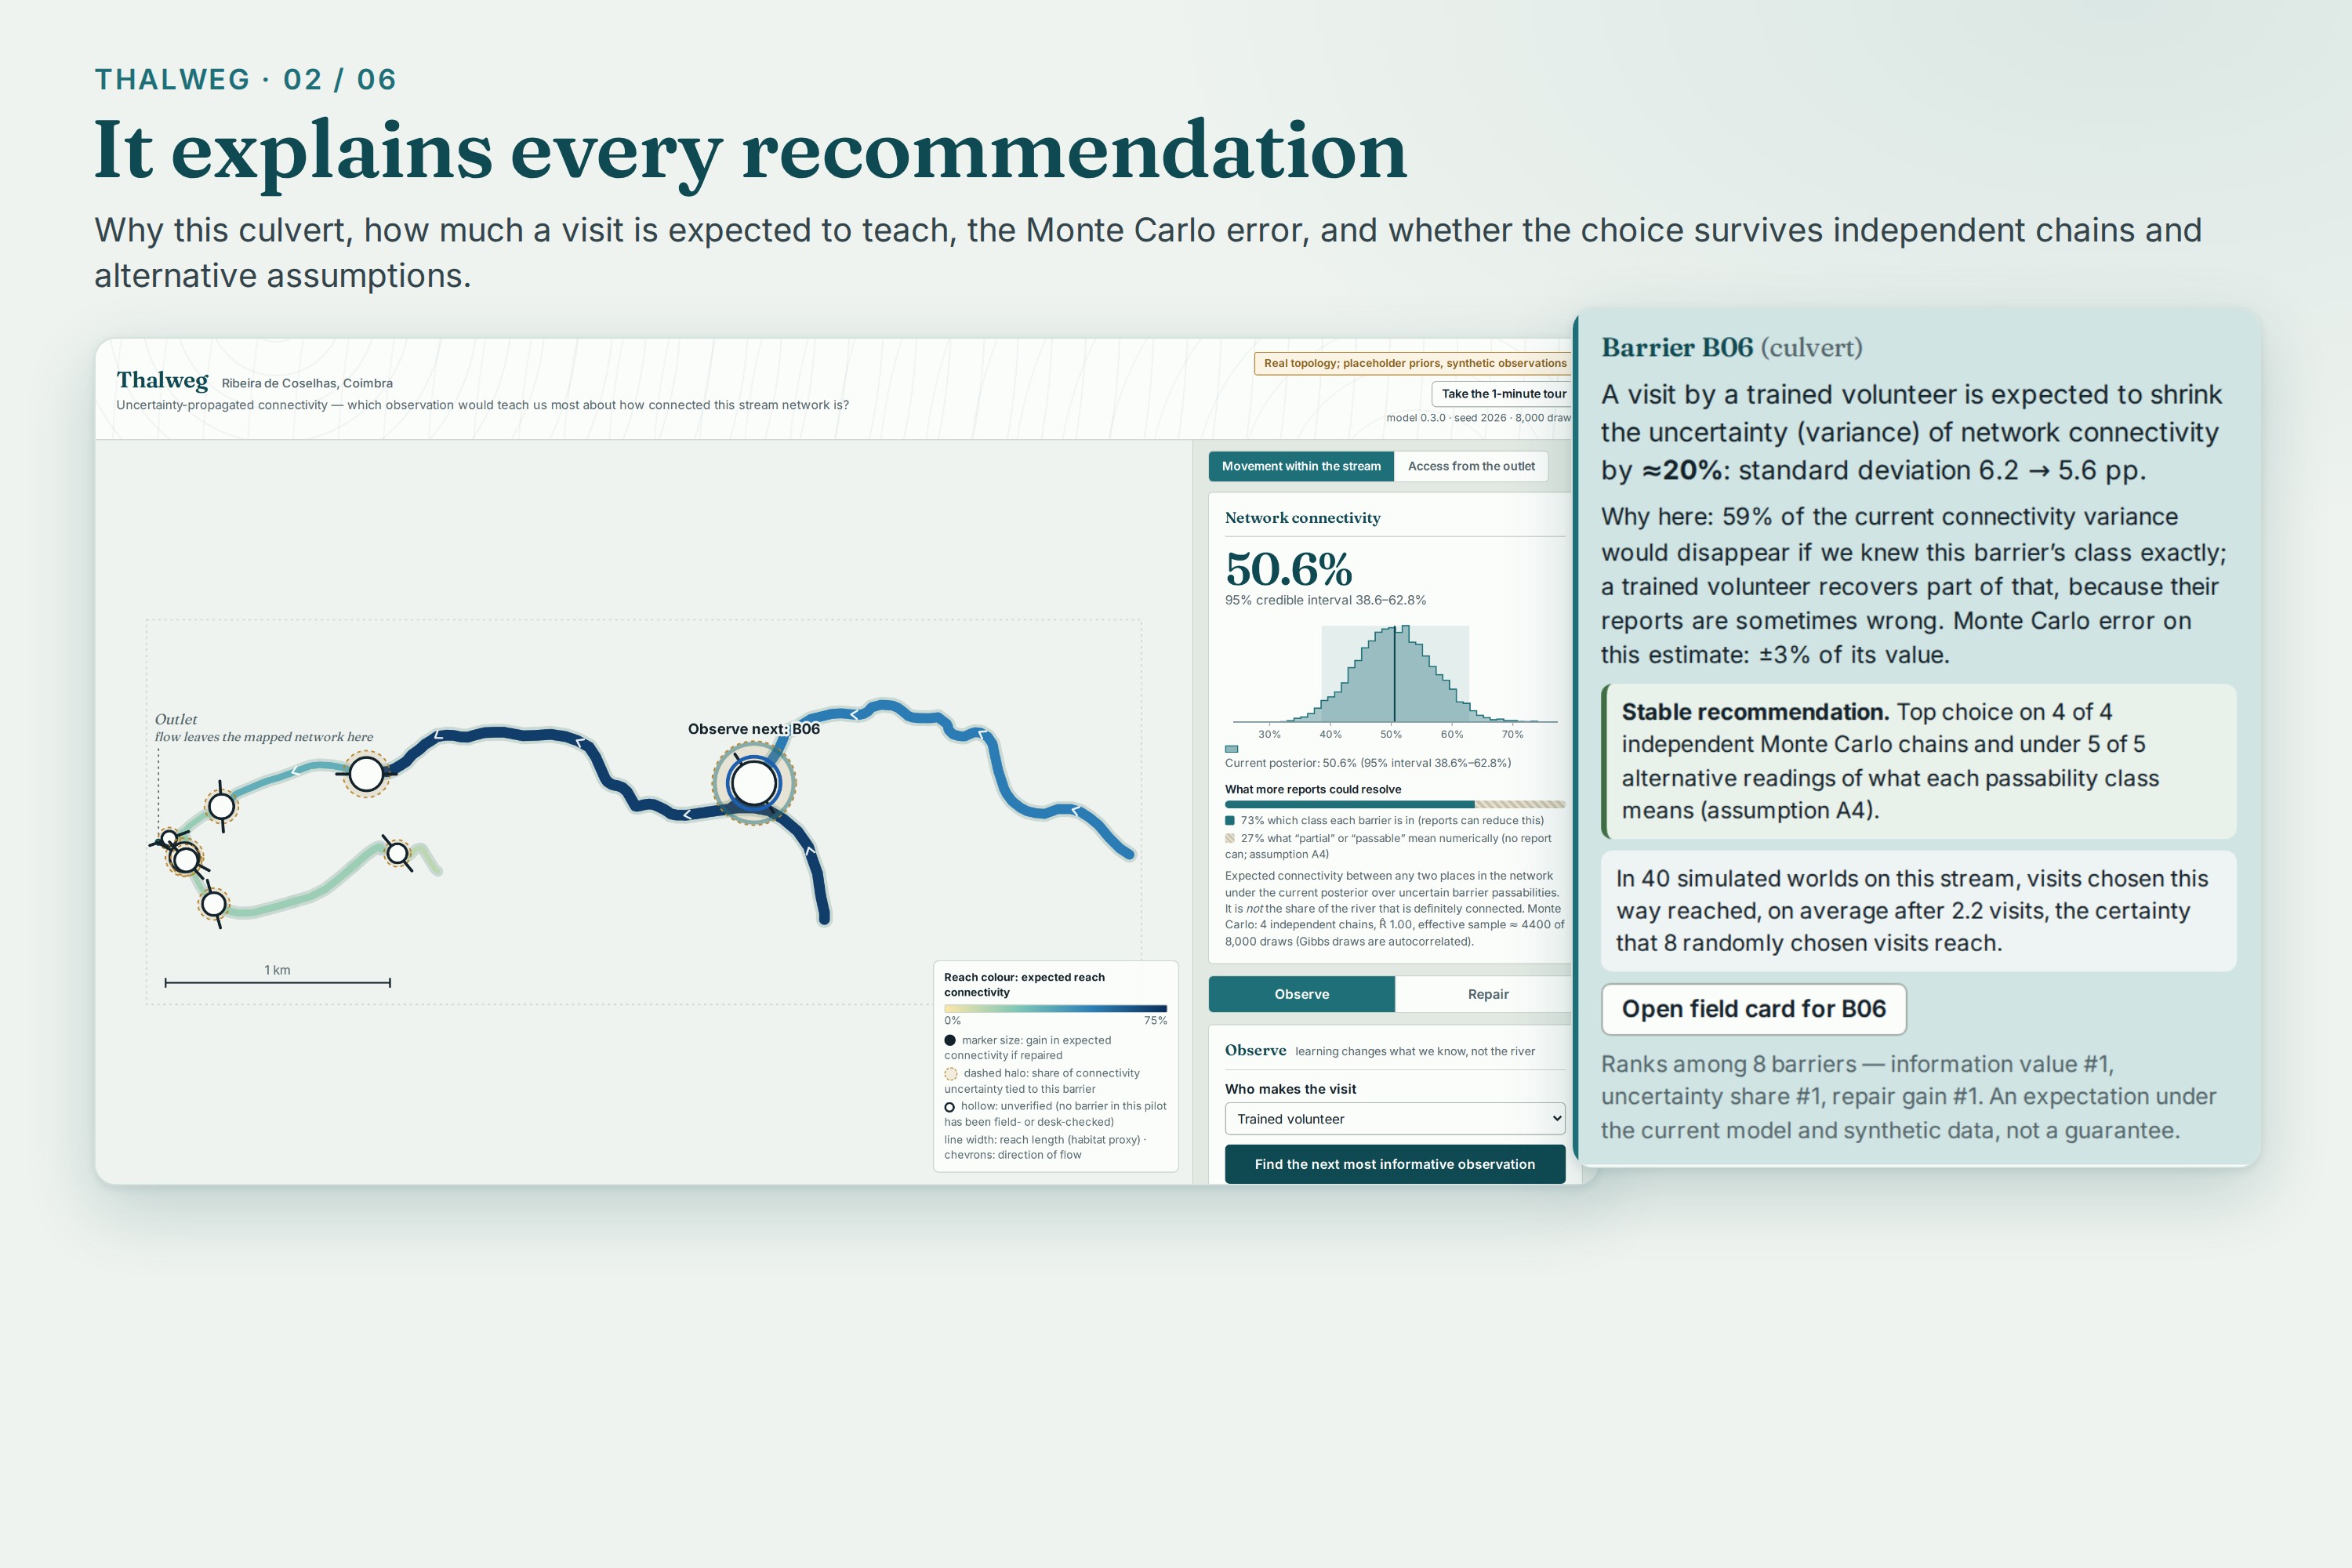
Every recommendation is explained: why this culvert, the expected uncertainty reduction, its Monte Carlo error and robustness.
-
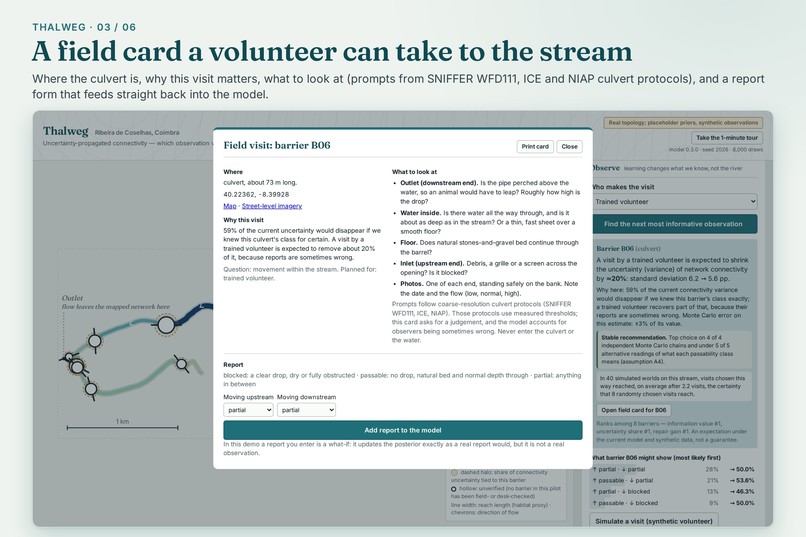
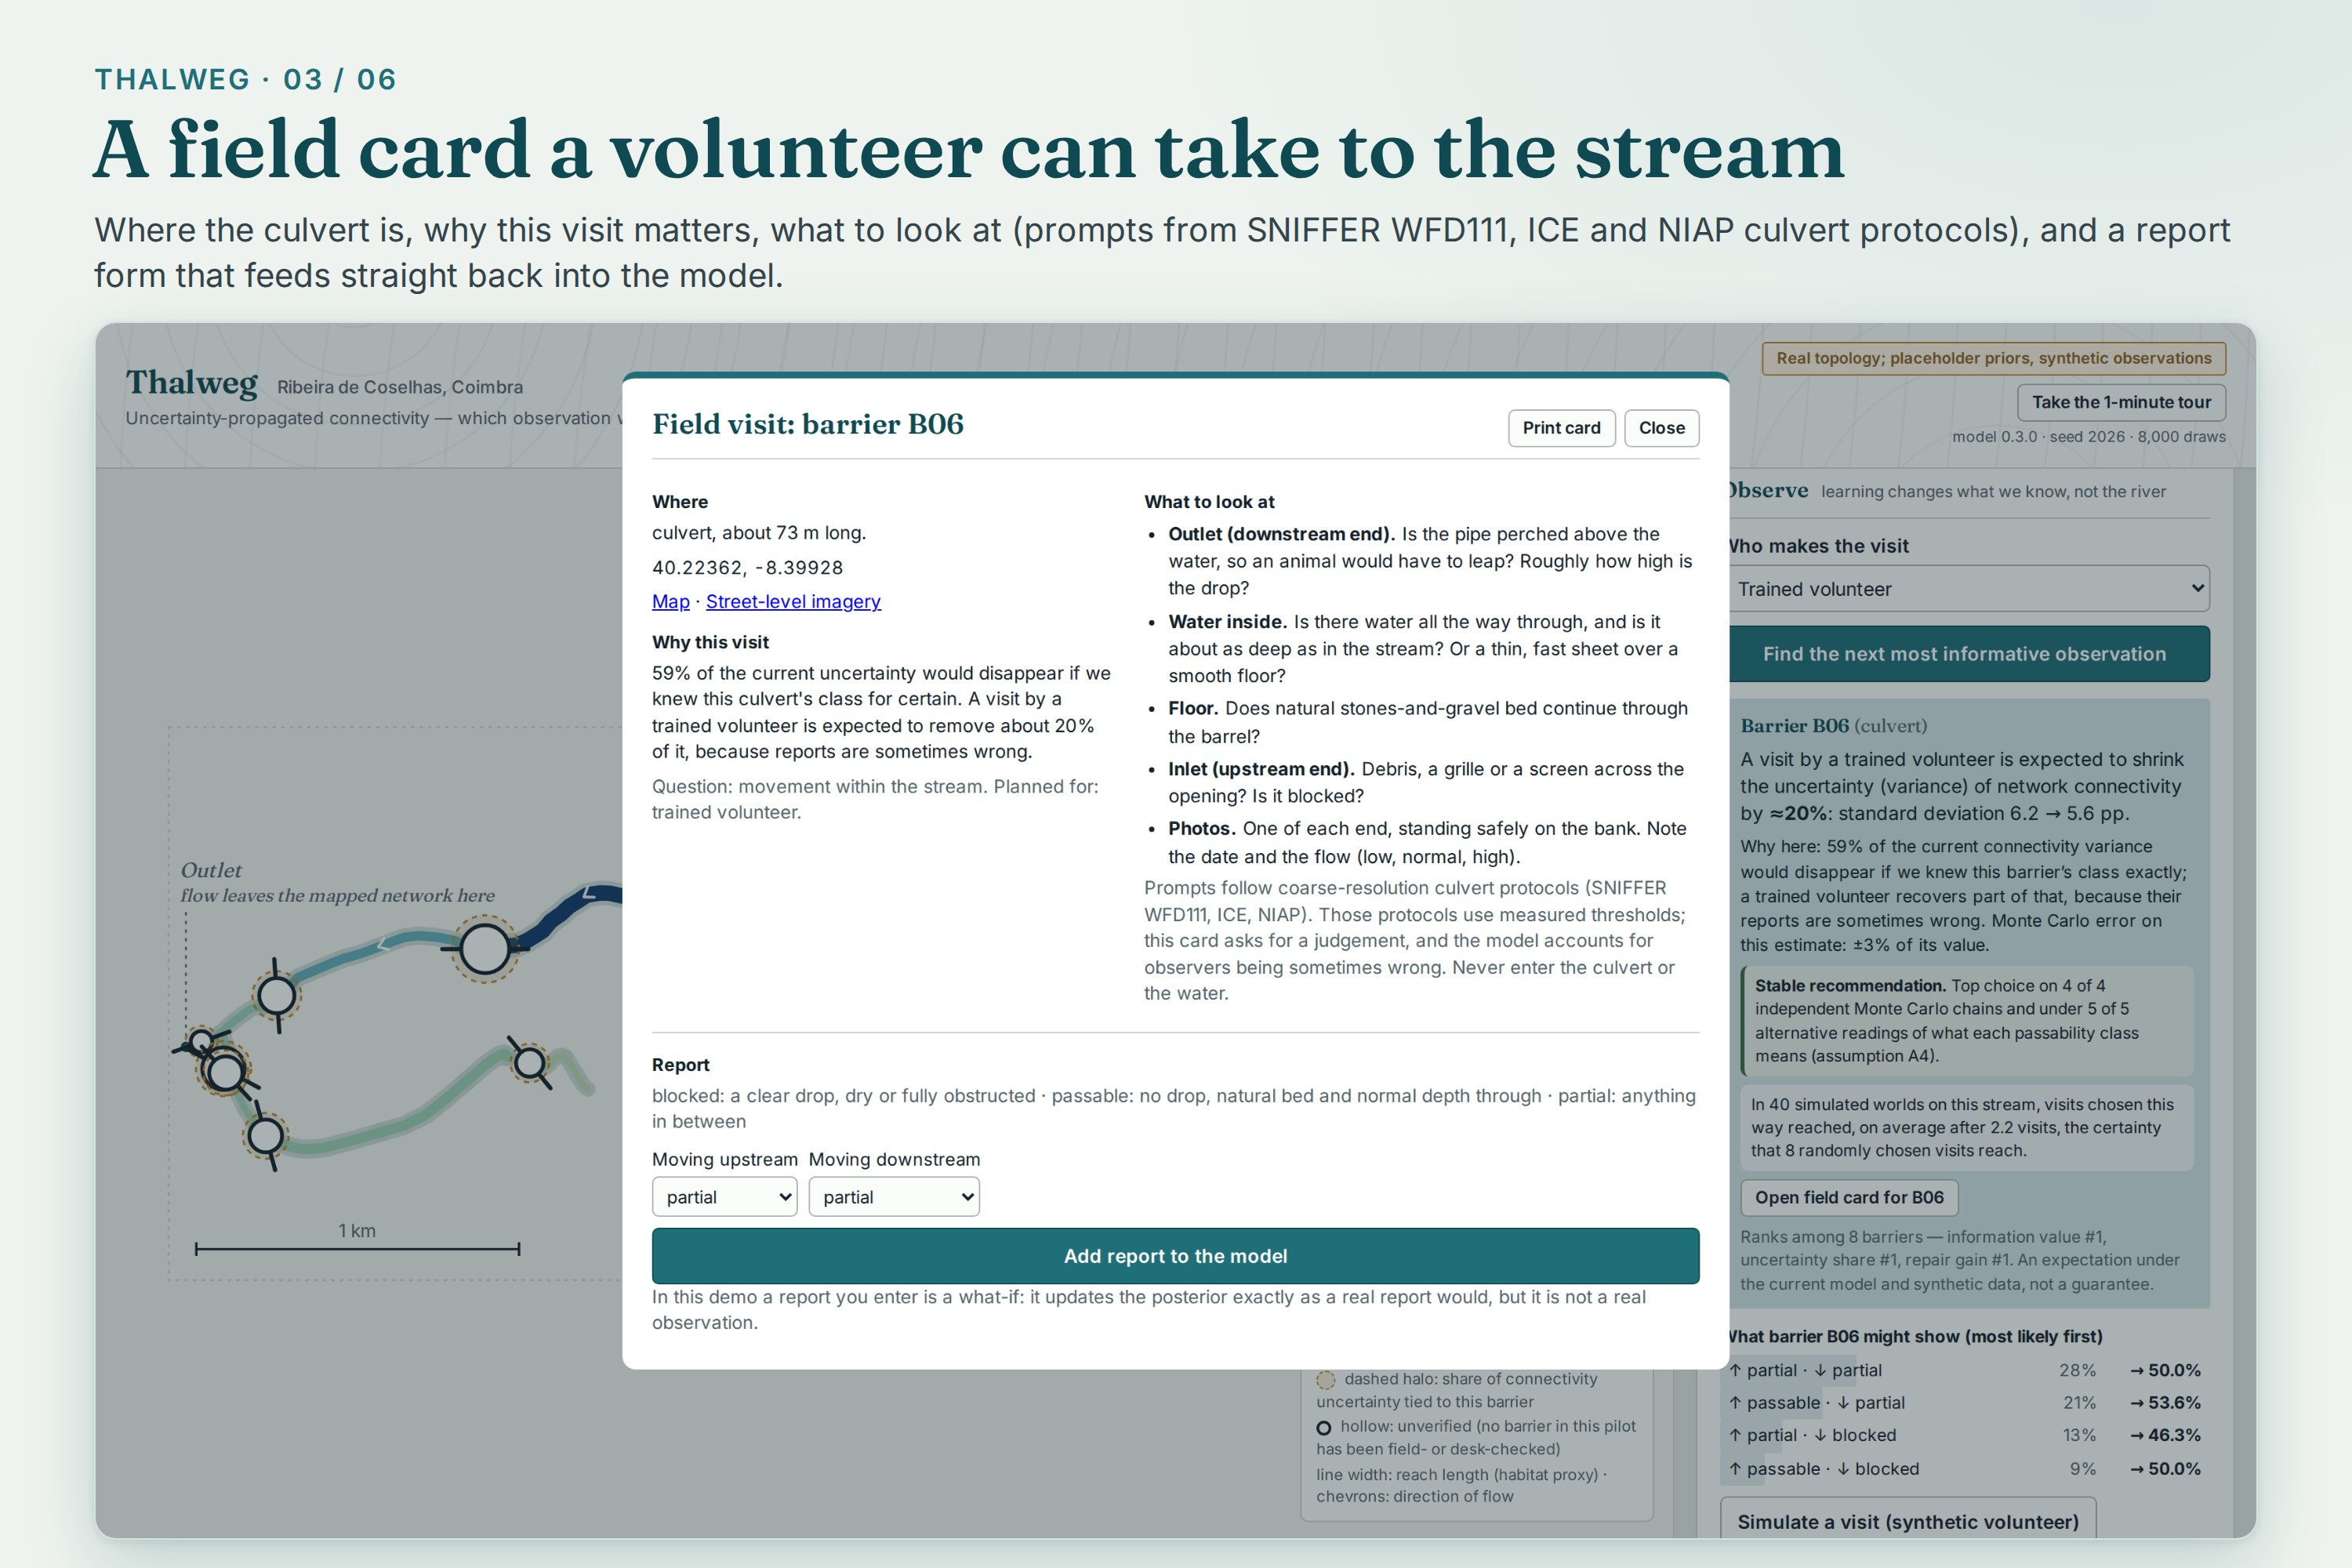
A printable field card: where the culvert is, why this visit matters, what to check, and a report form that feeds the model.
-
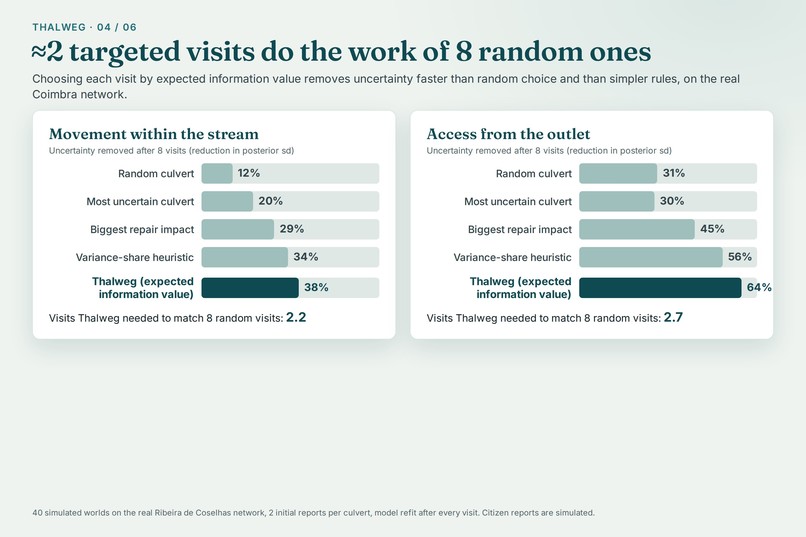
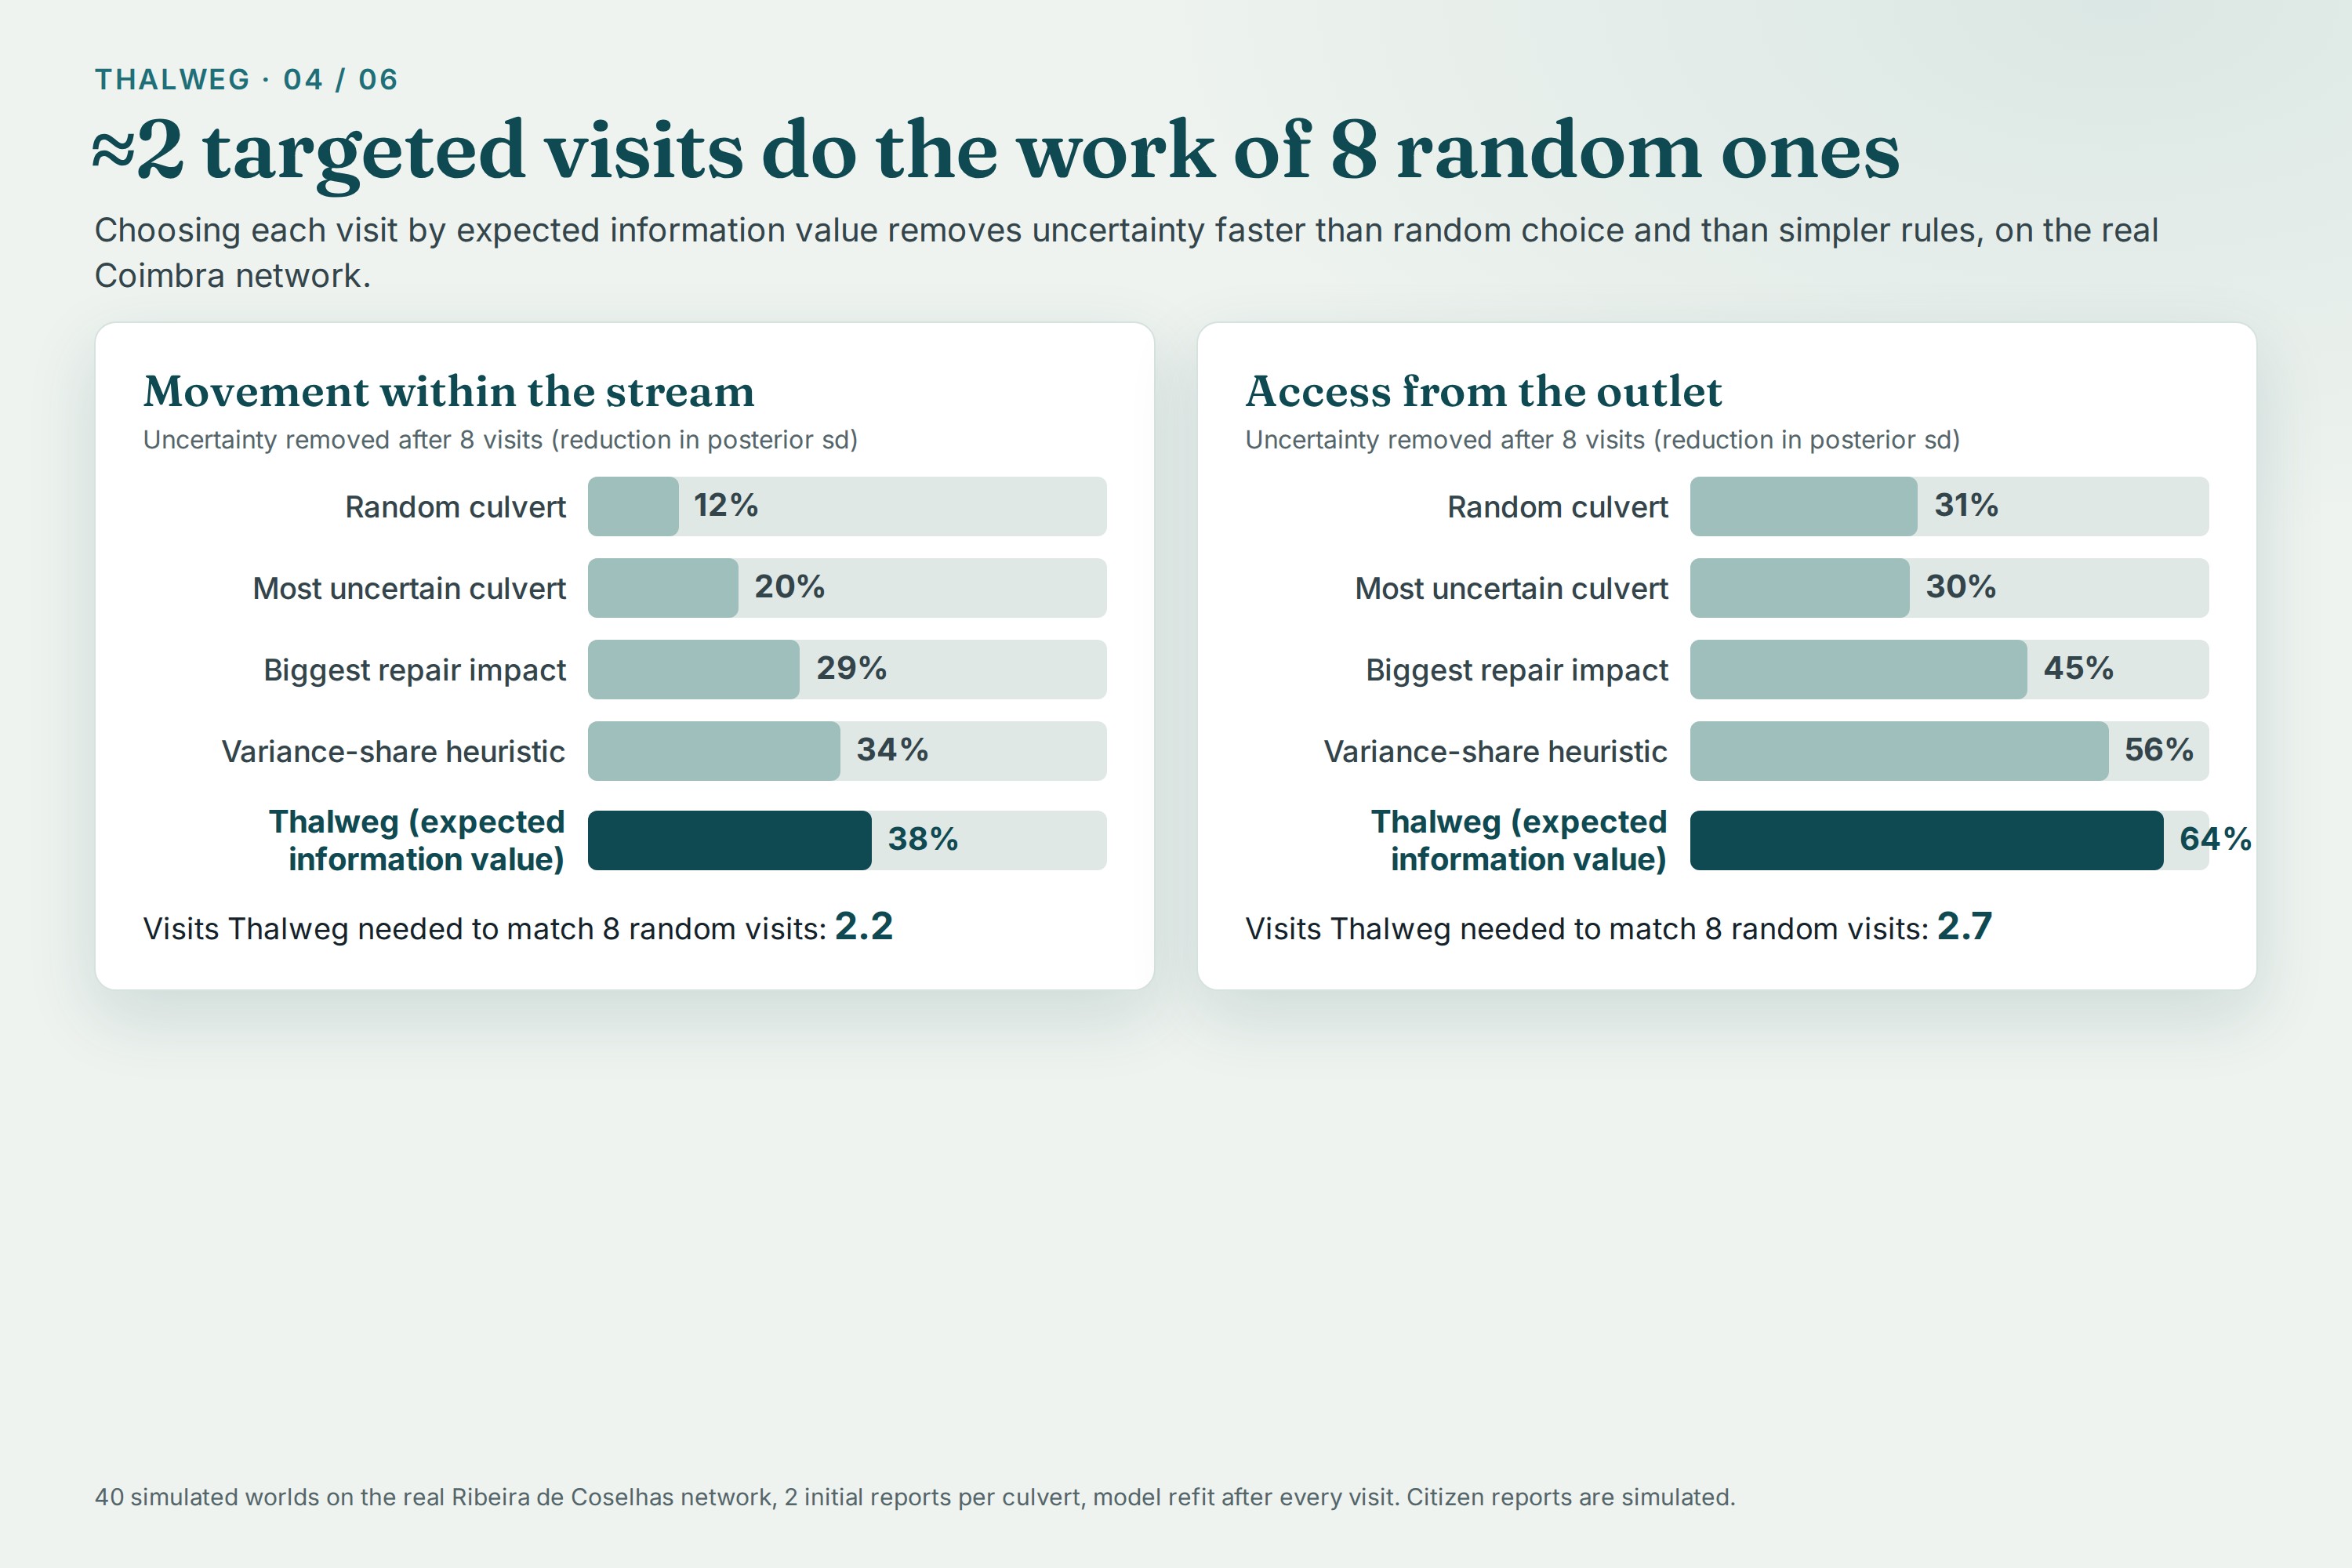
About 2 targeted visits do the work of 8 random ones: 40 simulated worlds on the real Ribeira de Coselhas network.
-
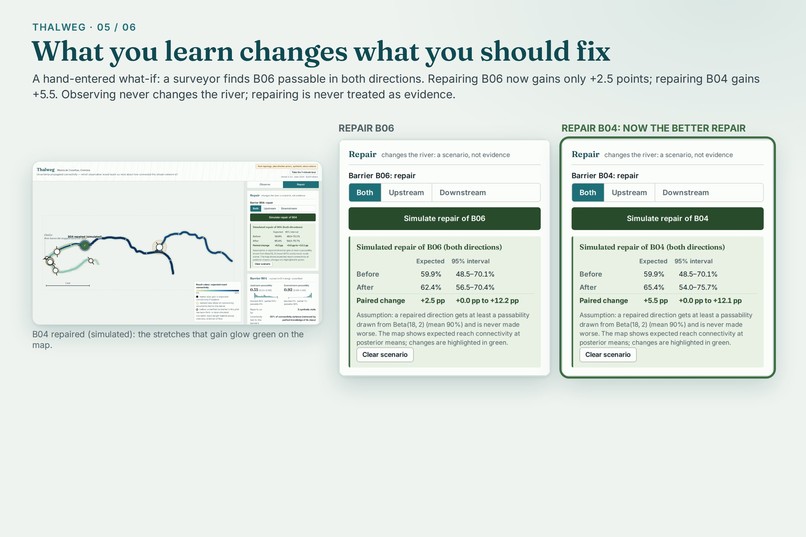
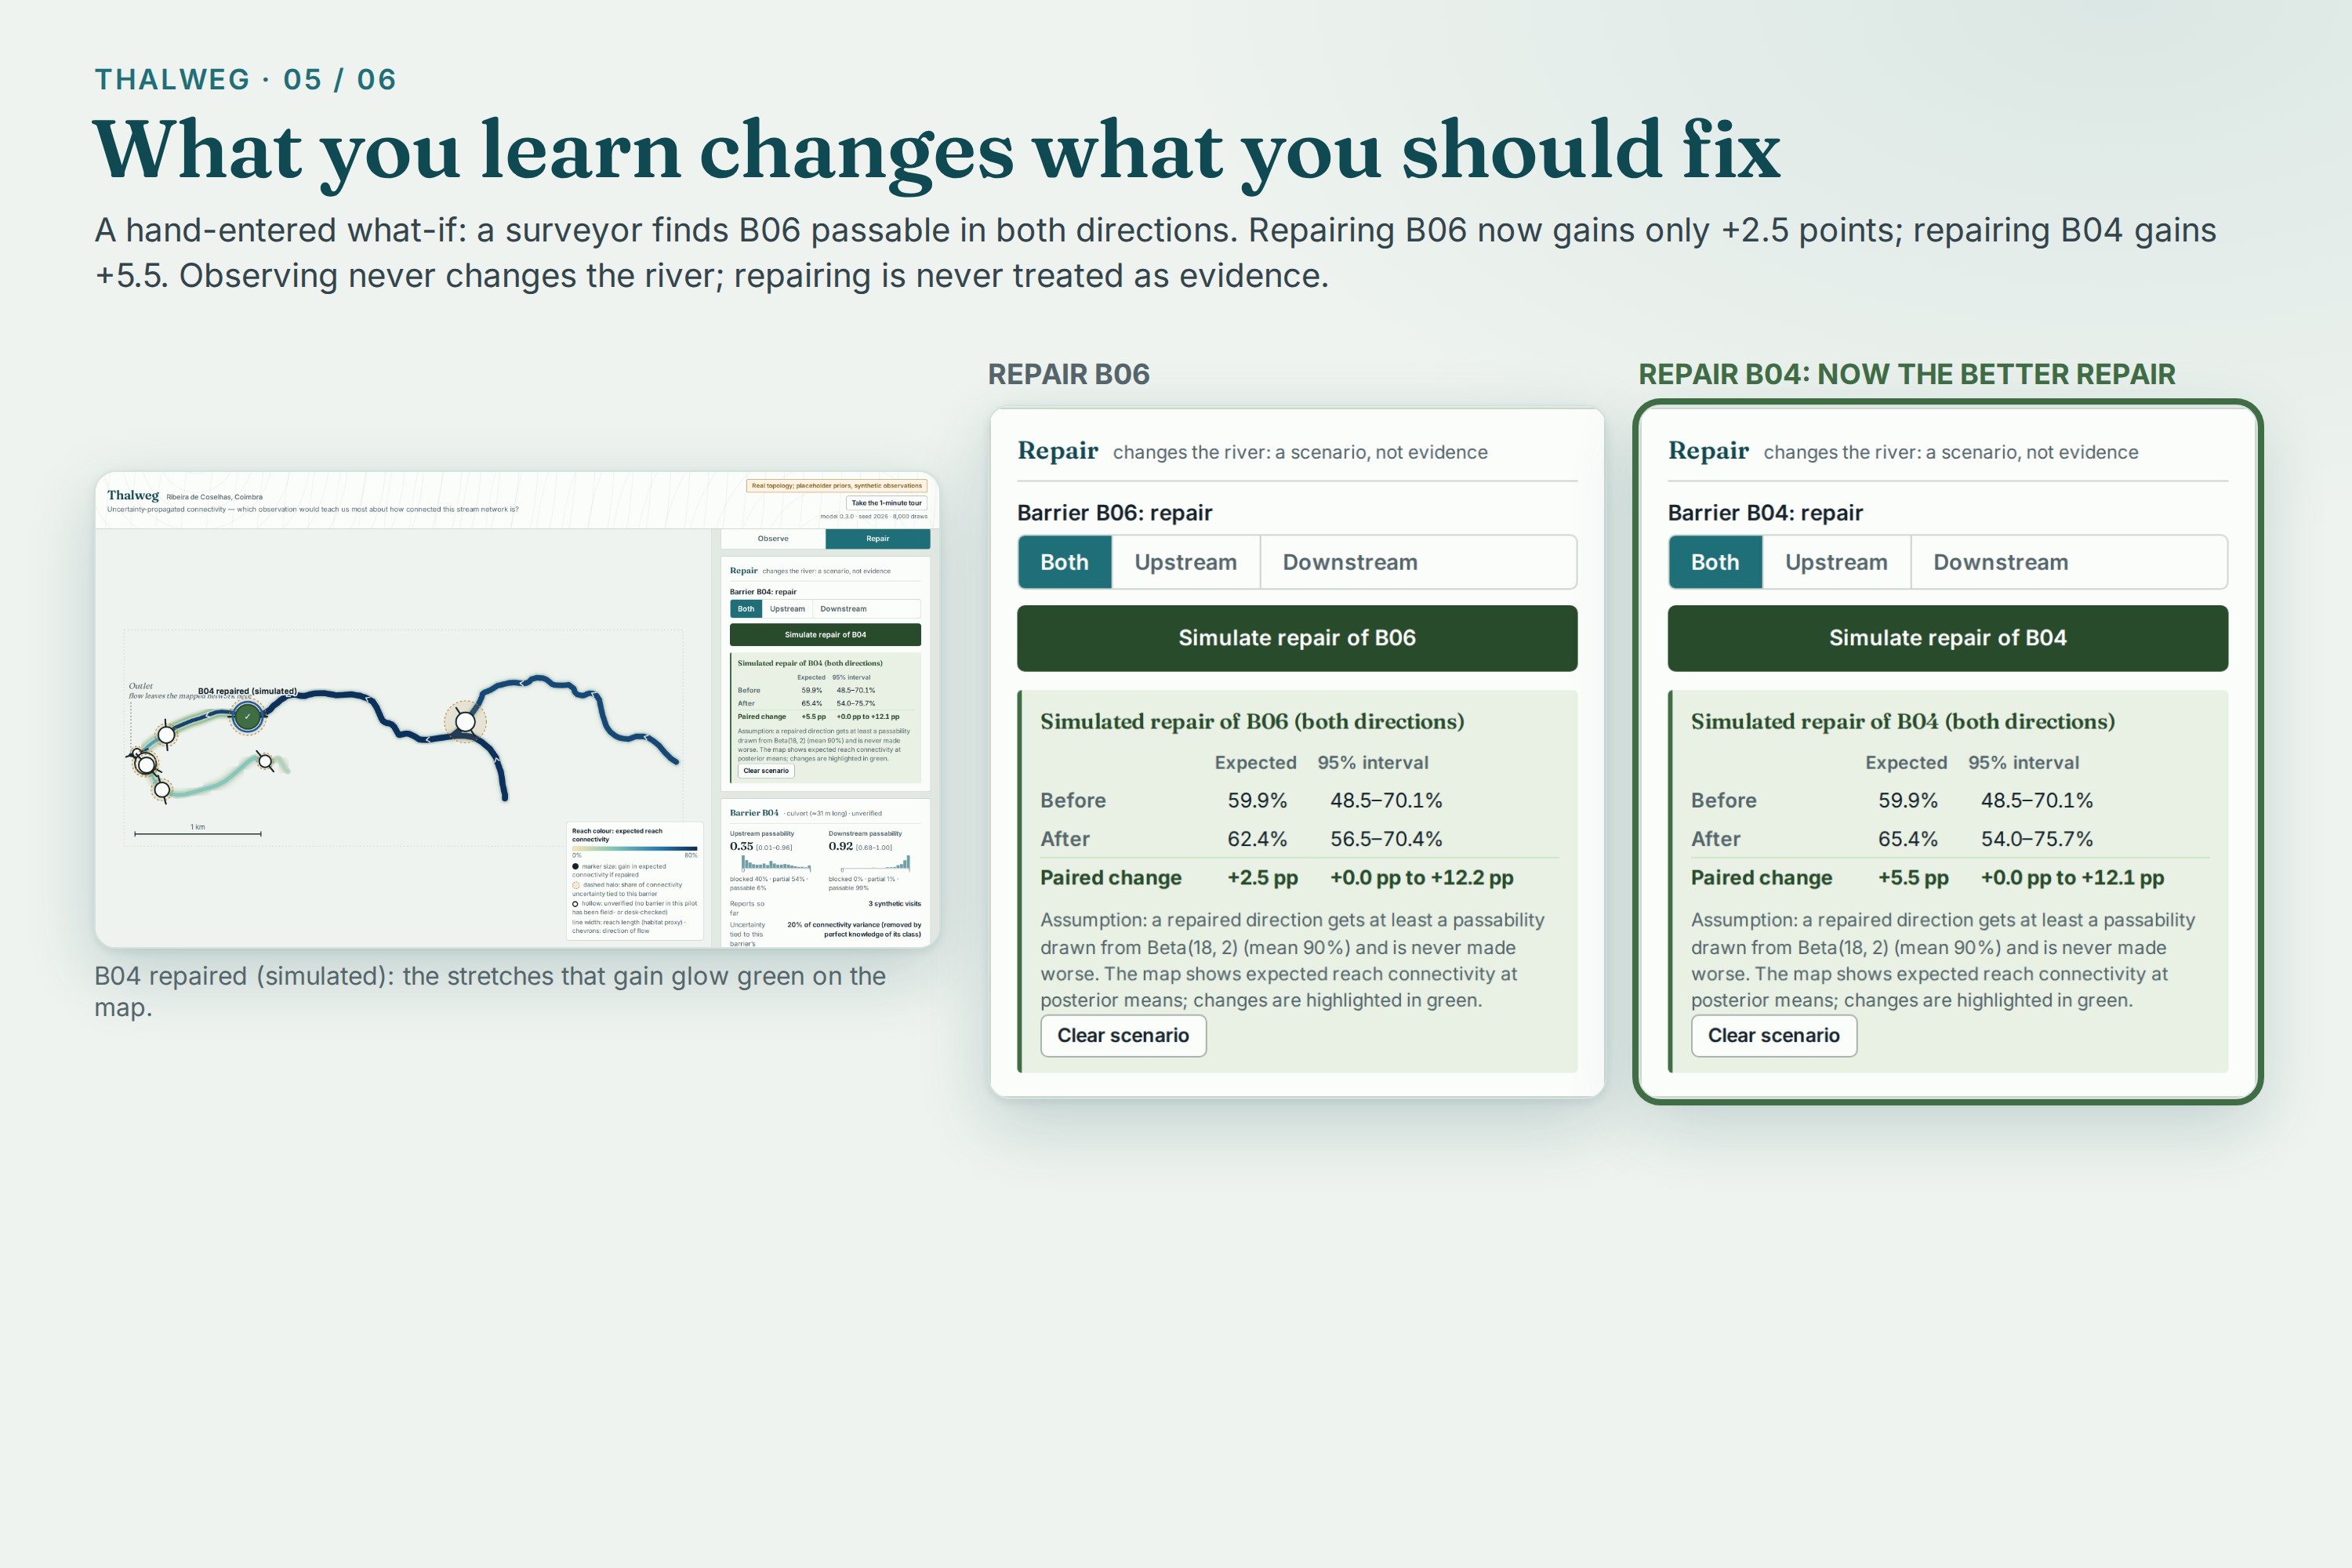
What you learn changes what you should fix: after a what-if report at B06, repairing B04 gains +5.5 points vs +2.5 for B06.
-
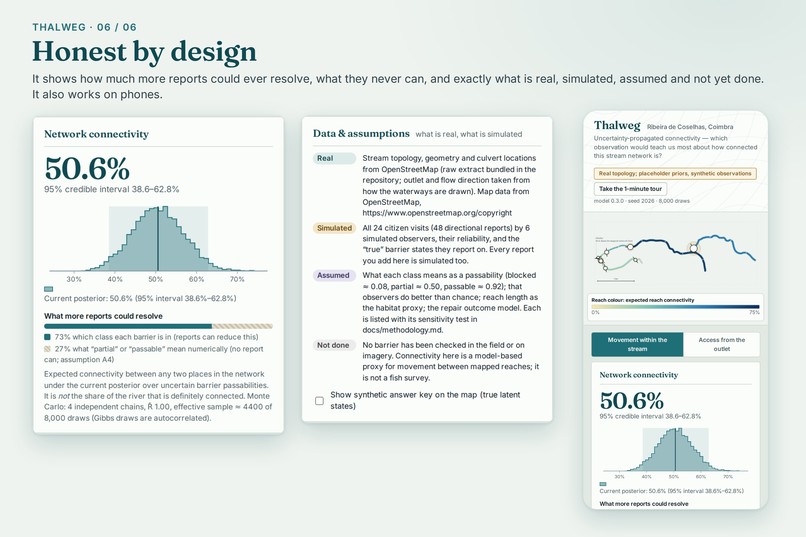
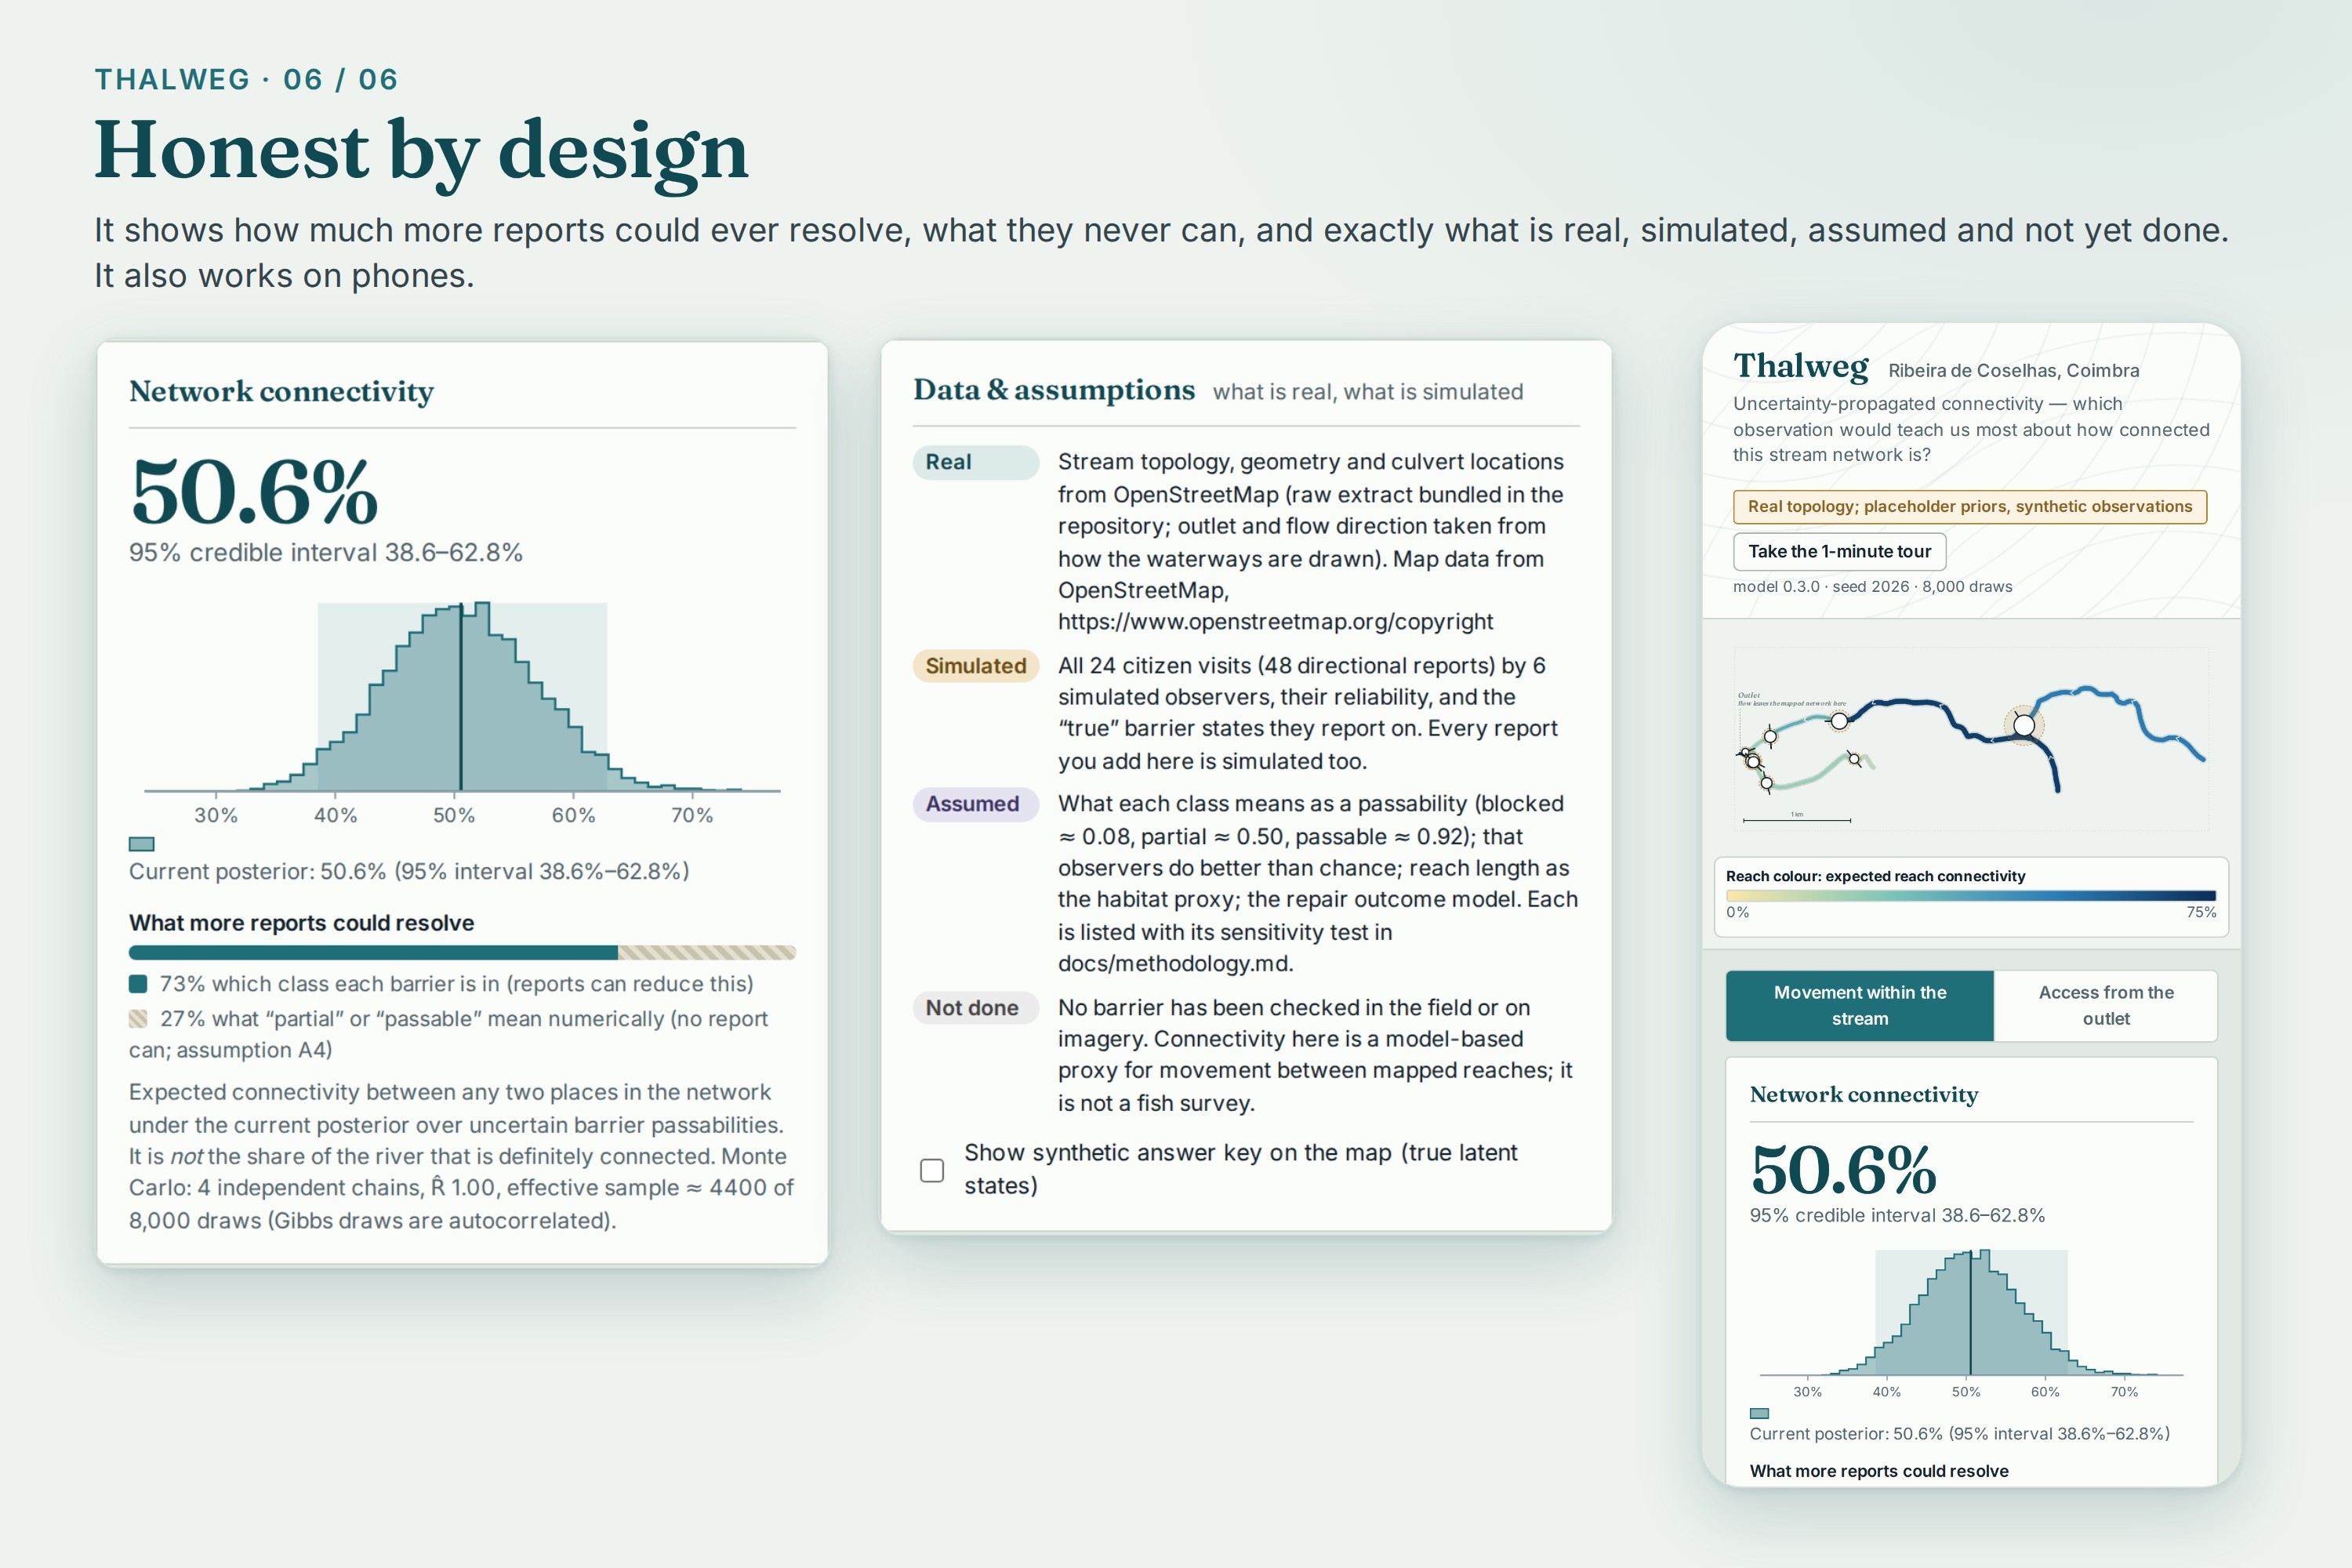
Honest by design: shows what more reports can resolve, what they never can, and what is real, simulated or assumed.
Track: Track 3, AI-Supported Assessment. The track asks for AI that supports stream assessment without replacing human judgement, because citizen observations are inconsistent and error-prone. That is exactly the problem Thalweg solves. It uses probabilistic machine learning to learn how reliable each volunteer is, shows how their disagreement turns into uncertainty about a whole stream network, and recommends the single next observation a person should make, with an explanation, a validation check and a clear statement of what it cannot know. People make every observation and every decision.
What is real and what is simulated. The stream network is real: the topology, geometry, culvert locations and flow direction of the Ribeira de Coselhas in Coimbra come from OpenStreetMap. Every citizen report, every observer's reliability and every "true" barrier state in the demo is simulated, and the app says so on every screen. No culvert has been checked in the field yet.
Inspiration
On a OneAquaHealth community walk along the Ribeira de Coselhas in Coimbra, residents remembered eels swimming up from the Mondego. Today the stream runs through culverts under roads and buildings. Whether an eel could still get in depends on a handful of culverts that nobody has assessed, and the citizen reports about them will disagree, because volunteers differ in experience and every one of them is sometimes wrong.
Connectivity indices such as the Dendritic Connectivity Index treat each barrier's passability as a known number. In citizen science it is not known. We kept coming back to one practical question for the people who give their time:
If you can make only one more observation of this stream, where should it be?
What it does
Thalweg is a small research instrument with a map at its centre.
- Shows the real stream. The Ribeira de Coselhas network is drawn at its true shape from OpenStreetMap, with flow direction, its outlet and its 8 culverts.
- Learns which volunteers to trust. Reports say blocked, partial or passable for each direction through a culvert. A Bayesian observer model learns each volunteer's reliability from the reports themselves and turns them into a probability distribution for every culvert, upstream and downstream.
- Shows where the uncertainty lives. That uncertainty is propagated through the network to two ecological questions: movement within the stream (expected connectivity 50.6%, 95% credible interval 38.6–62.8%) and access from the outlet, meaning how much habitat an animal coming up from the Mondego could reach (3.3%, interval 0.1–19.4%).
- Recommends the next observation, and explains why. For every culvert and every possible answer, Thalweg computes how much a visit would be expected to shrink the uncertainty. For movement within the stream the best visit is culvert B06 (about 20% less variance). For eels coming from the Mondego it is B01, at the mouth (about 14%). Each recommendation shows its Monte Carlo error and whether it survives four independent model runs and five alternative assumptions. Both of these do.
- Takes it to the field. A printable field card says where the culvert is, why this visit matters, and what to look at (prompts from established culvert-assessment protocols: SNIFFER WFD111, ICE, NIAP). Its report form feeds straight back into the model.
- Keeps learning and changing apart. Observe updates what we believe and never changes the river. Repair simulates changing the river and is never treated as evidence. A what-if shows why this matters: if a surveyor found B06 passable in both directions, repairing it would gain only 2.5 points of connectivity, and the best repair would move to B04 (+5.5). Learning changes what you should fix.
- Is honest about its limits. About a quarter of the uncertainty is about what "partial" means as a number, and no number of categorical reports can reduce it. The app shows that split, and a Data & assumptions card lists what is real, simulated, assumed and not yet done.
- Plays well with other systems. Rankings export as GeoJSON, and session reports as an HL7 FHIR R4 Bundle of Observation resources.
A one-minute guided tour walks a first-time visitor through all of this on the live model.
Target users
- Citizen-science volunteers, who want their limited time to count.
- Coordinators and researchers (such as the OneAquaHealth teams) deciding where to send volunteers and how far to trust what comes back.
- Municipal and water agencies prioritising culvert assessments before committing money to repairs.
Expected impact on ecosystem and human health
- Volunteer effort goes further. In 40 simulated worlds on this stream, visits chosen by Thalweg reached, after about 2 visits (2.2 within the stream, 2.7 for outlet access), the certainty that 8 randomly chosen visits reach.
- Ecosystem health. Barrier connectivity determines whether migratory fish such as the European eel, listed as Critically Endangered on the IUCN Red List, can reach urban tributaries at all. Better-targeted assessment means repairs go where they matter.
- Human health and communities. Thalweg does not invent a health score. Its contribution to One Health is indirect but real: it strengthens the citizen-science link between residents and their streams, makes community observations more trustworthy, and supports evidence-based decisions about the urban freshwater ecosystems people live alongside.
How we built it
Engine (Python, NumPy only). The pipeline runs from an OpenStreetMap extract to a flow-directed graph. Contiguous culvert segments are grouped into physical structures, and the network is rooted at its true outlet, taken from the direction waterways are drawn in OSM and checked structure by structure. Each culvert \(m\) has an upstream and a downstream passability, \(p_m^{\uparrow}\) and \(p_m^{\downarrow}\). Connectivity is habitat-weighted, with reach length \(w_i\) as the habitat proxy:
$$C = \sum_i \sum_j w_i\, w_j \prod_{m \in \text{path}(i \to j)} p_m^{\text{dir}(m)}$$
Observer model. Reports are modelled with a Dawid–Skene-style misclassification model: each observer has a confusion matrix over the latent classes, and passability given a class is a Beta distribution. We fit it by Gibbs sampling on 4 independent chains (split \(\hat{R} = 1.00\), effective sample about 4,400 of 8,000 draws).
Choosing the next observation. This is Bayesian active learning: the expected information value of a visit \(y\) at a culvert is the variance it is expected to remove,
$$\mathrm{EVI} = \mathrm{Var}(C) - \mathbb{E}_y\left[\mathrm{Var}(C \mid y)\right],$$
computed exactly on the posterior draws by reweighting them, so the browser can rank every candidate visit in milliseconds. The law of total variance also tells us what reports can never fix:
$$\mathrm{Var}(C) = \mathrm{Var}\big(\mathbb{E}[C \mid z]\big) + \mathbb{E}\big[\mathrm{Var}(C \mid z)\big]$$
The first term is the uncertainty about which class each culvert is in, which more reports can reduce. The second is uncertainty about what "partial" means as a number, which no report can reduce.
App (Next.js static export, TypeScript). The app ports the weighted statistics, the information-value search and the repair comparison, and checks them against Python with parity tests. There is no server, no API keys and no LLM. The app works offline and makes zero external requests once loaded. It is deployed on Vercel.
Validation. 70 Python tests and 12 Python-vs-TypeScript parity tests, closed-form oracles for every metric, and synthetic worlds with known truth for calibration, identifiability and policy comparisons. The demo video is recorded from the production build by a script that only clicks, so every number on screen is computed live.
Challenges we ran into
- Our first pilot build was quietly wrong in two ways, and the tests could not see it. It counted every mapped segment of a culvert as a separate barrier (one continuous culvert became six barriers in series), and it rooted the network at the headwater instead of the outlet, swapping upstream and downstream. Plotting the raw OSM data with flow arrows exposed both. The builder now groups segments into physical structures, and it refuses any extract whose flow directions disagree with the network. Coimbra's 8 culverts pass 8 of 8 checks. Ghent, our other candidate, is a braided canal system and fails, so we rejected it.
- Identifiability. With no verified barriers, observer reliability cannot be learned without assuming that observers do better than chance. We state that assumption and show its effect instead of hiding it.
- Honesty under time pressure. It would have been easy to make the demo look like real field data. We chose to make the line between real and simulated visible everywhere instead.
Accomplishments that we're proud of
- The loop works end to end on a real stream: uncertain reports → calibrated observers → uncertainty about the network → the most informative next visit → a field card → a report → an updated posterior. You can try it in the browser.
- We can say when the extra machinery pays off. On a larger synthetic test network, EVI and a simpler variance-share heuristic were statistically indistinguishable. On the real Coimbra network with sparse reports, EVI beat the heuristic: final uncertainty was lower by 0.23 ± 0.07 points in 30 of 40 simulated worlds, and by 0.72 ± 0.27 in 28 of 40 for outlet access.
- Different questions point to different places. Within the stream, the visit worth making is B06. For eels coming from the Mondego, it is B01 at the mouth. Both choices are robust.
- Separating learning from changing, and showing on screen that what you learn can change what you should fix.
What we learned
- Showing the limits (Monte Carlo error, robustness checks, and what reports can never resolve) made the tool more convincing, not less.
- Tests prove the code does what it says. They do not prove the data mean what you think. The most important bugs we found were in the data, and we found them by plotting it.
- Reliable observations come from humans, and making them count is the job of the tool.
What's next for Thalweg: Make Every River Observation Count
- Real reports. Connect Thalweg to the OneAquaHealth Citizen Science App or the AMBER Barrier Tracker, so real observations replace simulated ones.
- Verified anchors. Desk-verify culverts from open street-level imagery (the worksheet and links are already in the repository), and field-check the recommended ones with the Coimbra team.
- More streams. Any OpenStreetMap extract that passes the flow-direction check works, starting with the other OneAquaHealth research cities.
- Richer decisions. Species-specific passability, the cost of each visit, and planning several visits at once.
Code: https://github.com/Abdullah49645/thalweg · Live demo and video: linked on this page.
AI disclosure
We used Claude (Anthropic), mainly Claude Opus 5.5 and Claude Sonnet in earlier sessions, as an AI coding partner throughout the hackathon. Claude wrote most of the code and much of the technical writing: the README, the methodology and validation documents, and the first draft of this description. We set the project's direction, sourced and linked the real data and references (the OpenStreetMap extract for the Ribeira de Coselhas and the scientific literature), reviewed and tested the application, and recorded the voiceover. The running app contains no AI service or language model: every recommendation comes from the transparent statistical model described above.
Built With
- active-learning
- bayesian-inference
- claude
- css3
- geojson
- gibbs-sampling
- hl7-fhir
- html5
- machine-learning
- monte-carlo
- next.js
- node.js
- numpy
- openstreetmap
- overpass-api
- playwright
- python
- react
- svg
- typescript
- vercel


Log in or sign up for Devpost to join the conversation.