-
-
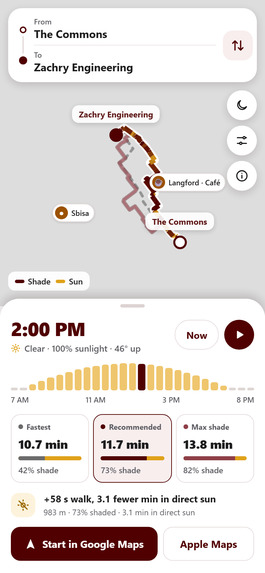
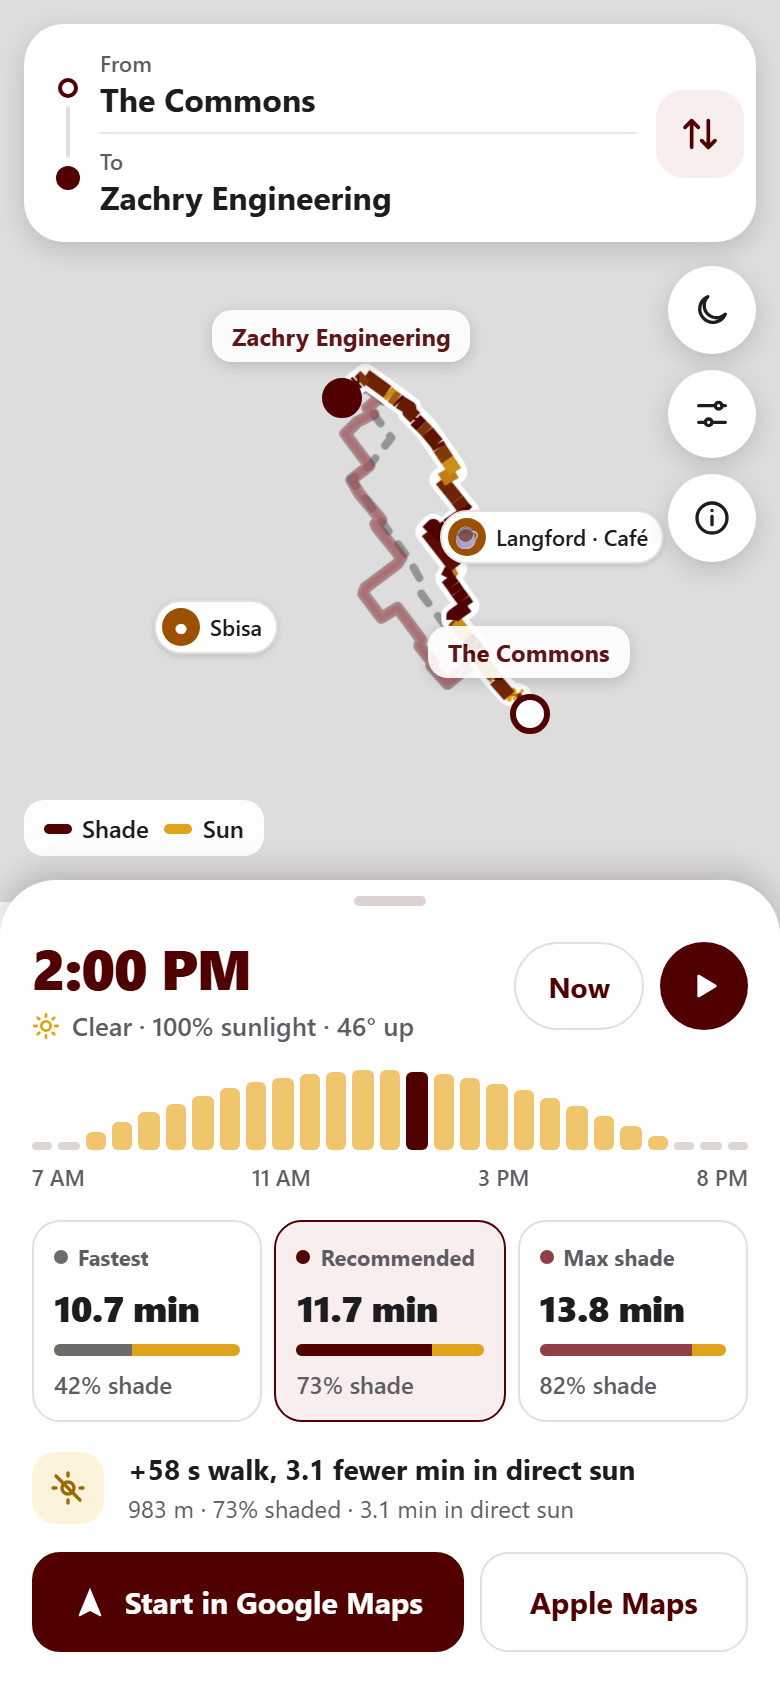
SunScreen Mobile App UI
-
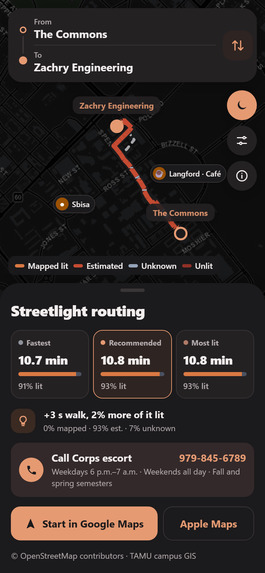
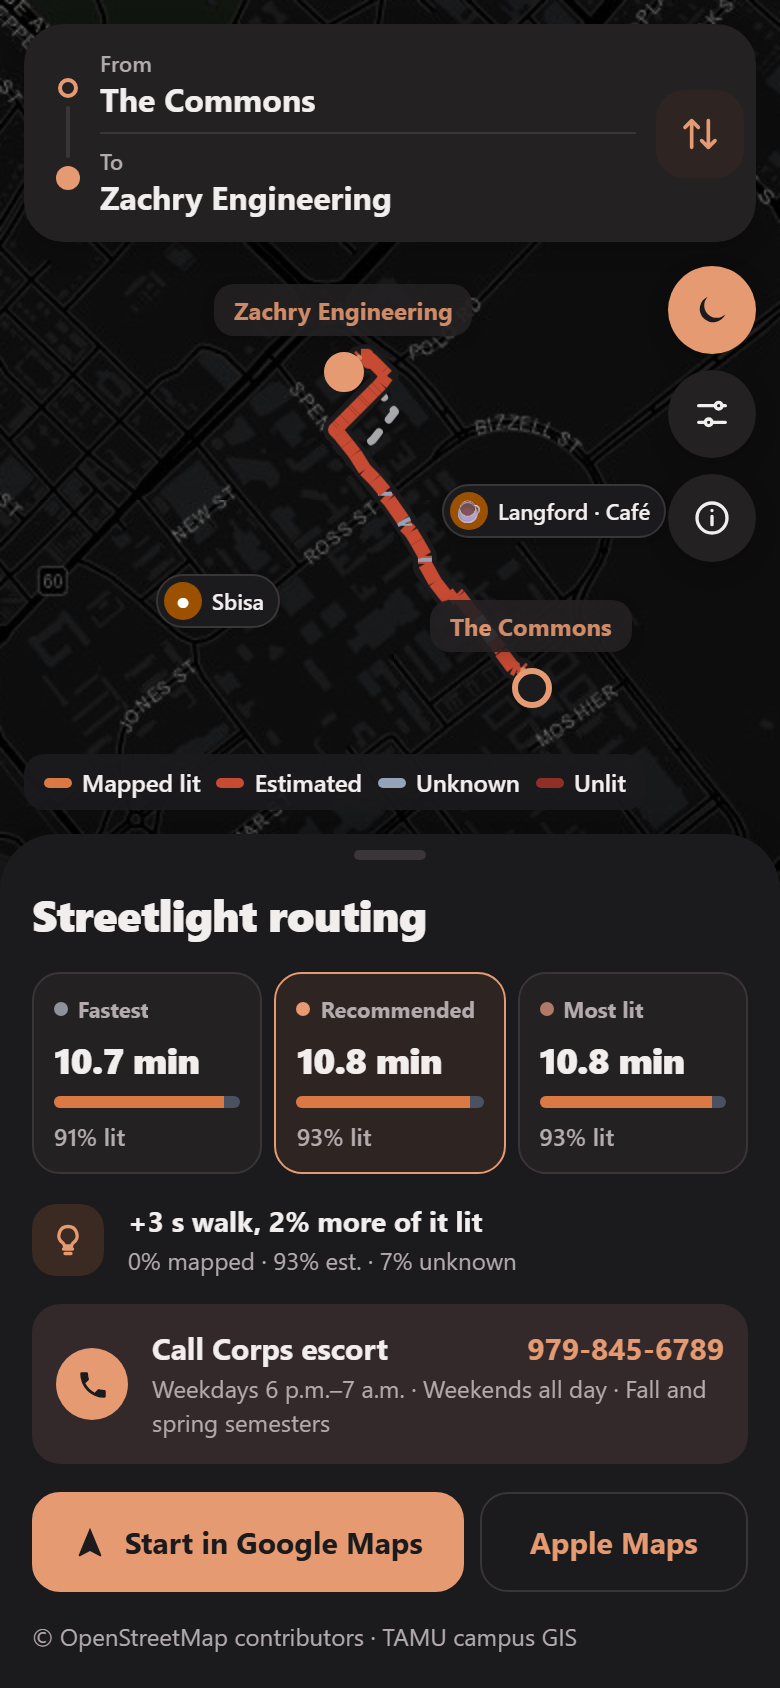
Streetlight Routing
-
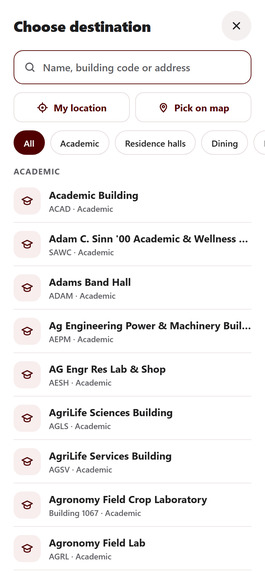
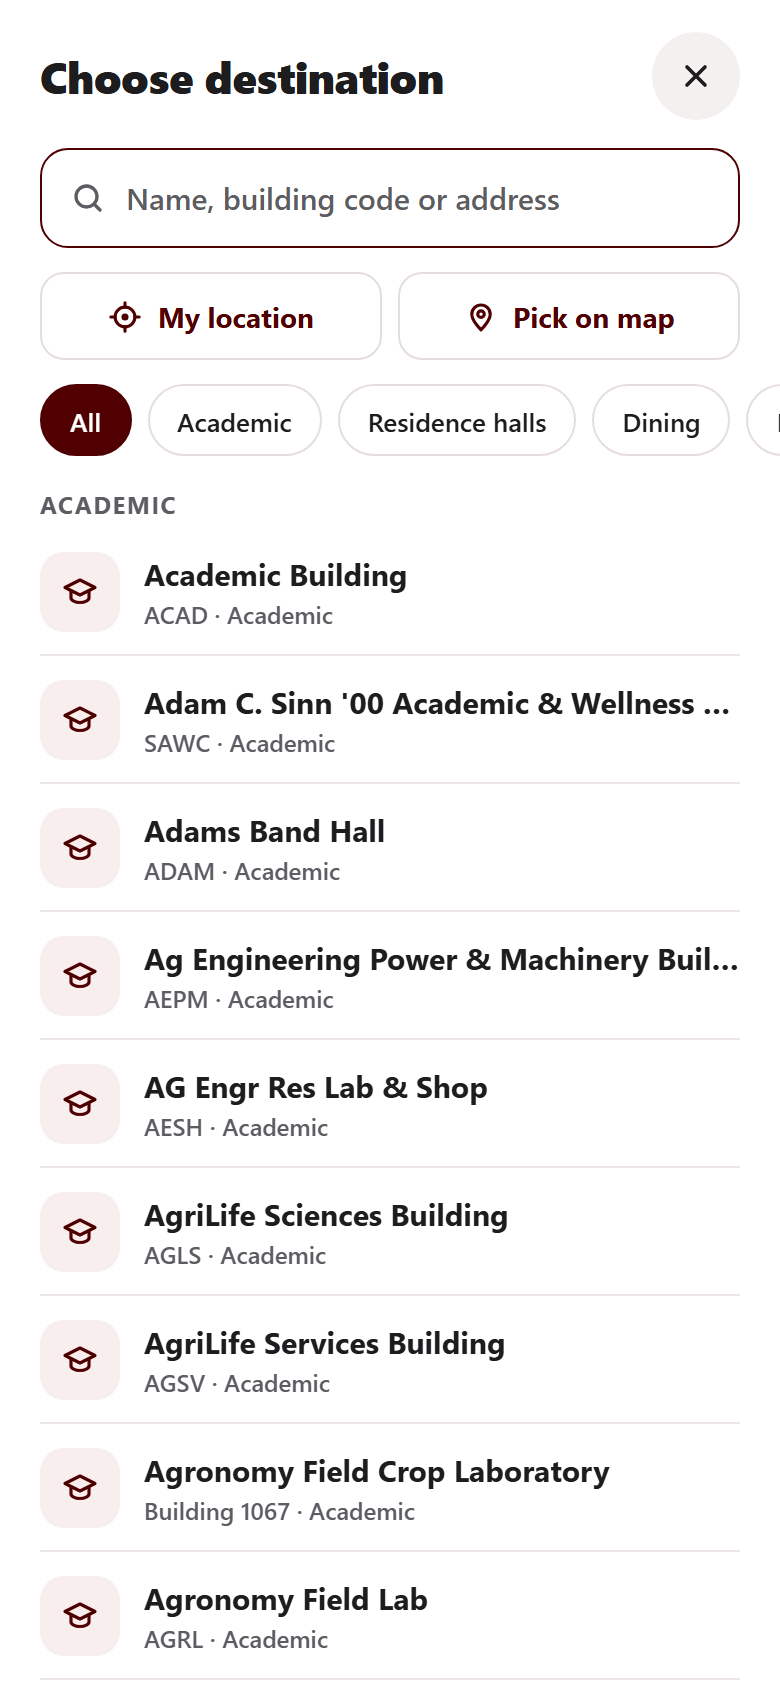
Destination Selection
-
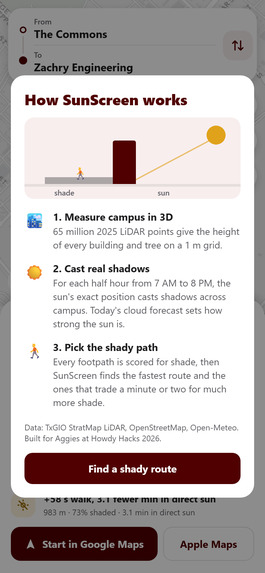
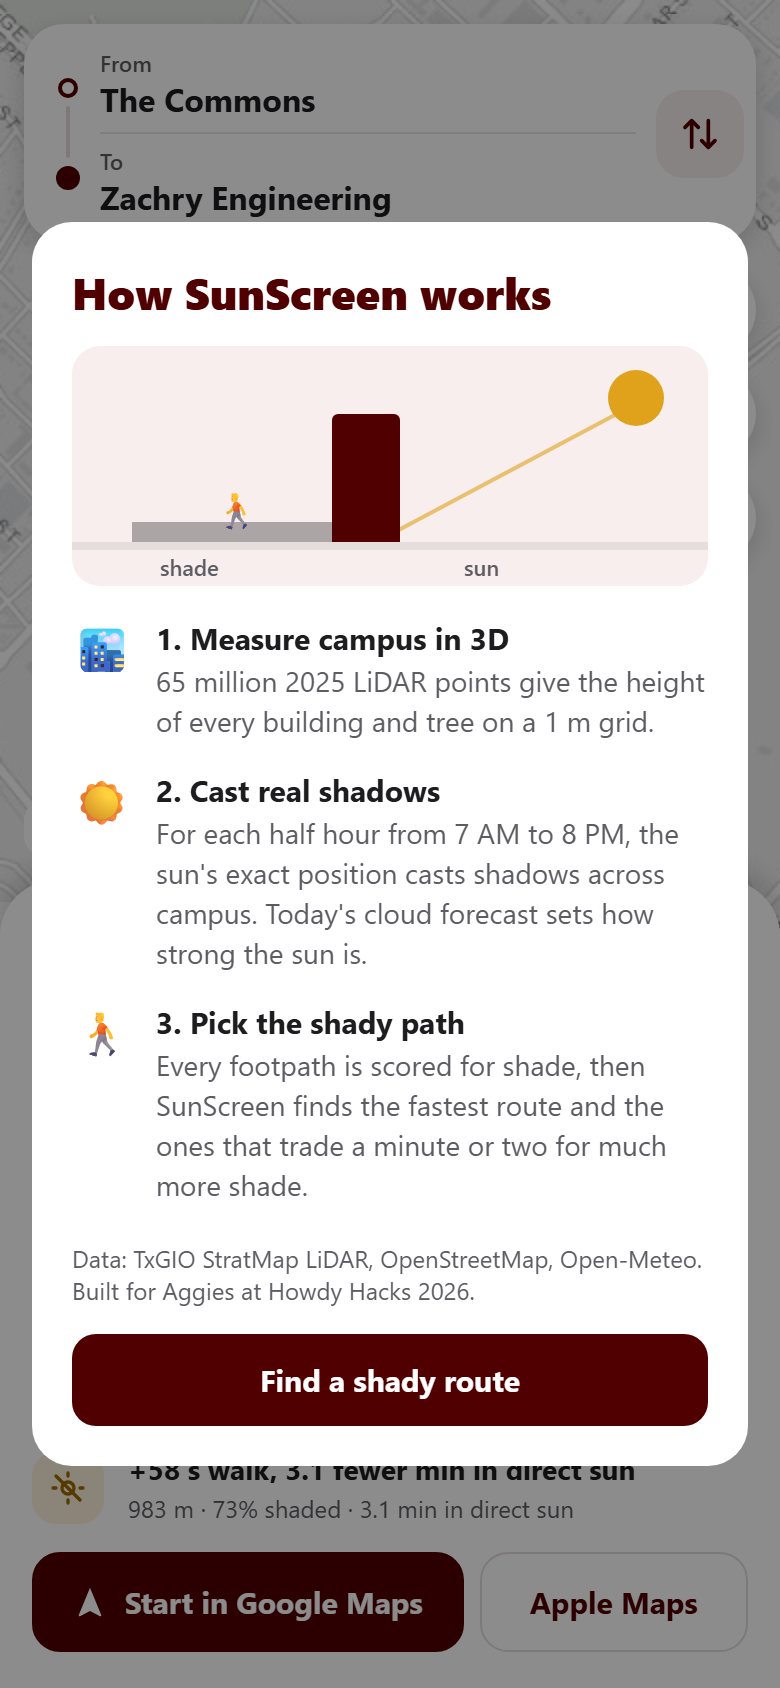
Info Page
-
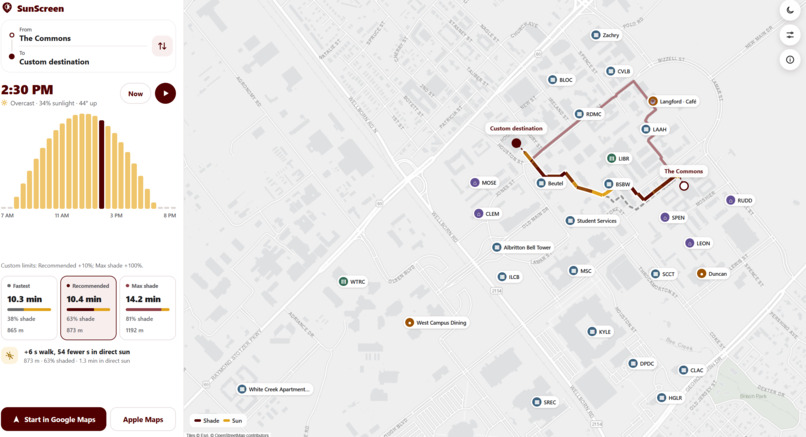
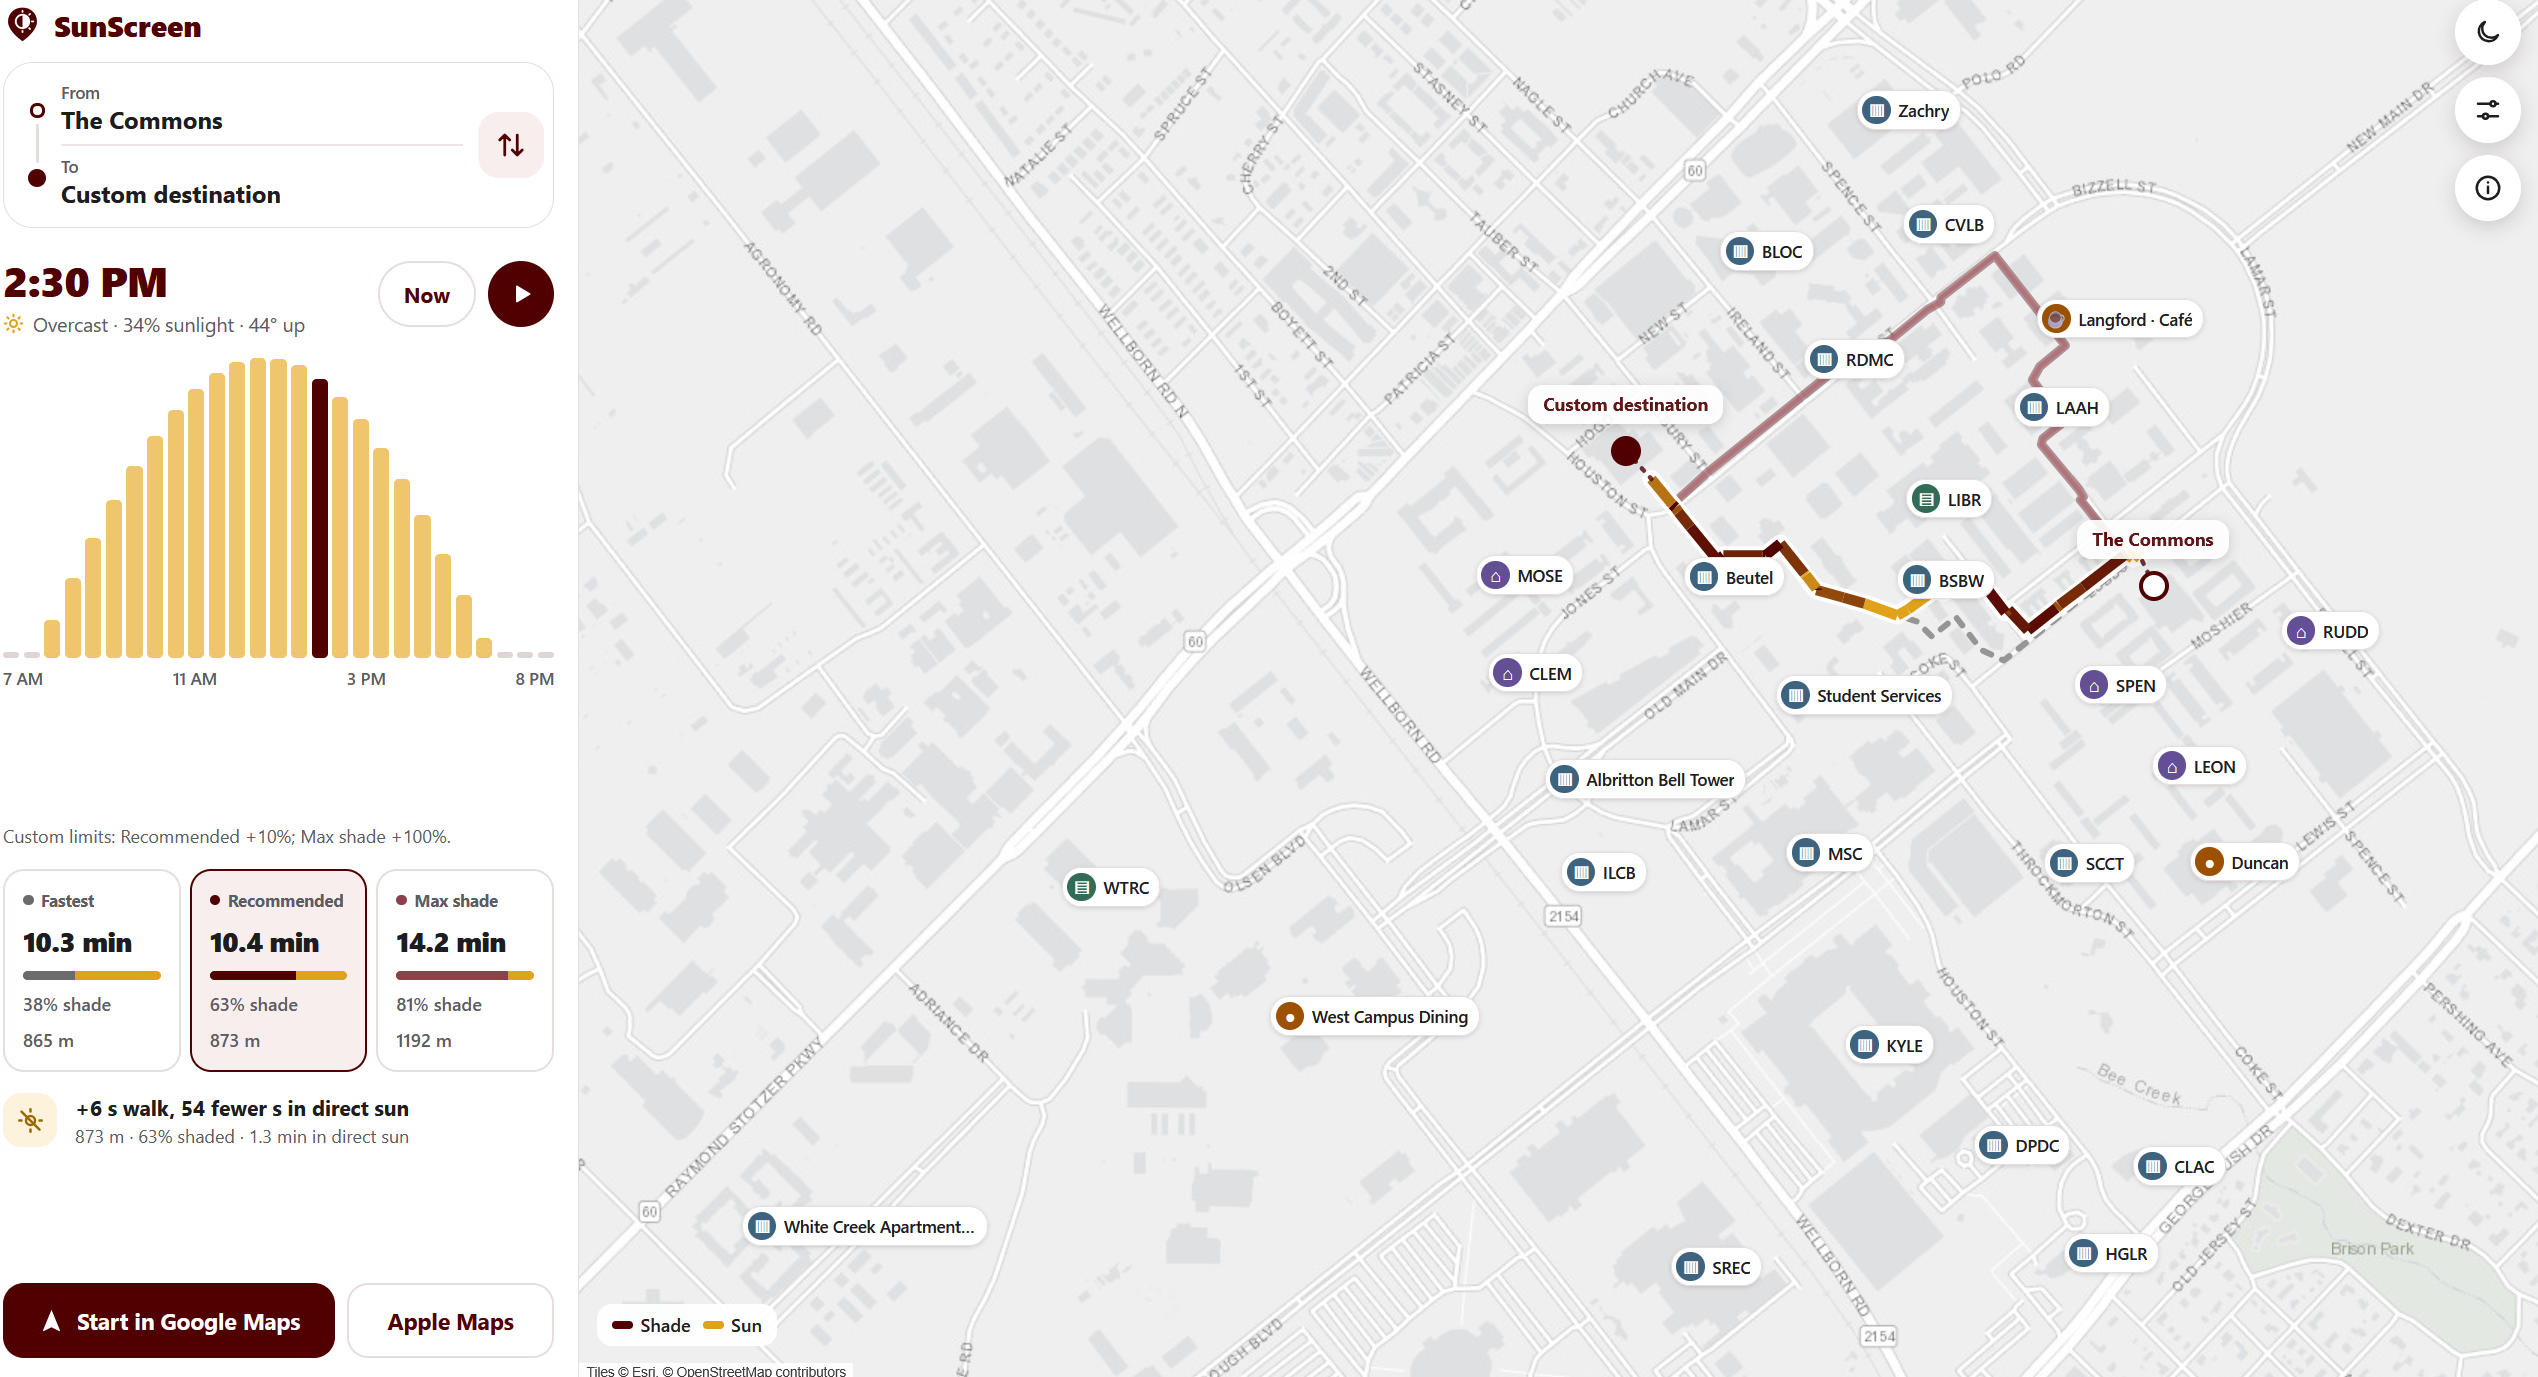
SunScreen Desktop App UI
-
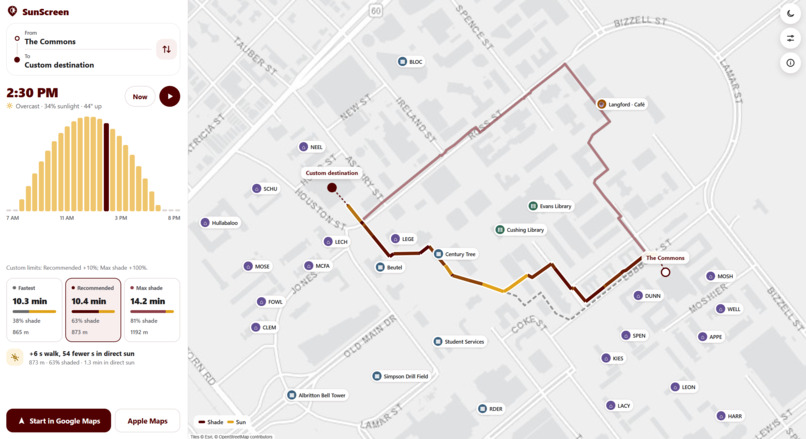
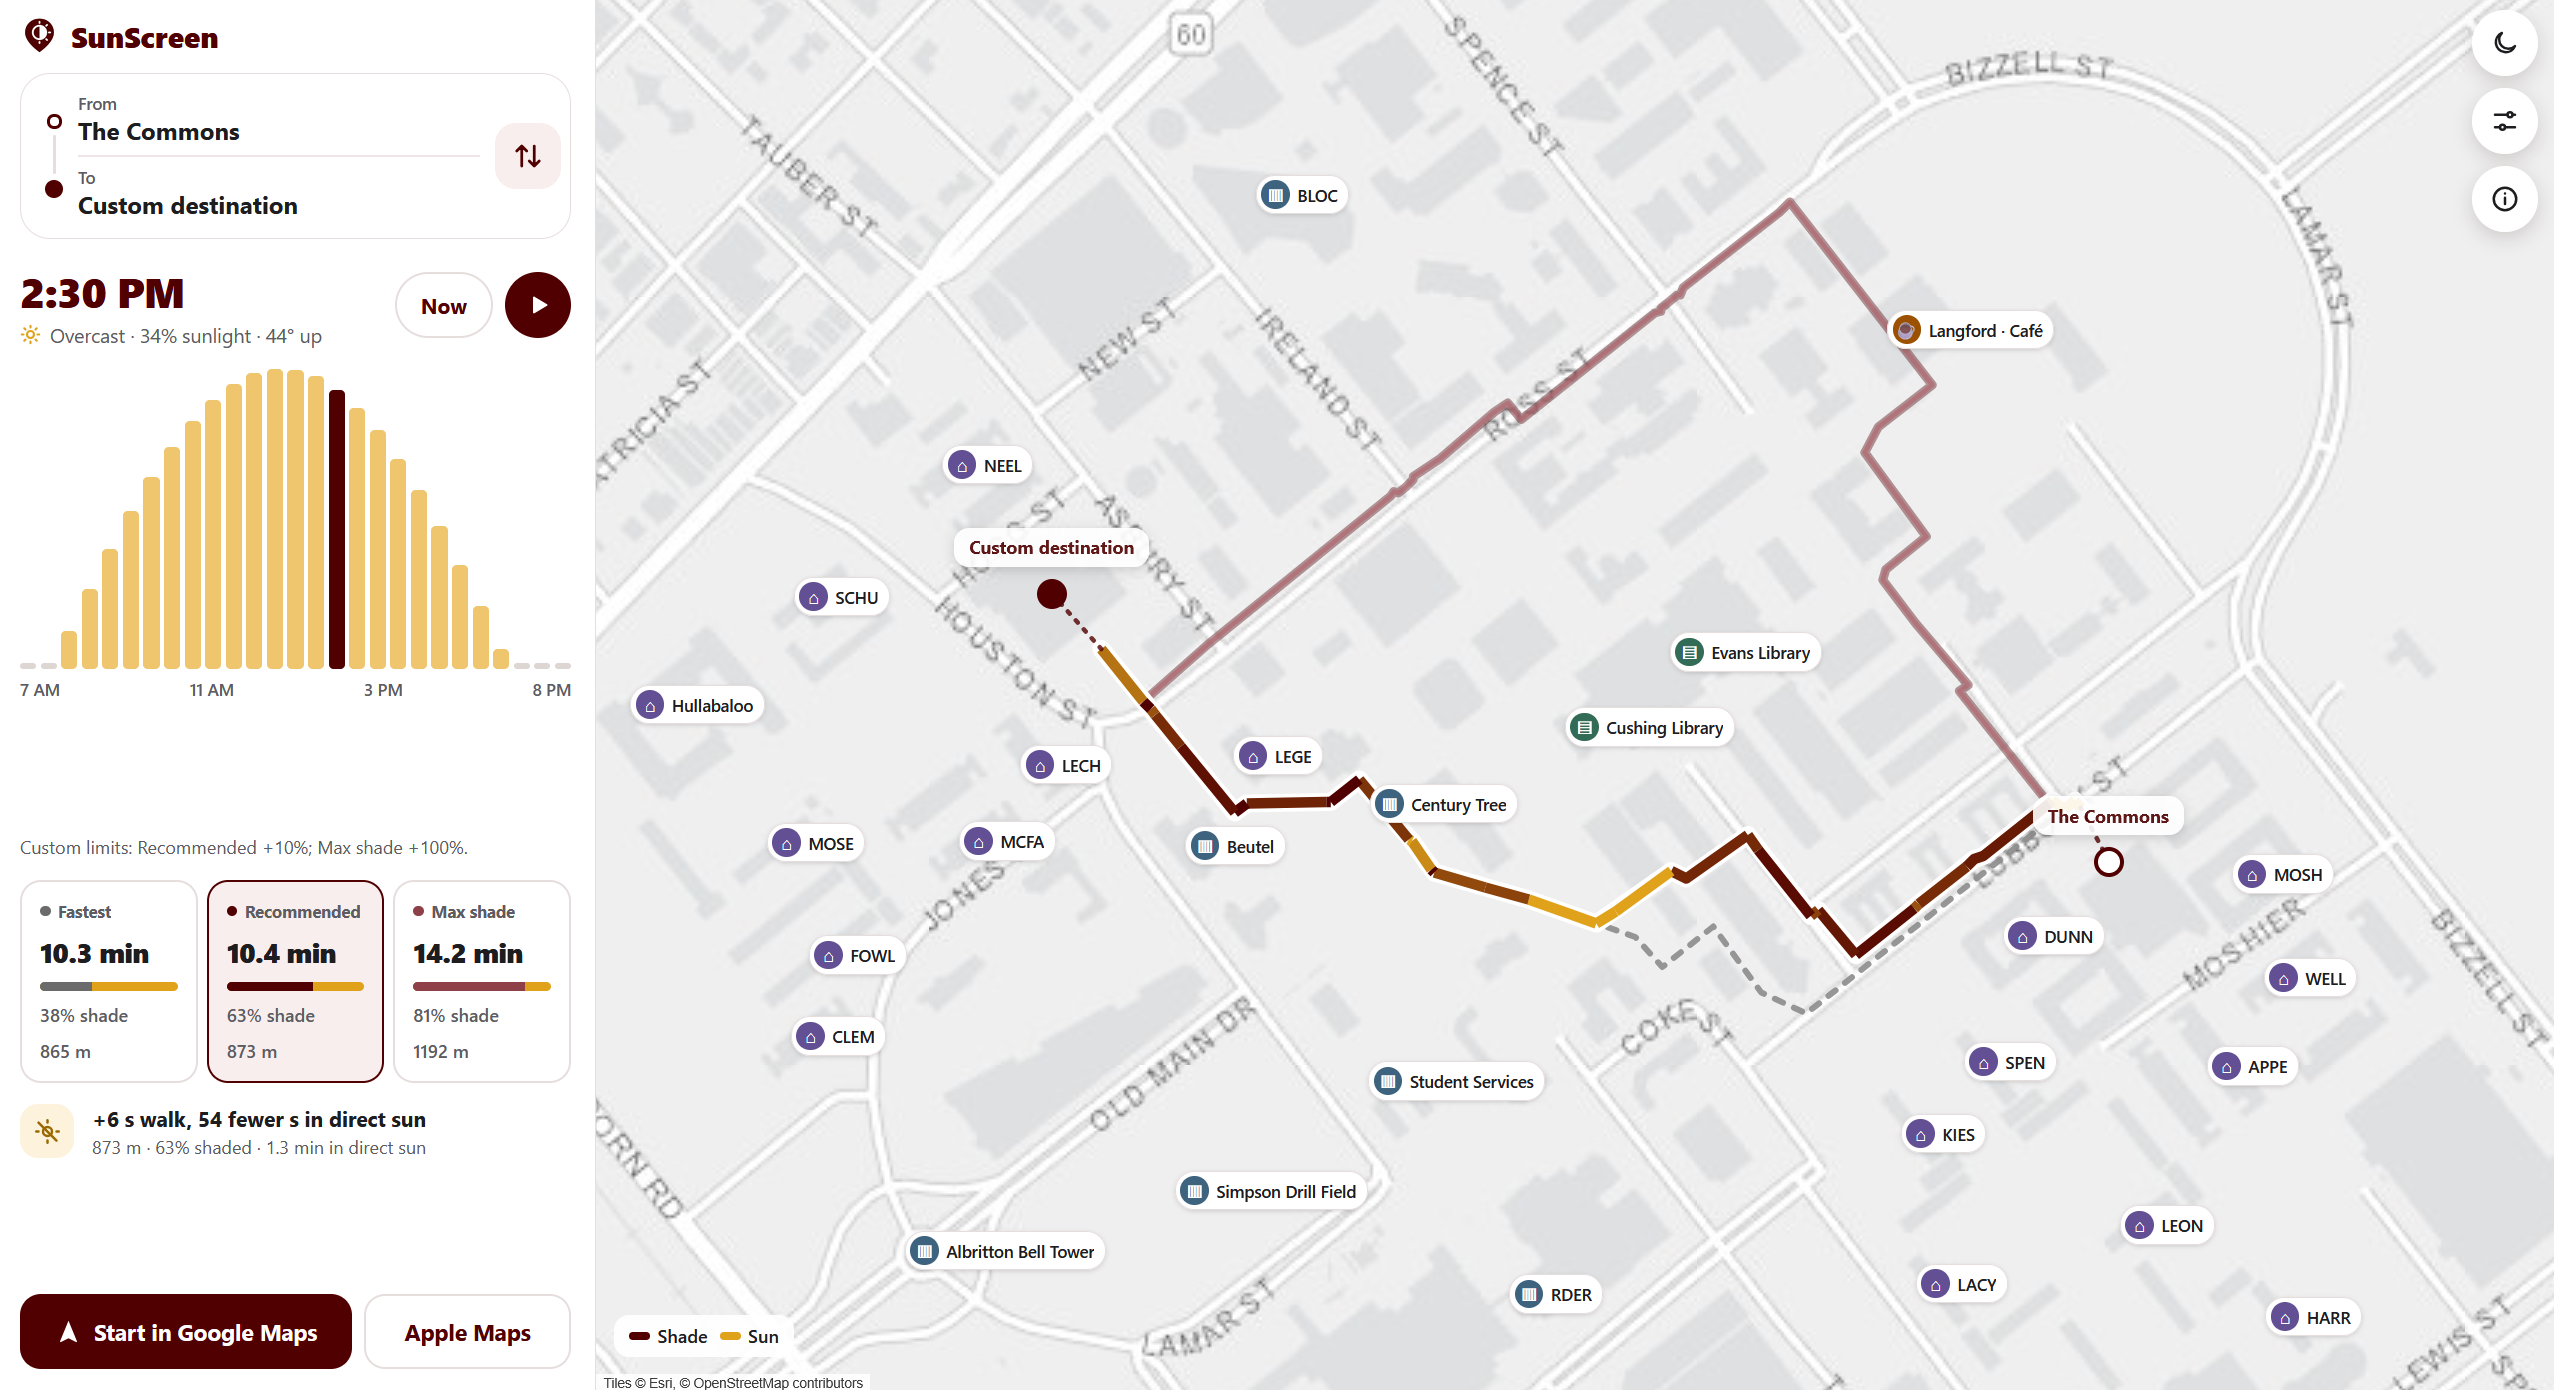
SunScreen Desktop App UI, Zoomed In
-
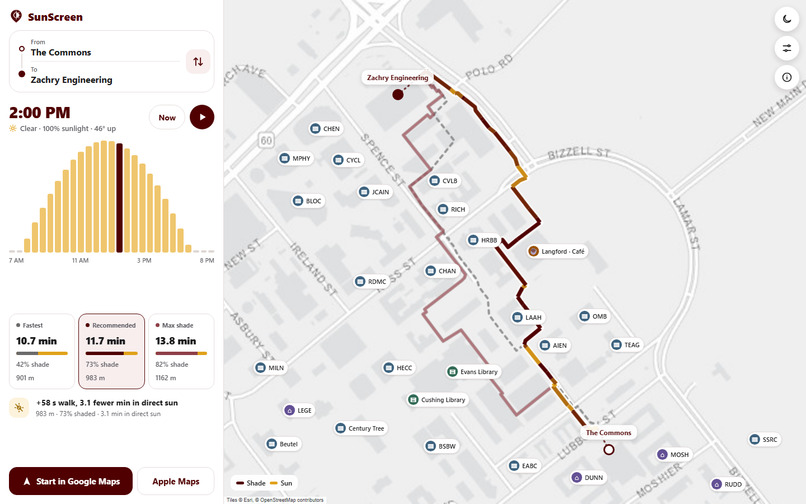
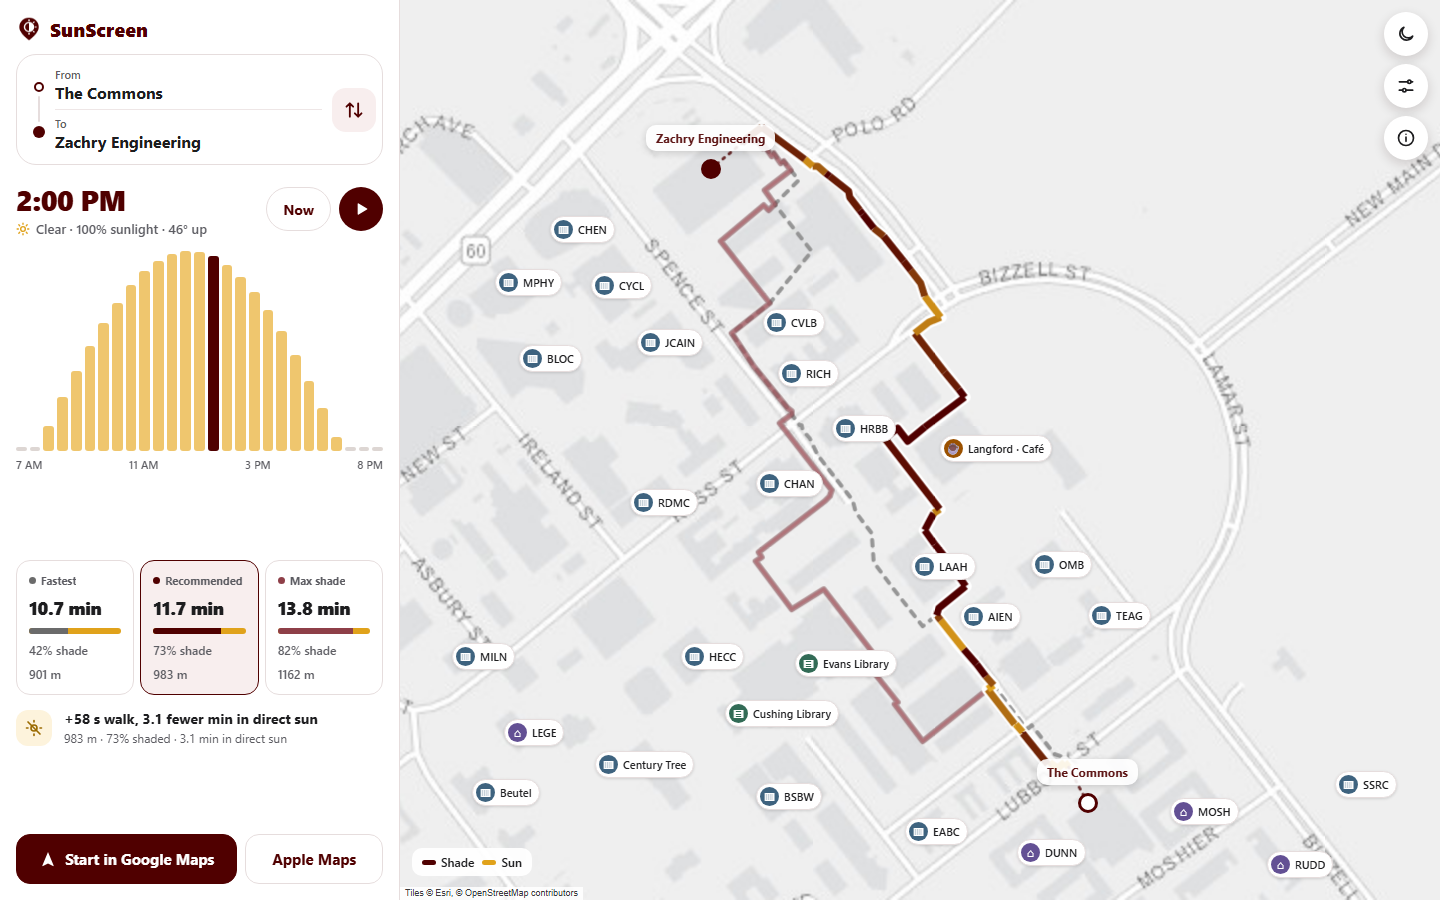
SunScreen Desktop App UI, Alternate Route
-
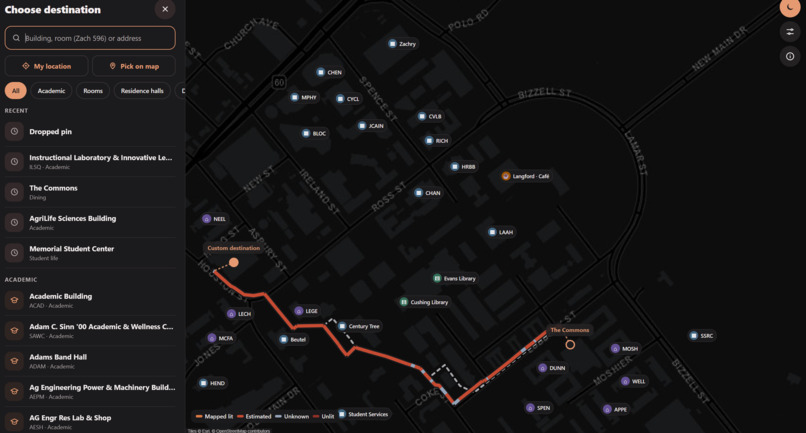
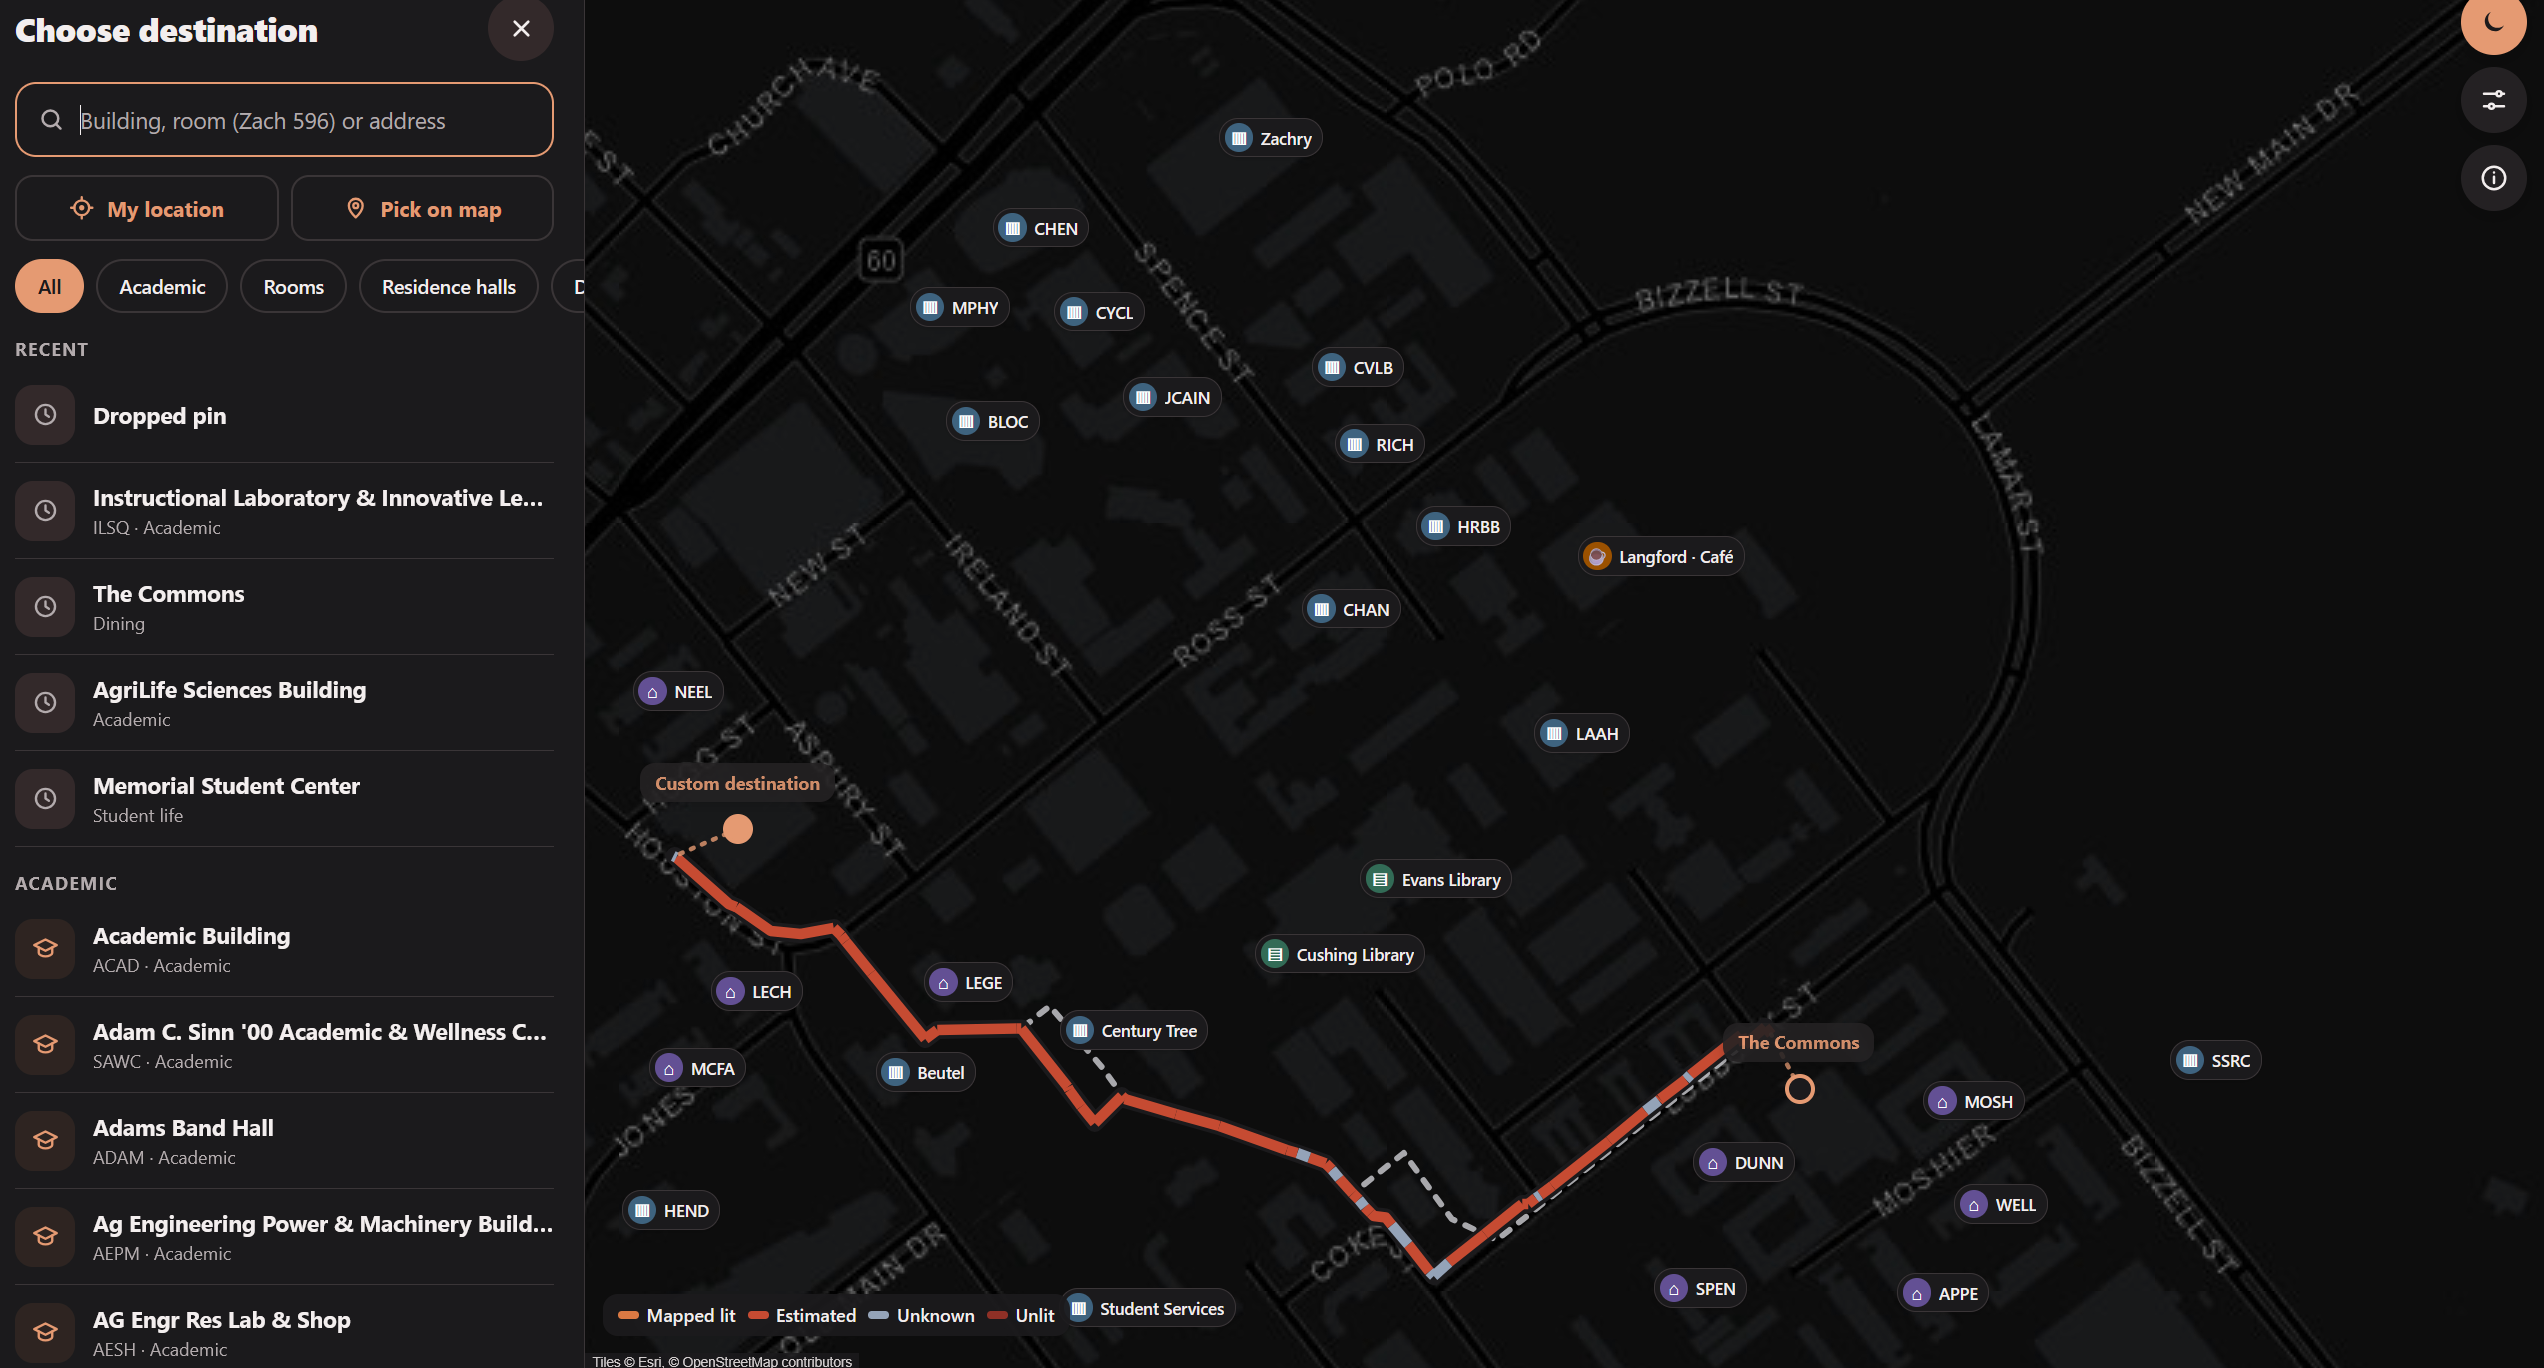
Desktop Streetlight Routing
Inspiration
For Amulya, one of our group members and someone with a chronic skin condition, the harsh sunlight was more than just an inconvenience. He tried desperately to find shade along the path, but unfortunately our campus doesn’t seem to be too generous with that. Over the next few days, he slowly learned the shortcuts and paths that would help me minimize my time in the sun: cutting through the Biology building and MSC, walking under the trees in front of Sbisa. And that’s what inspired us today. Instead of lathering on layers and layers of sunscreen, we created an app.
Additionally, we realized that this same pathfinding principle could be applied to scenarios at night; albeit replacing the azimuthal sun data with radial streetlight data that allows routes to be measured by their lightness instead of their darkness.
We also realized that we took shortcuts through buildings a lot, and this could be implemented in an app–Google Maps doesn’t even let us do that!
What it does
Firstly, our app uses Dijkstra’s algorithm to create a path from point a to point b using a map. Then, during the day, it calculates the shade on the path to get a quantified percentage for each path. The optimal path is considered to be the one that maximizes both speed and shade. In night mode, it calculates proximity to streetlights to get a path that maximizes both speed and light.
The app as a whole pulls from many sources of data, taking into account the heights of buildings, time of day, current weather, locations of streetlights, general location of buildings, and more.
This optimal path may hopefully allow people to get to their classes as fast as possible while also minimizing heat and radiation from the sun. This is notable for a lot of people who have sensitive skin or who may simply seek to stay out of the sun. At night, it encourages safety, allowing people to easily see which paths are illuminated.
How we built it
We built it to have basic functionality of calculating the shade of a path we know to be quite common, specifically, from the Commons to Zach. Once we knew this worked, we extrapolated it using more data to apply to all of campus.
We then gradually added more features, such as being able to set location, go through buildings, and even directly move our starting pins (not mobile functional). This was how the project expanded into its current state.
We also upgraded the UI from using Javascript to using Figma, allowing the user to get a more pleasant experience as they reap the benefits of the app. The new app UI is more pleasant, is both web- and mobile- capable, and displays all of the information we need.
Challenges we ran into
One challenge we ran into was the sheer lack of public data for much of the things we tried to track. There was so little data for streetlights that we had to rely on an utterly incomplete dataset of lights. This means that there is little room for error in making path based predictions, and it is quite hard to even completely verify that a path is available.
One other challenge we ran into was how to test the app and its use in real life. It is difficult to test every single route between every two buildings. As such, we have often, in the past day, traveled from the commons to zach to test the efficacy of our methods.
Generally, it has been difficult but fulfilling to implement something like this, because it displays something that everyone deals with, but that few people will ever get to experience a modern solution to. It is hard to gather data on shade because it is affected mostly by the sun’s interaction with buildings, and building data can often be obscured.
Accomplishments that we're proud of
One was definitely finally finding a method of data collection that let us go through with out initial headcanon. Before we landed on building data, we brainstormed and went through a few failed attempts of using satellite data to get average shade, which we realized would not really apply to our project.
Later, it also took a long time to find suitable datasets for floor plans for buildings. We only really found publicly available data that was extensive enough to use for Zachry, so it is the only working building in our demo, but if we were to obtain data for other buildings, it wouldn’t be hard to implement them in at all.
Finally, porting our hosted website to an app was an extremely long ordeal, requiring use of a Google Maps API key that was extremely difficult to get, and many different instances of troubleshooting that involved Jayin hacking into his phone. However, it was really fulfilling when we were able to use our project as a downloadable app!
What we learned
We have all learned a lot about extracting information from the internet, and how hard it can often be. Additionally, we have all learned about how to use the Google Maps API and how extensive map and geographic information is needed to make a map like it.
Additionally, we have learned about the ways in which geographical information is processed by path calculators such as dijkstra, which we implemented in various Data Structures and Algorithms classes but have never really used for anything outside of theoretical applications. Aside from that, we learned how to use Figma and node.js.
What's next for SunScreen
There’s still so much we can add. There is still the aforementioned idea of giving people directions inside of buildings using floor plans, which could use a lot more web scraping and even path algorithms.
One of us had the idea to add in functionality for people who want to use the bus to get around as well. This would require getting bus data (which actually seems readily available for once) and using it to form new, time-sensitive routes.
We could also try adding bike racks for locations, drawing in bikers, or take into account season of the year to further inform whether a student should take a certain path. Really, there is so much more we could add, because there is always something that would make transportation around A&M marginally easier. There is a bright future, then for the life of our app.
Built With
- android
- dijkstra
- expo.io
- fastapi
- figma
- geojson
- geospatial-analysis
- gis
- javascript
- leaflet.js
- lidar
- openstreetmap
- pathfinding
- python
- react-native
- solar-position-modeling
- vercel


Log in or sign up for Devpost to join the conversation.