
Inspiration
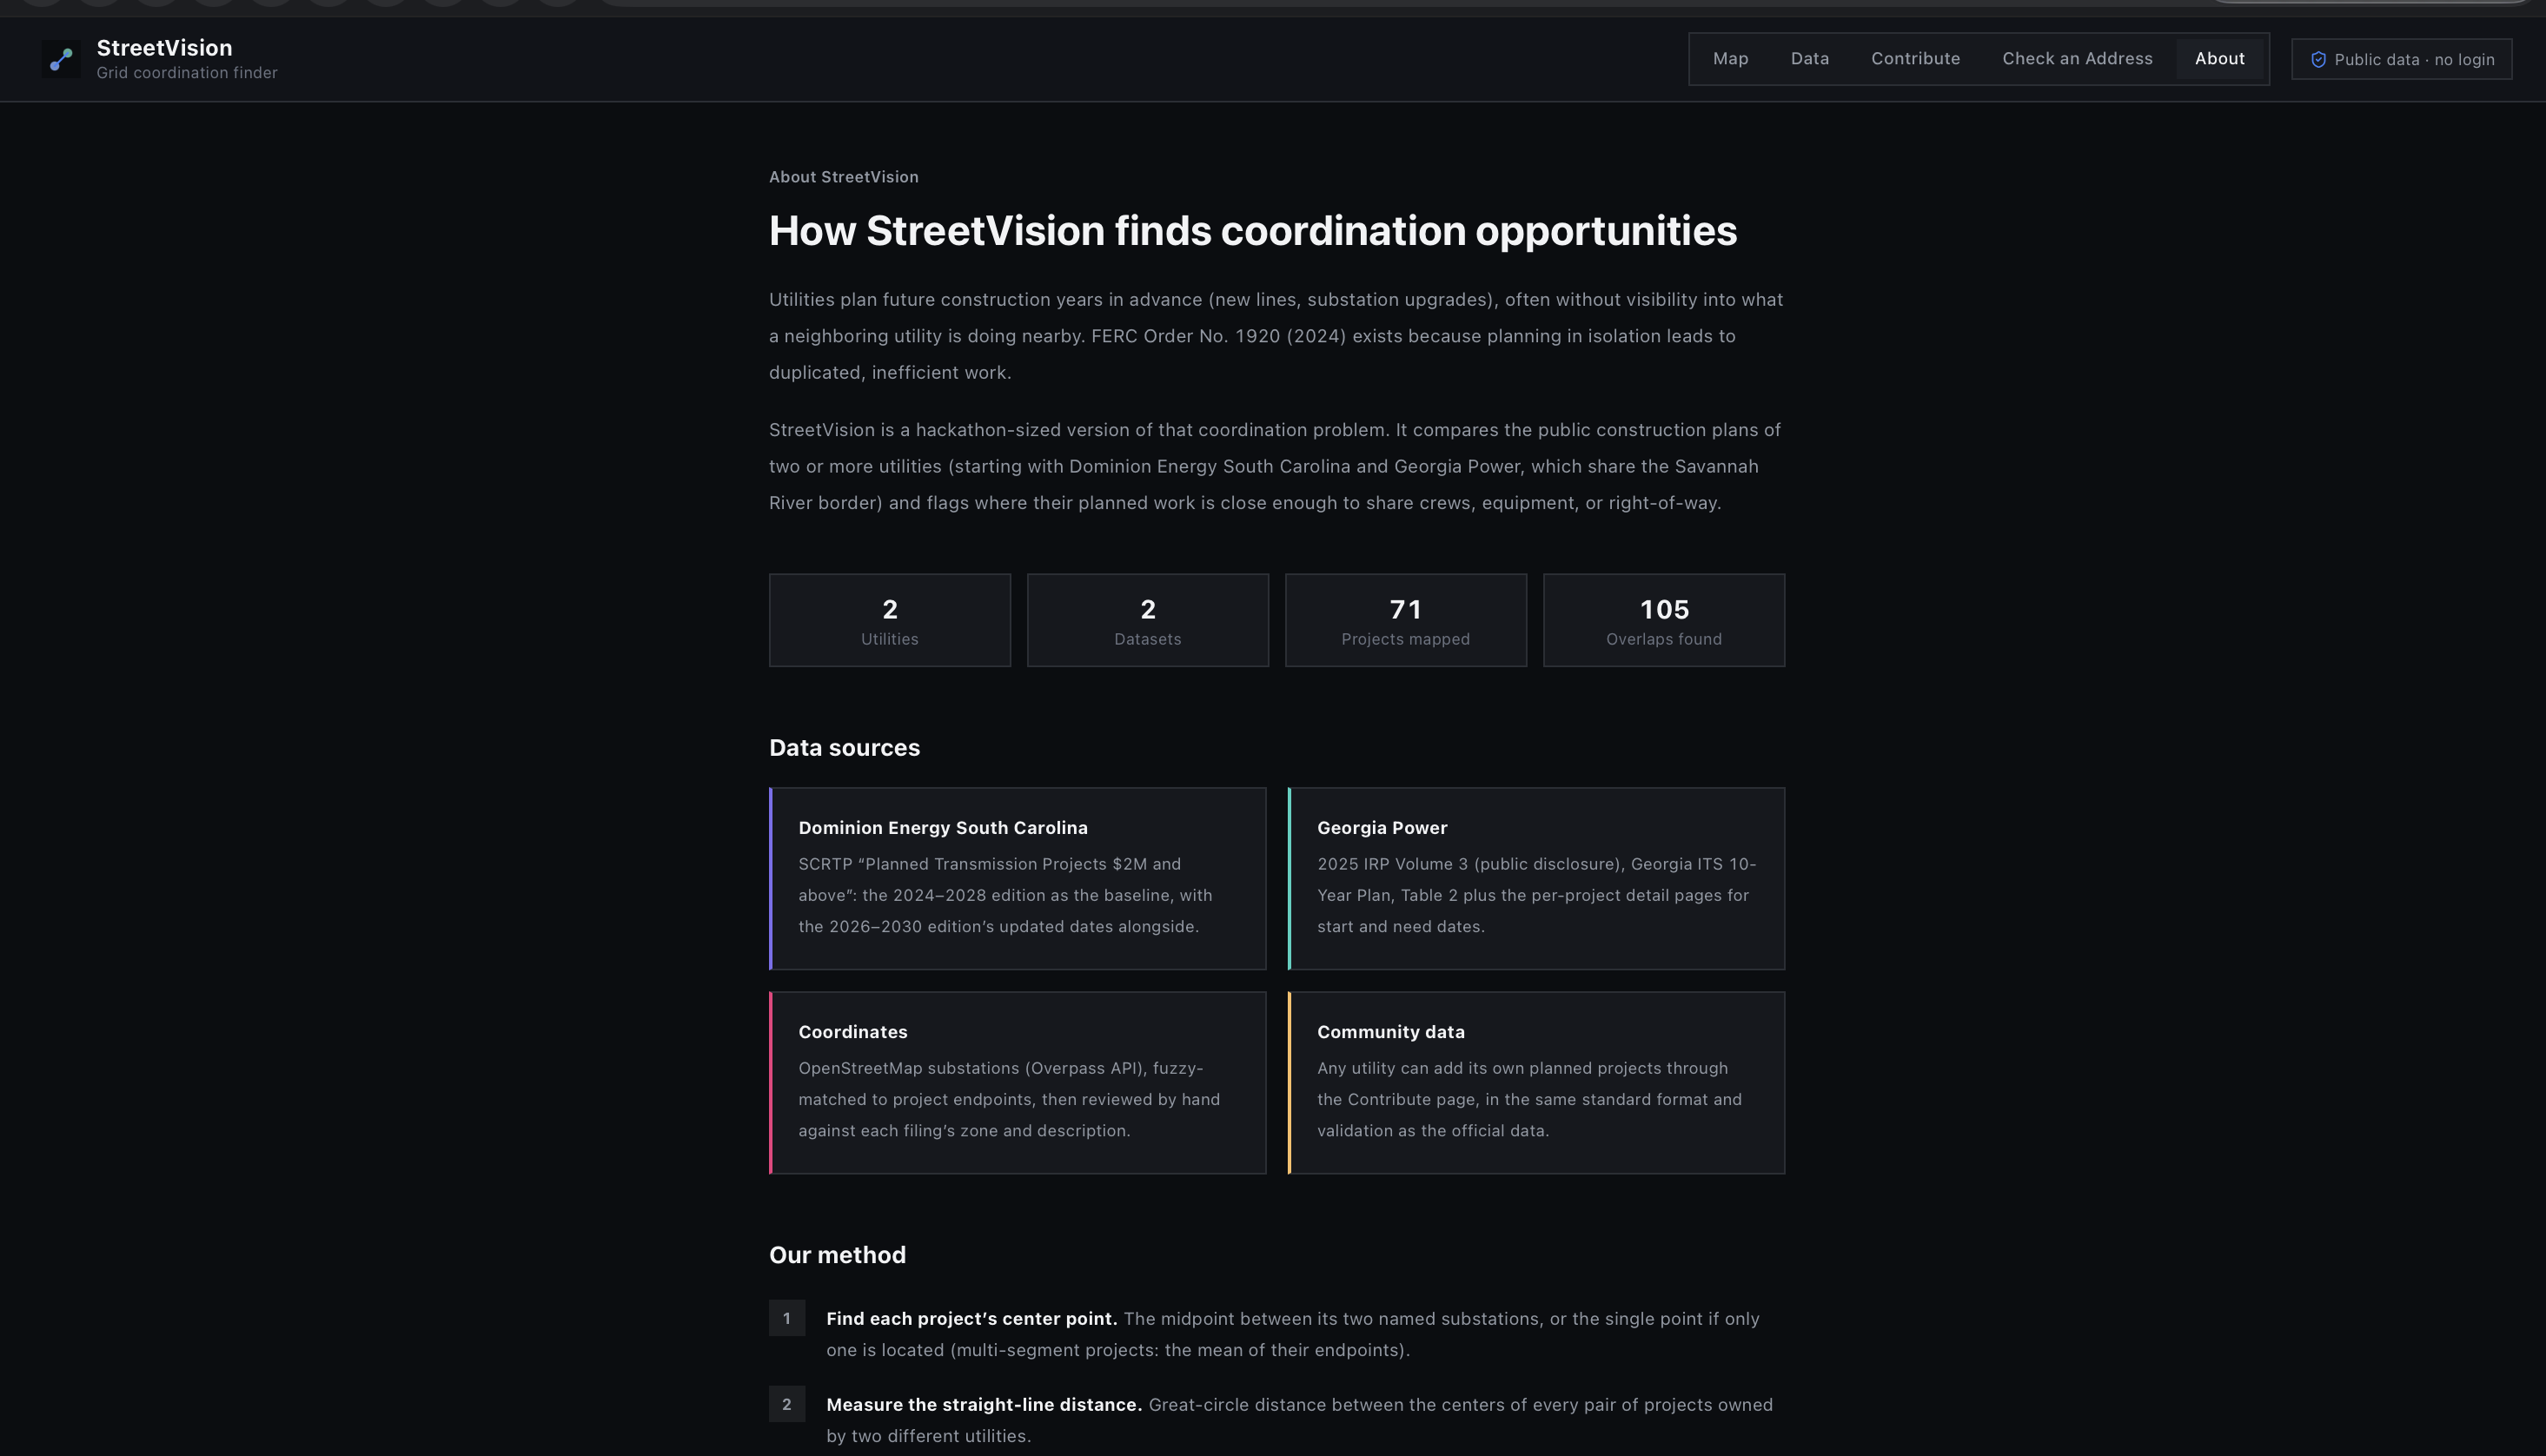
Neighboring utilities plan transmission lines separately, even when their projects end up close together and on similar timelines. That means each one buys its own right-of-way and pays for duplicate work. New federal rules (FERC Order No. 1920) push utilities to plan together, but their plans are buried in long PDF filings. We wanted an easy way to spot where two utilities should be coordinating.
What it does
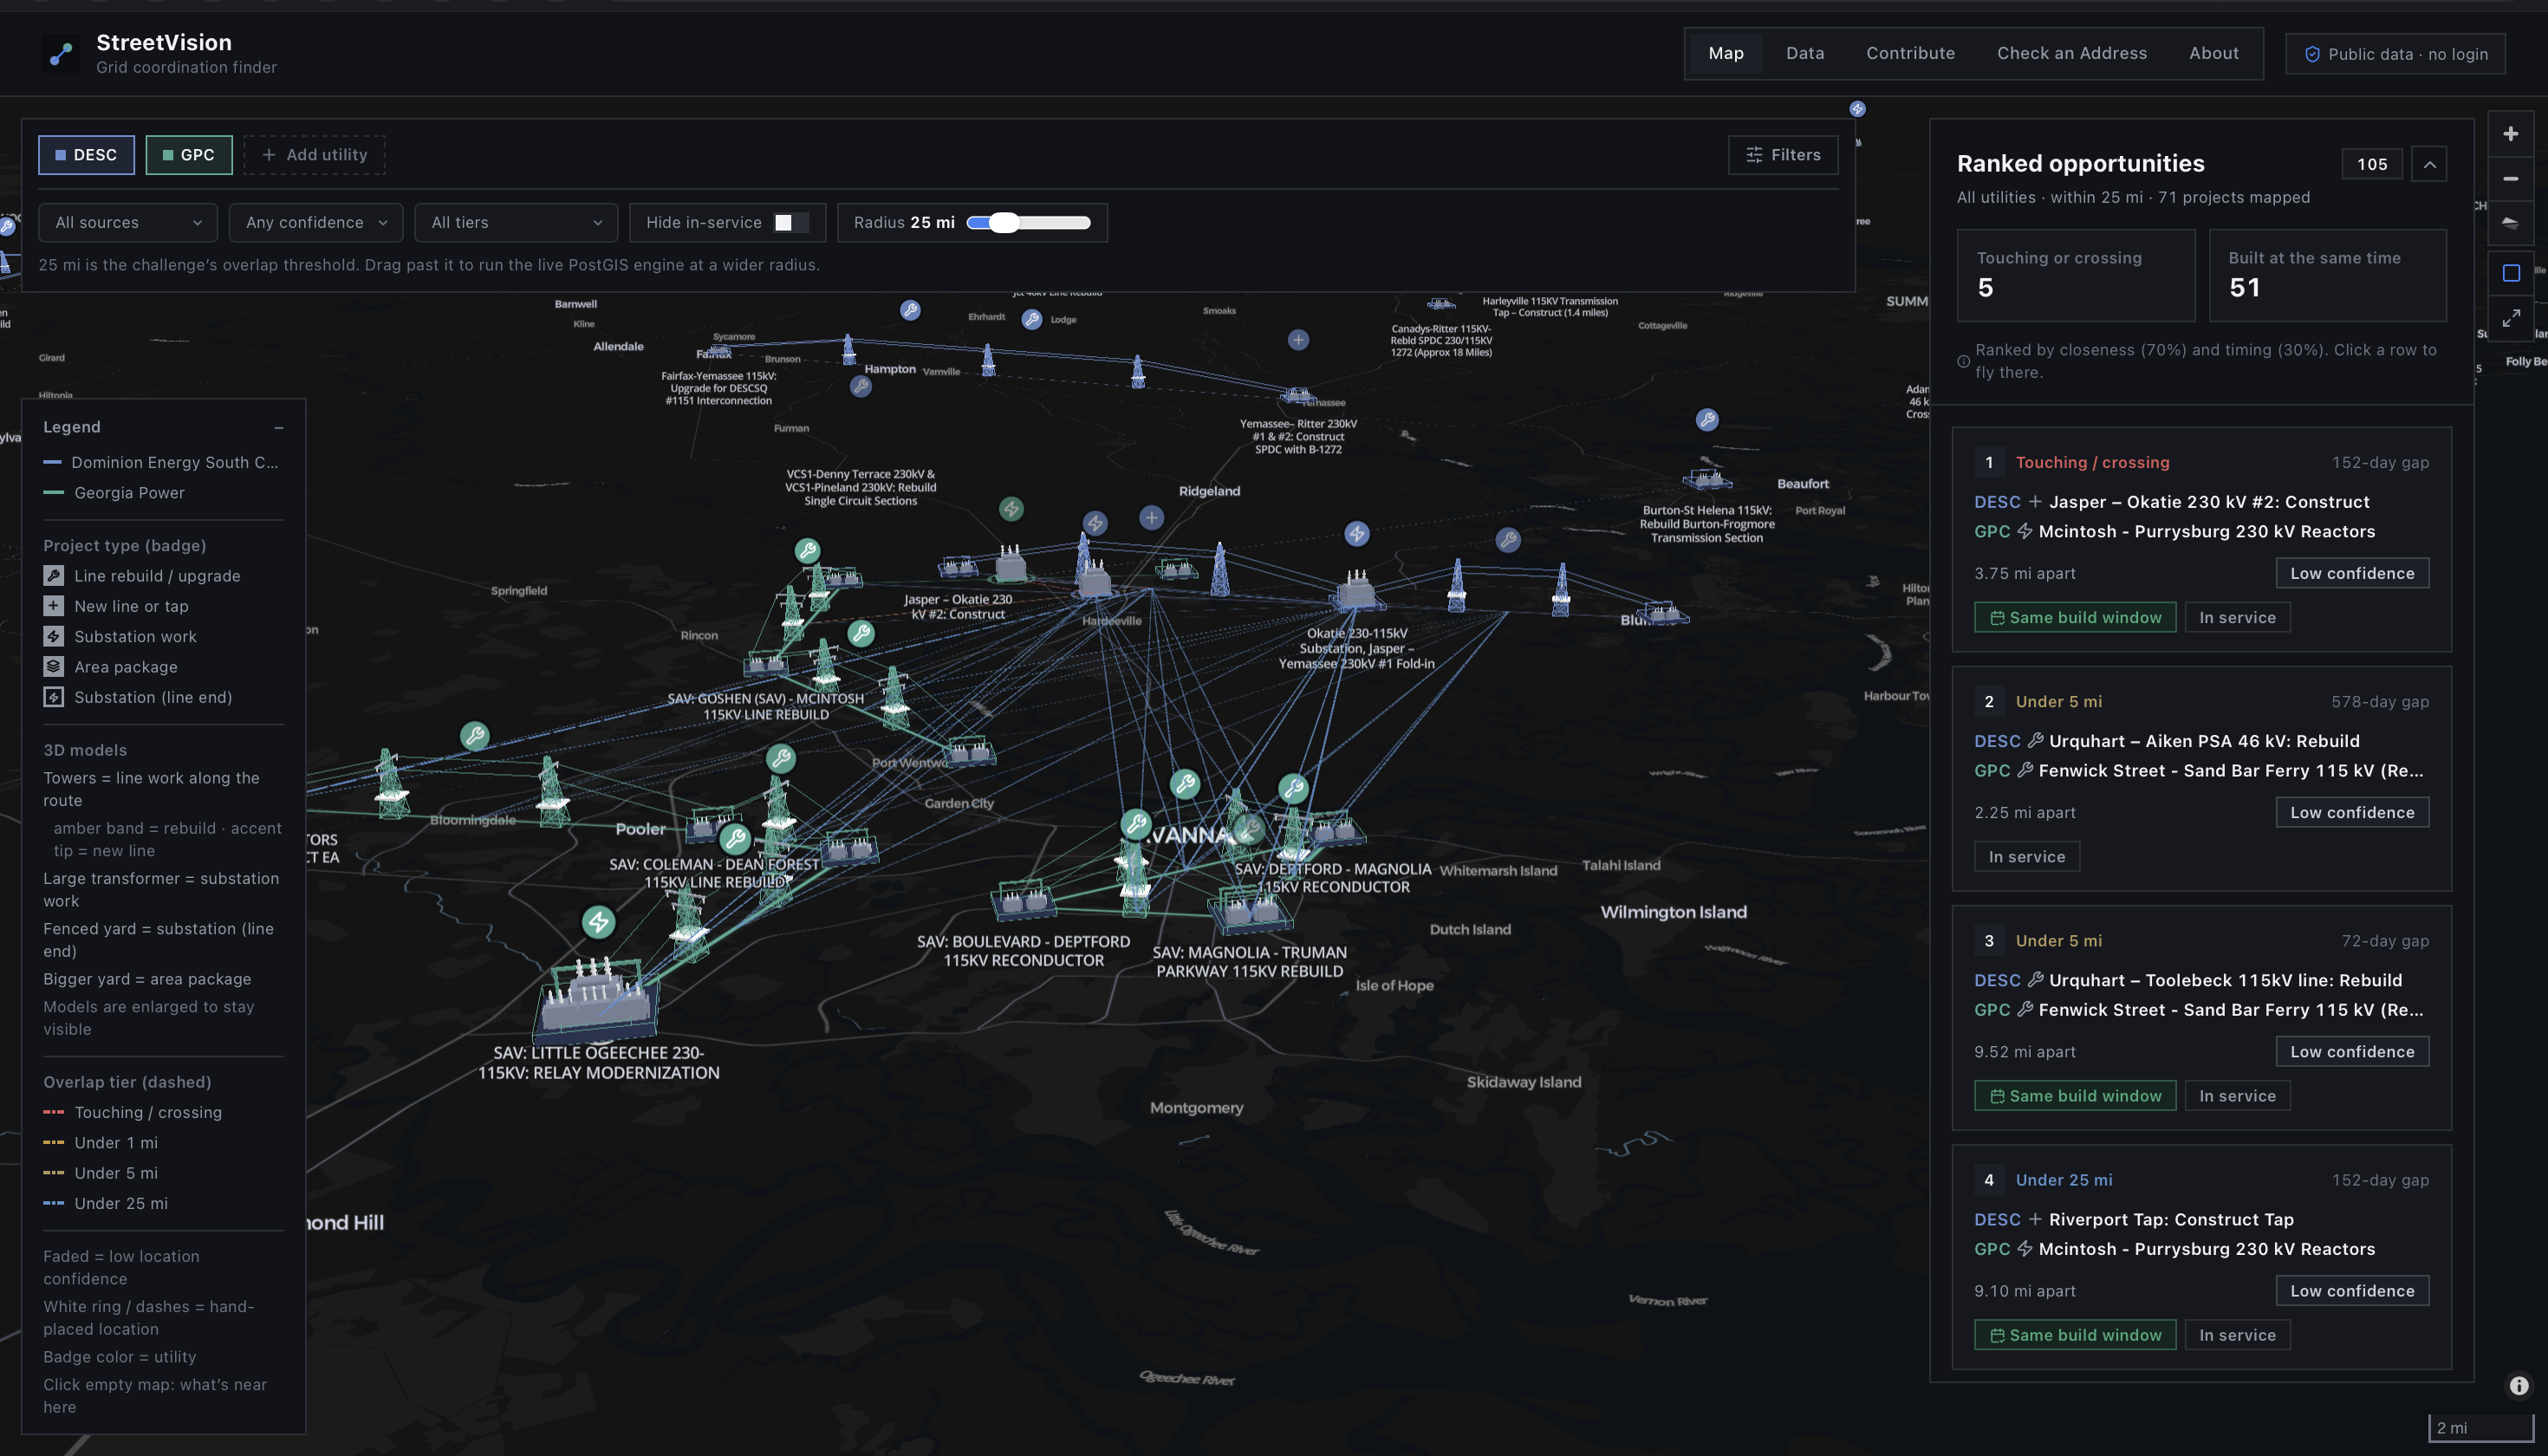
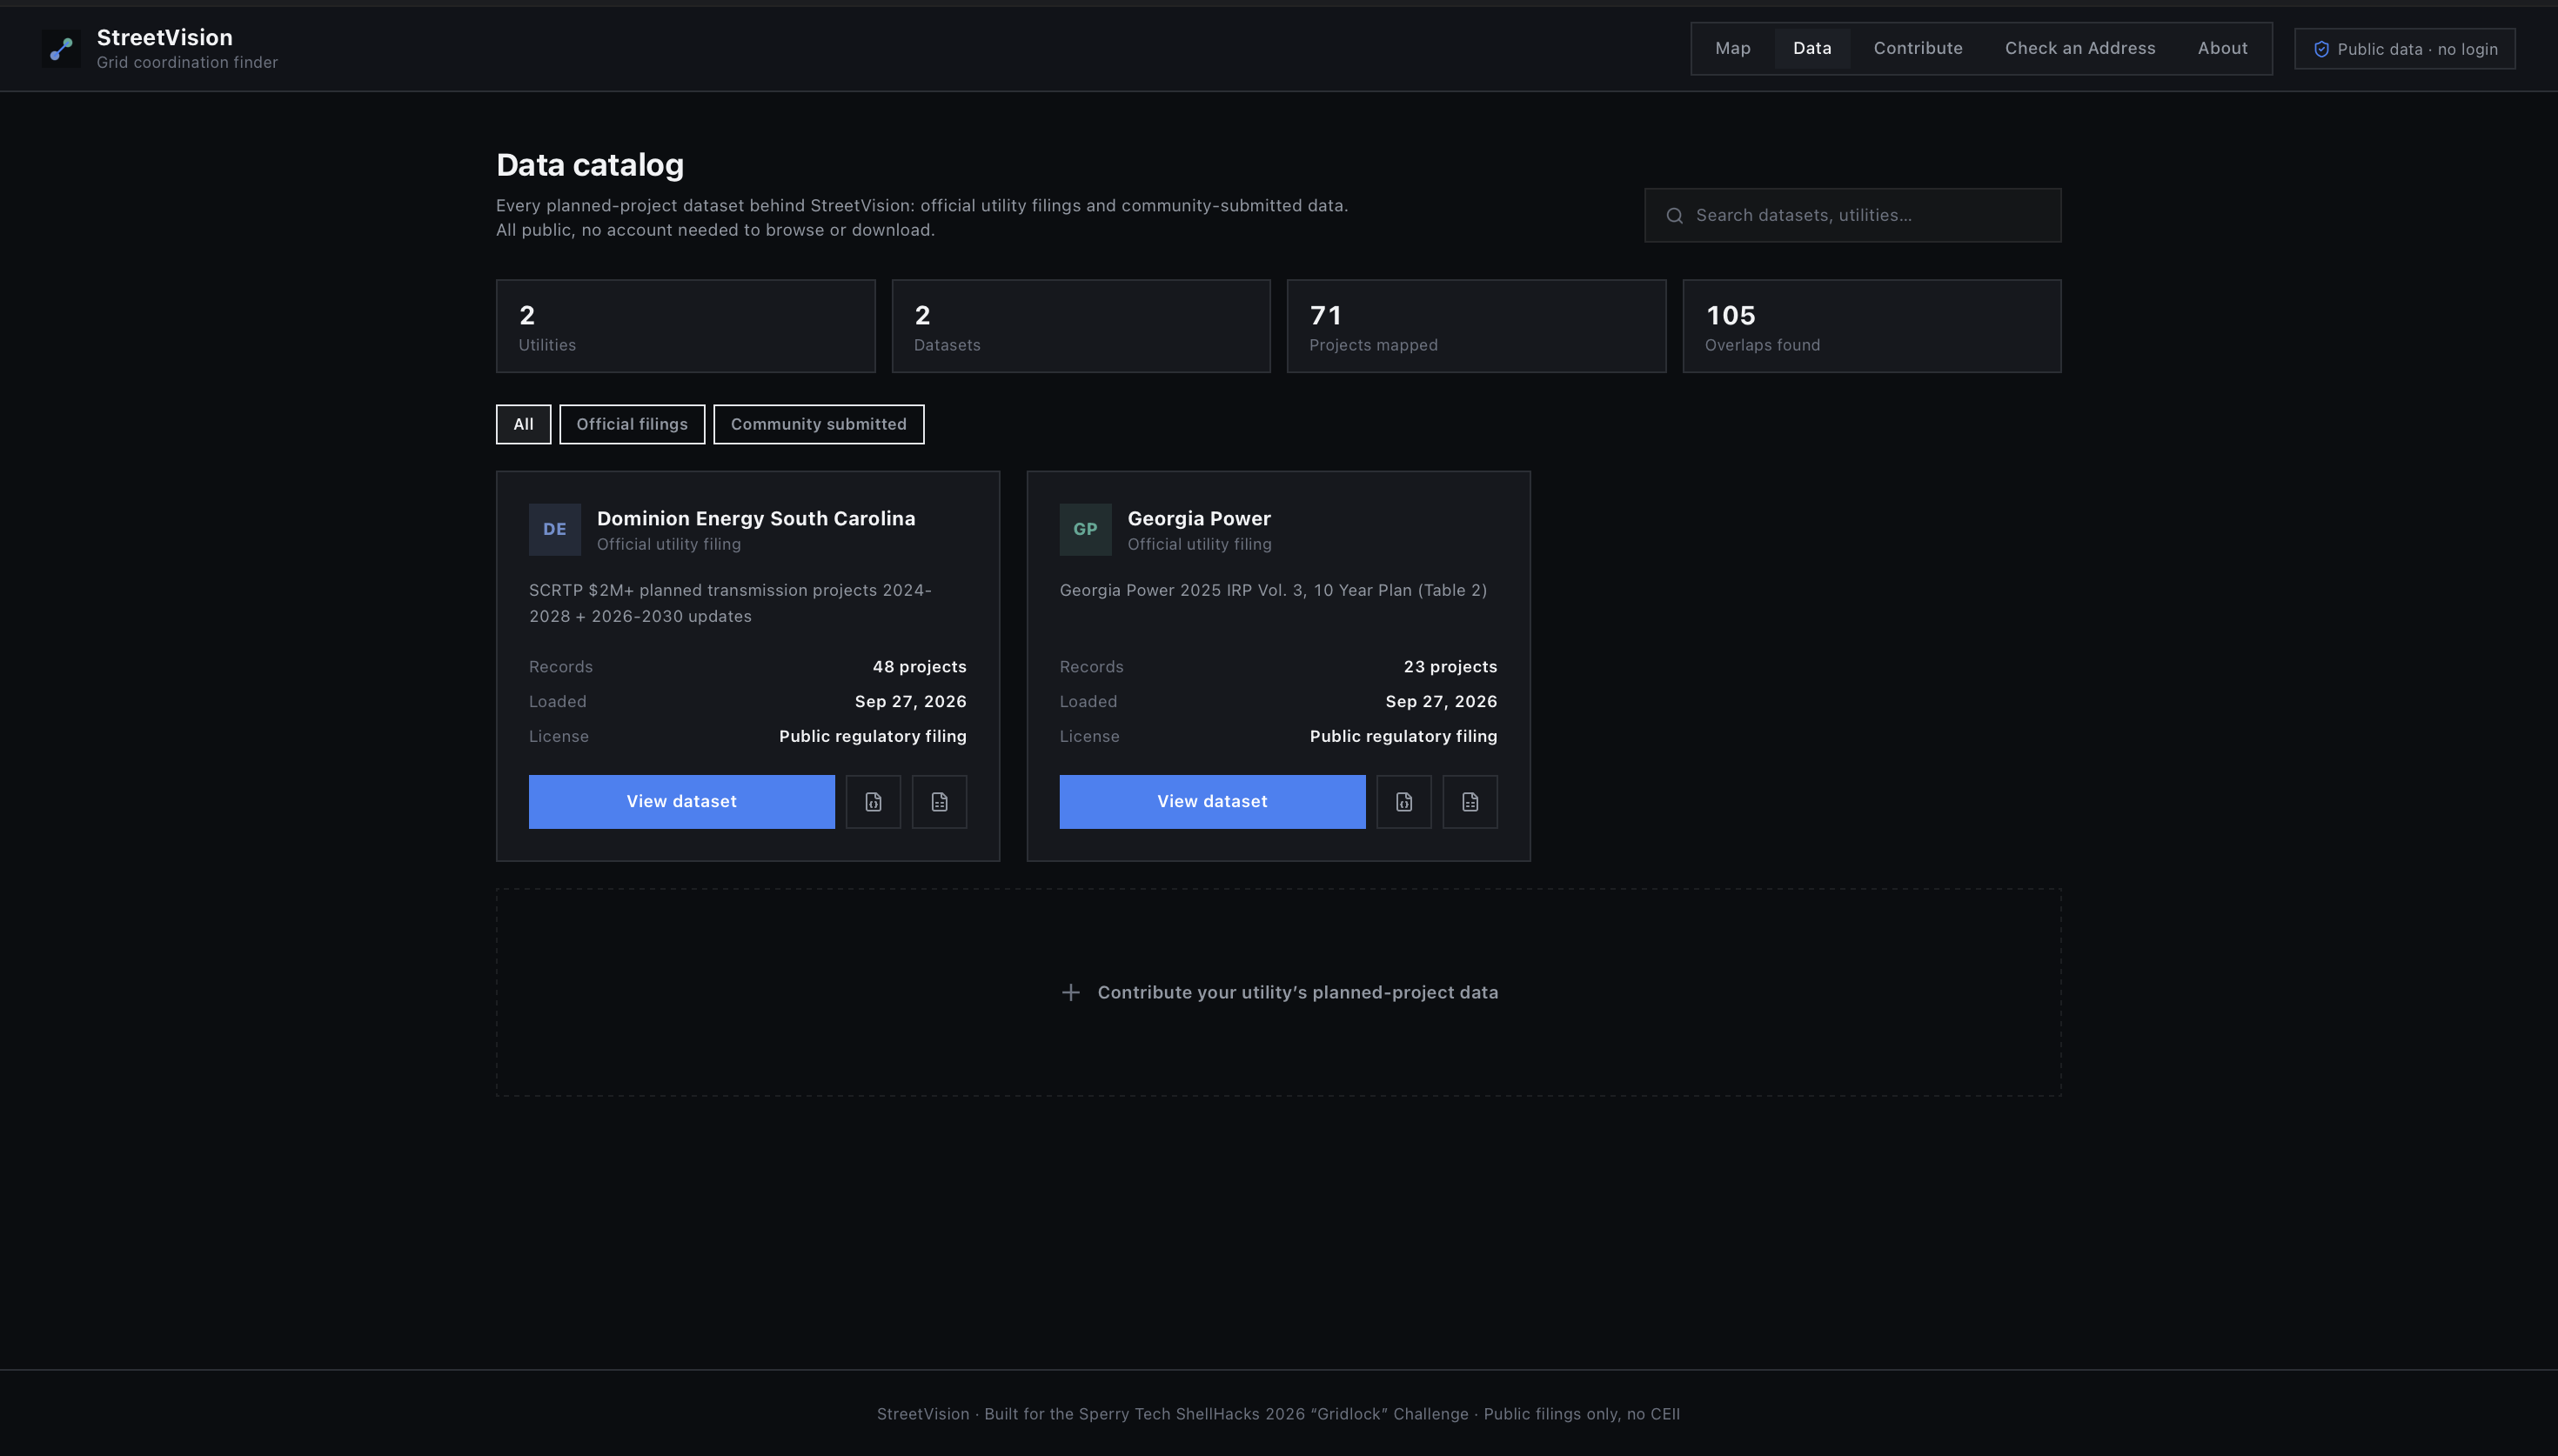
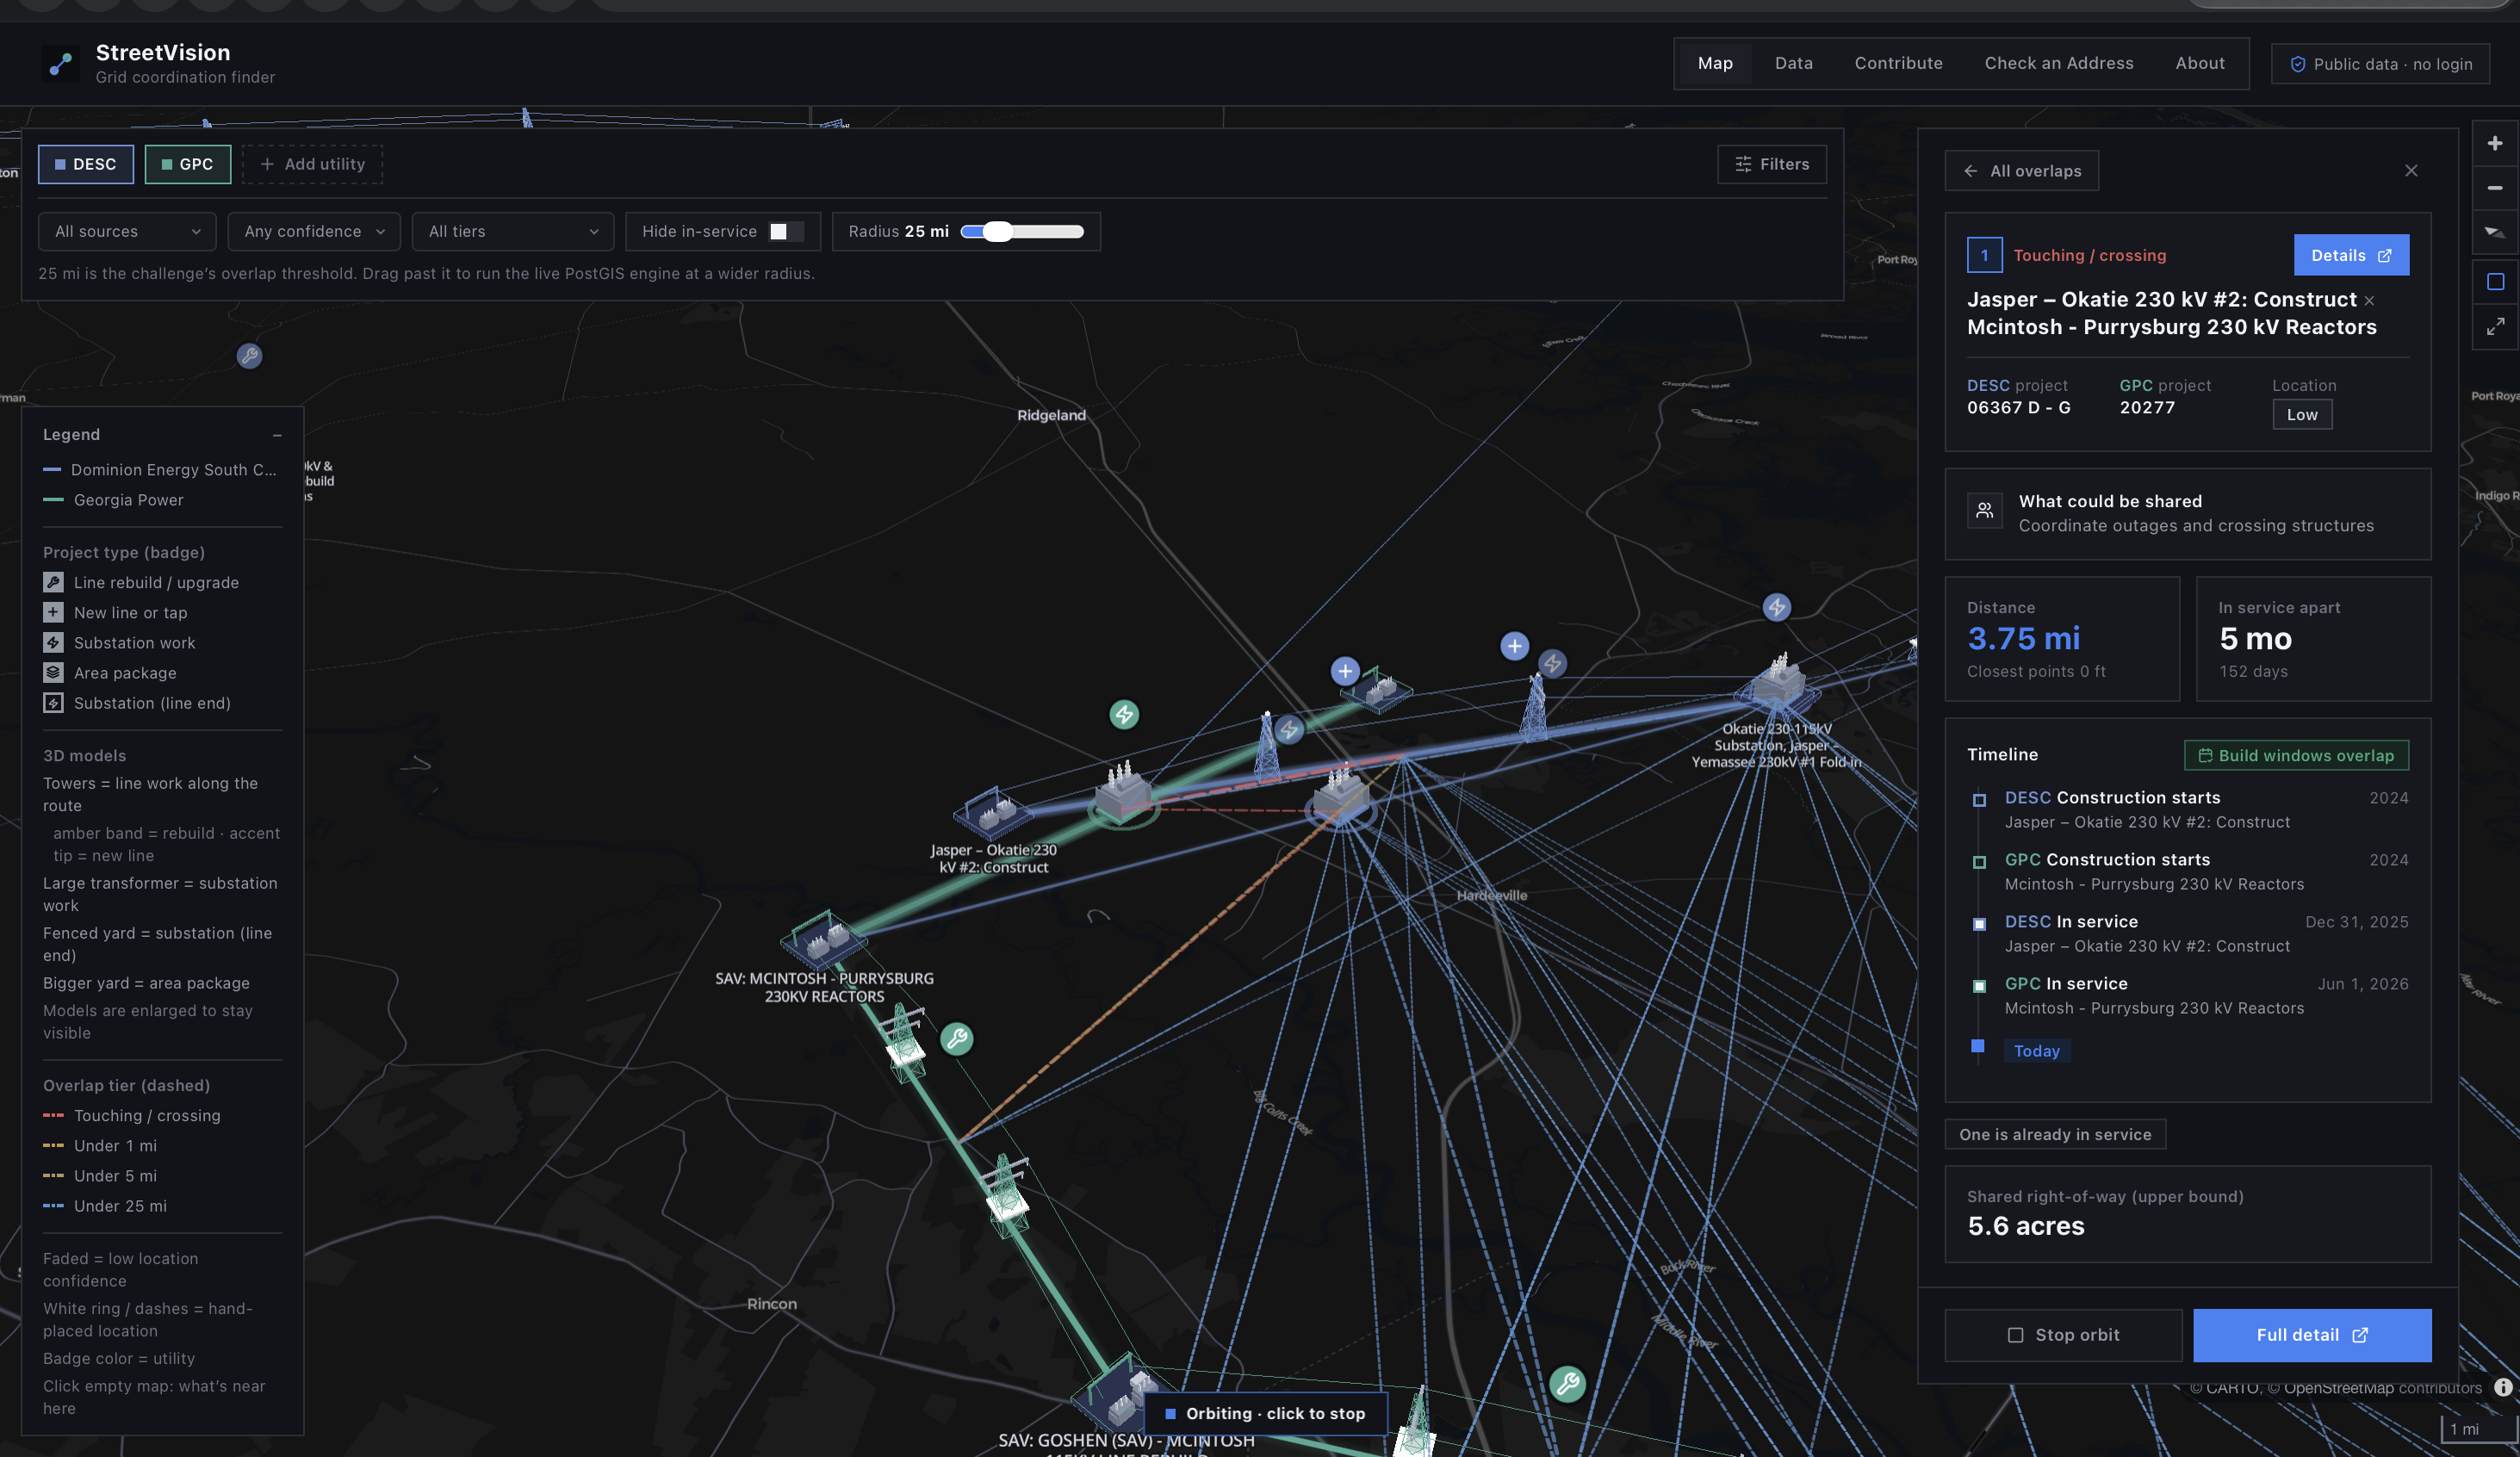
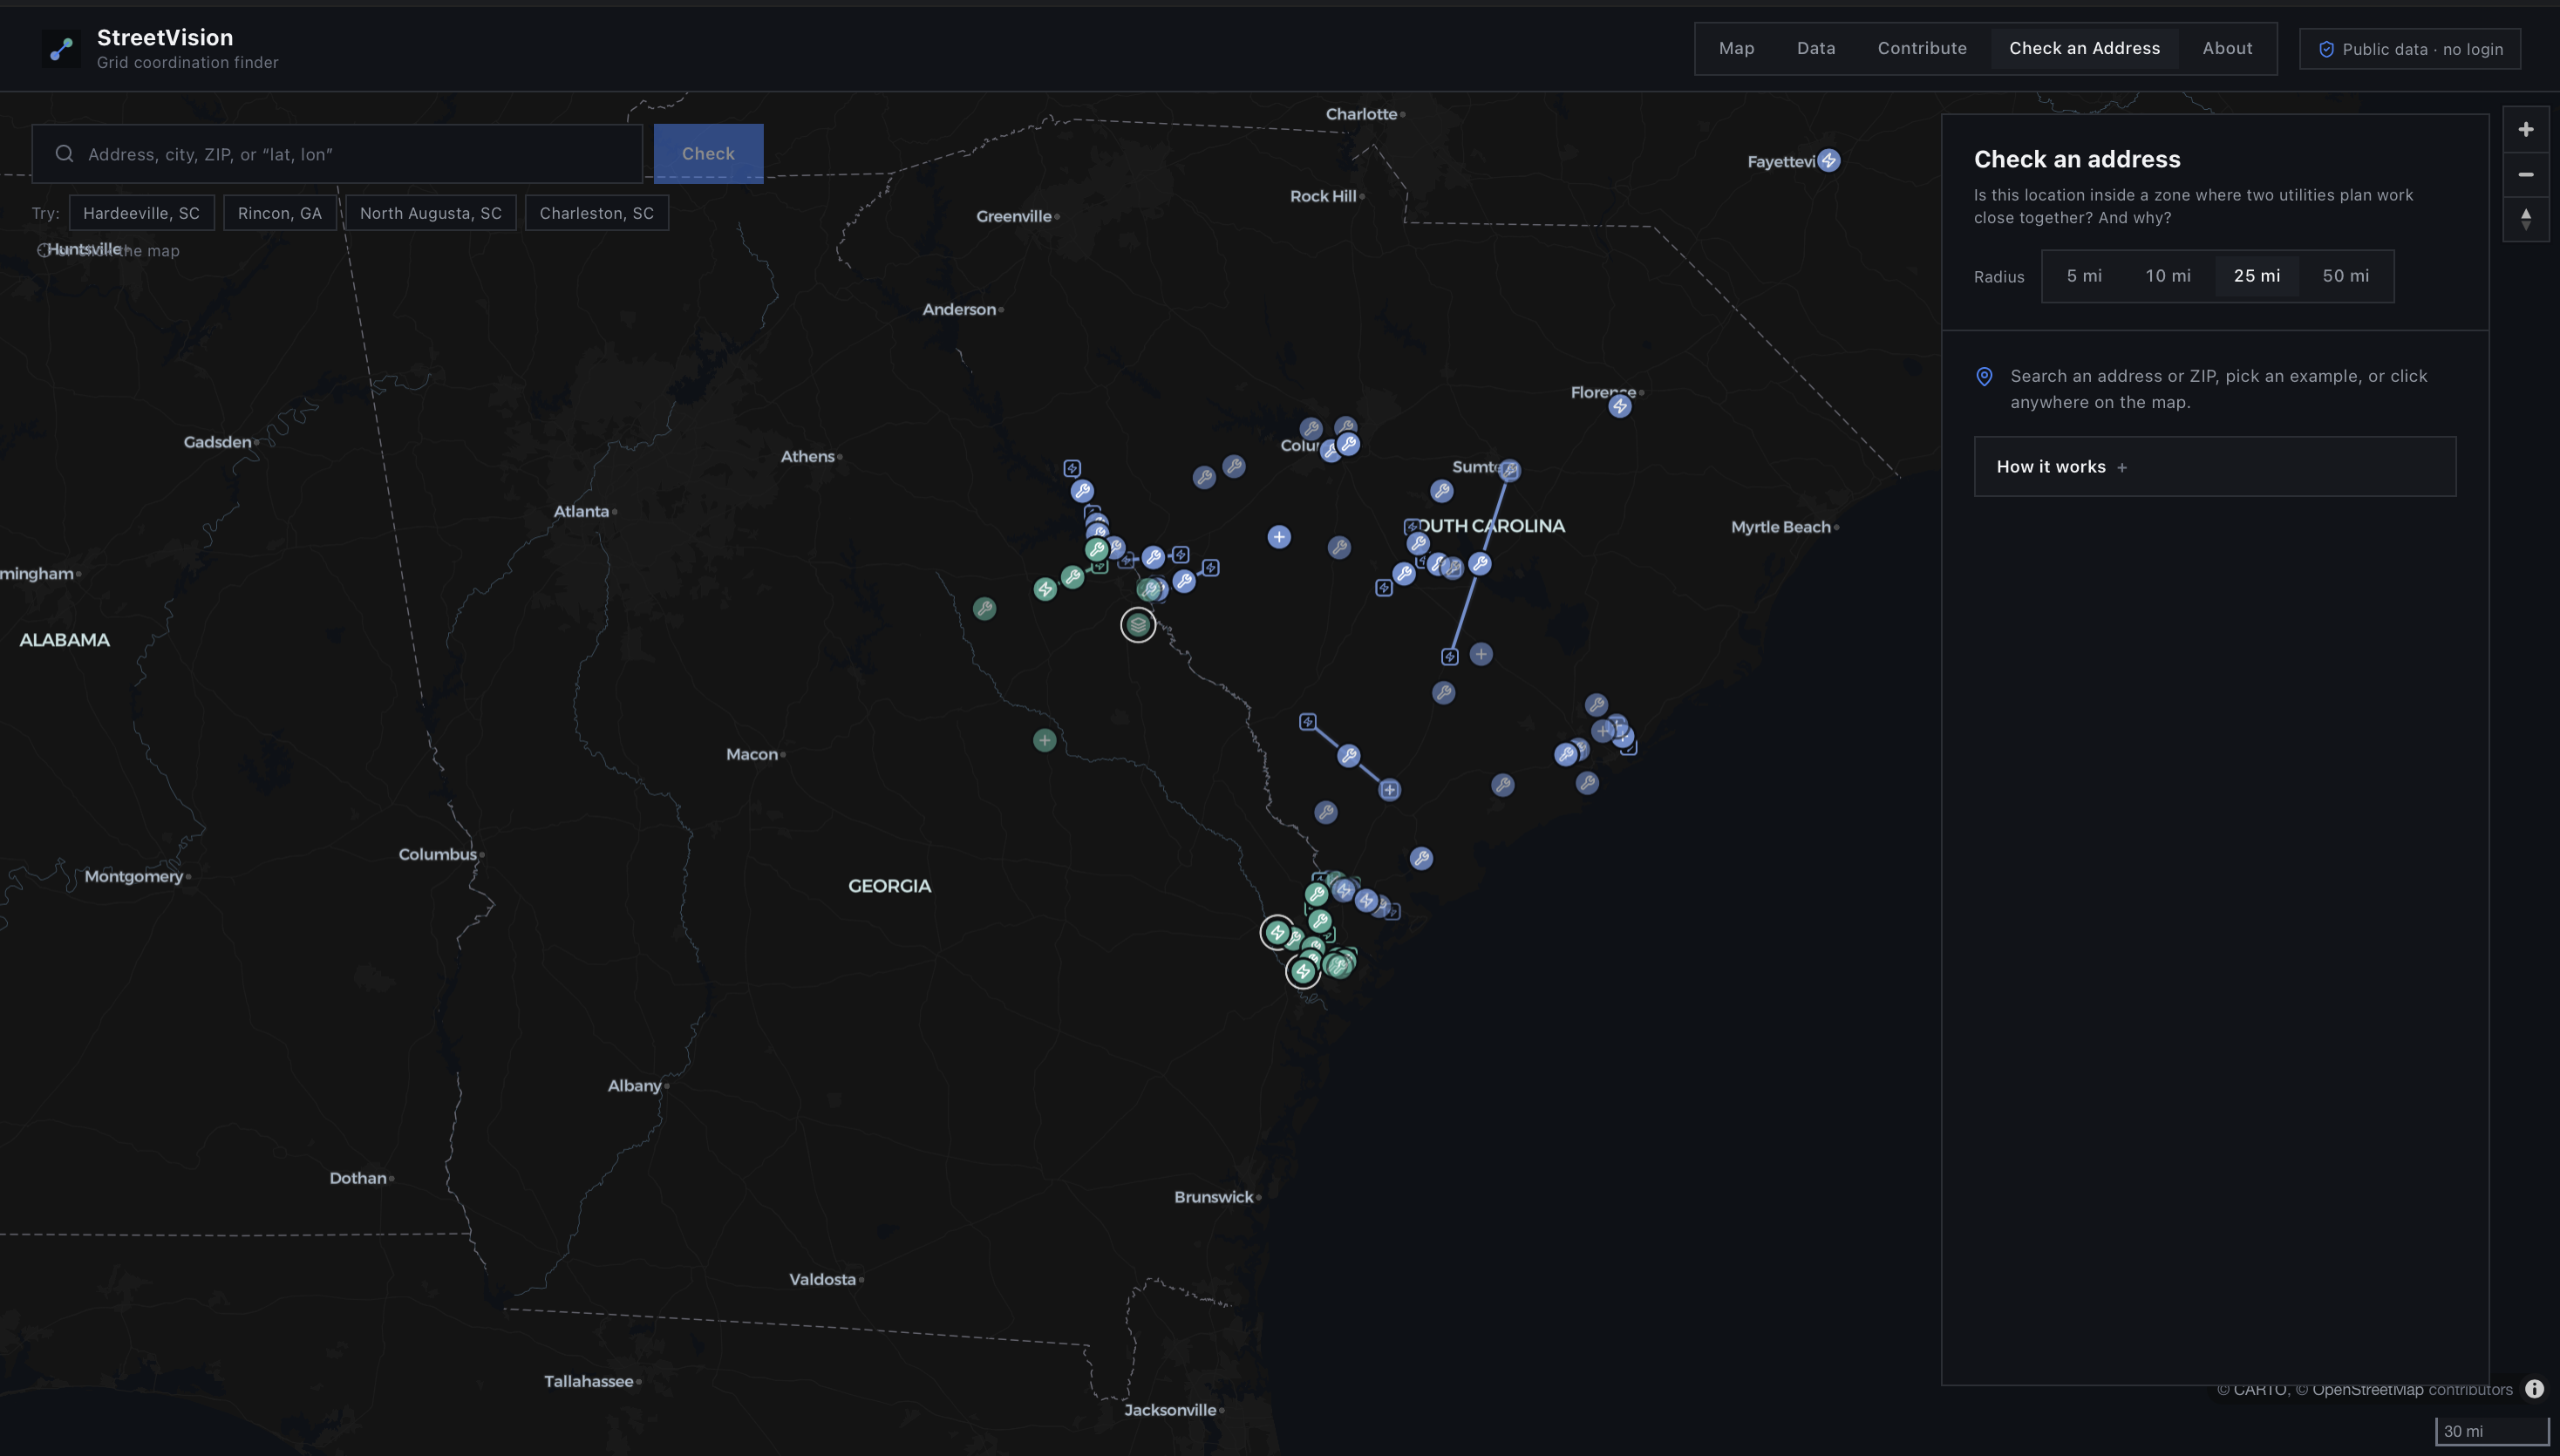
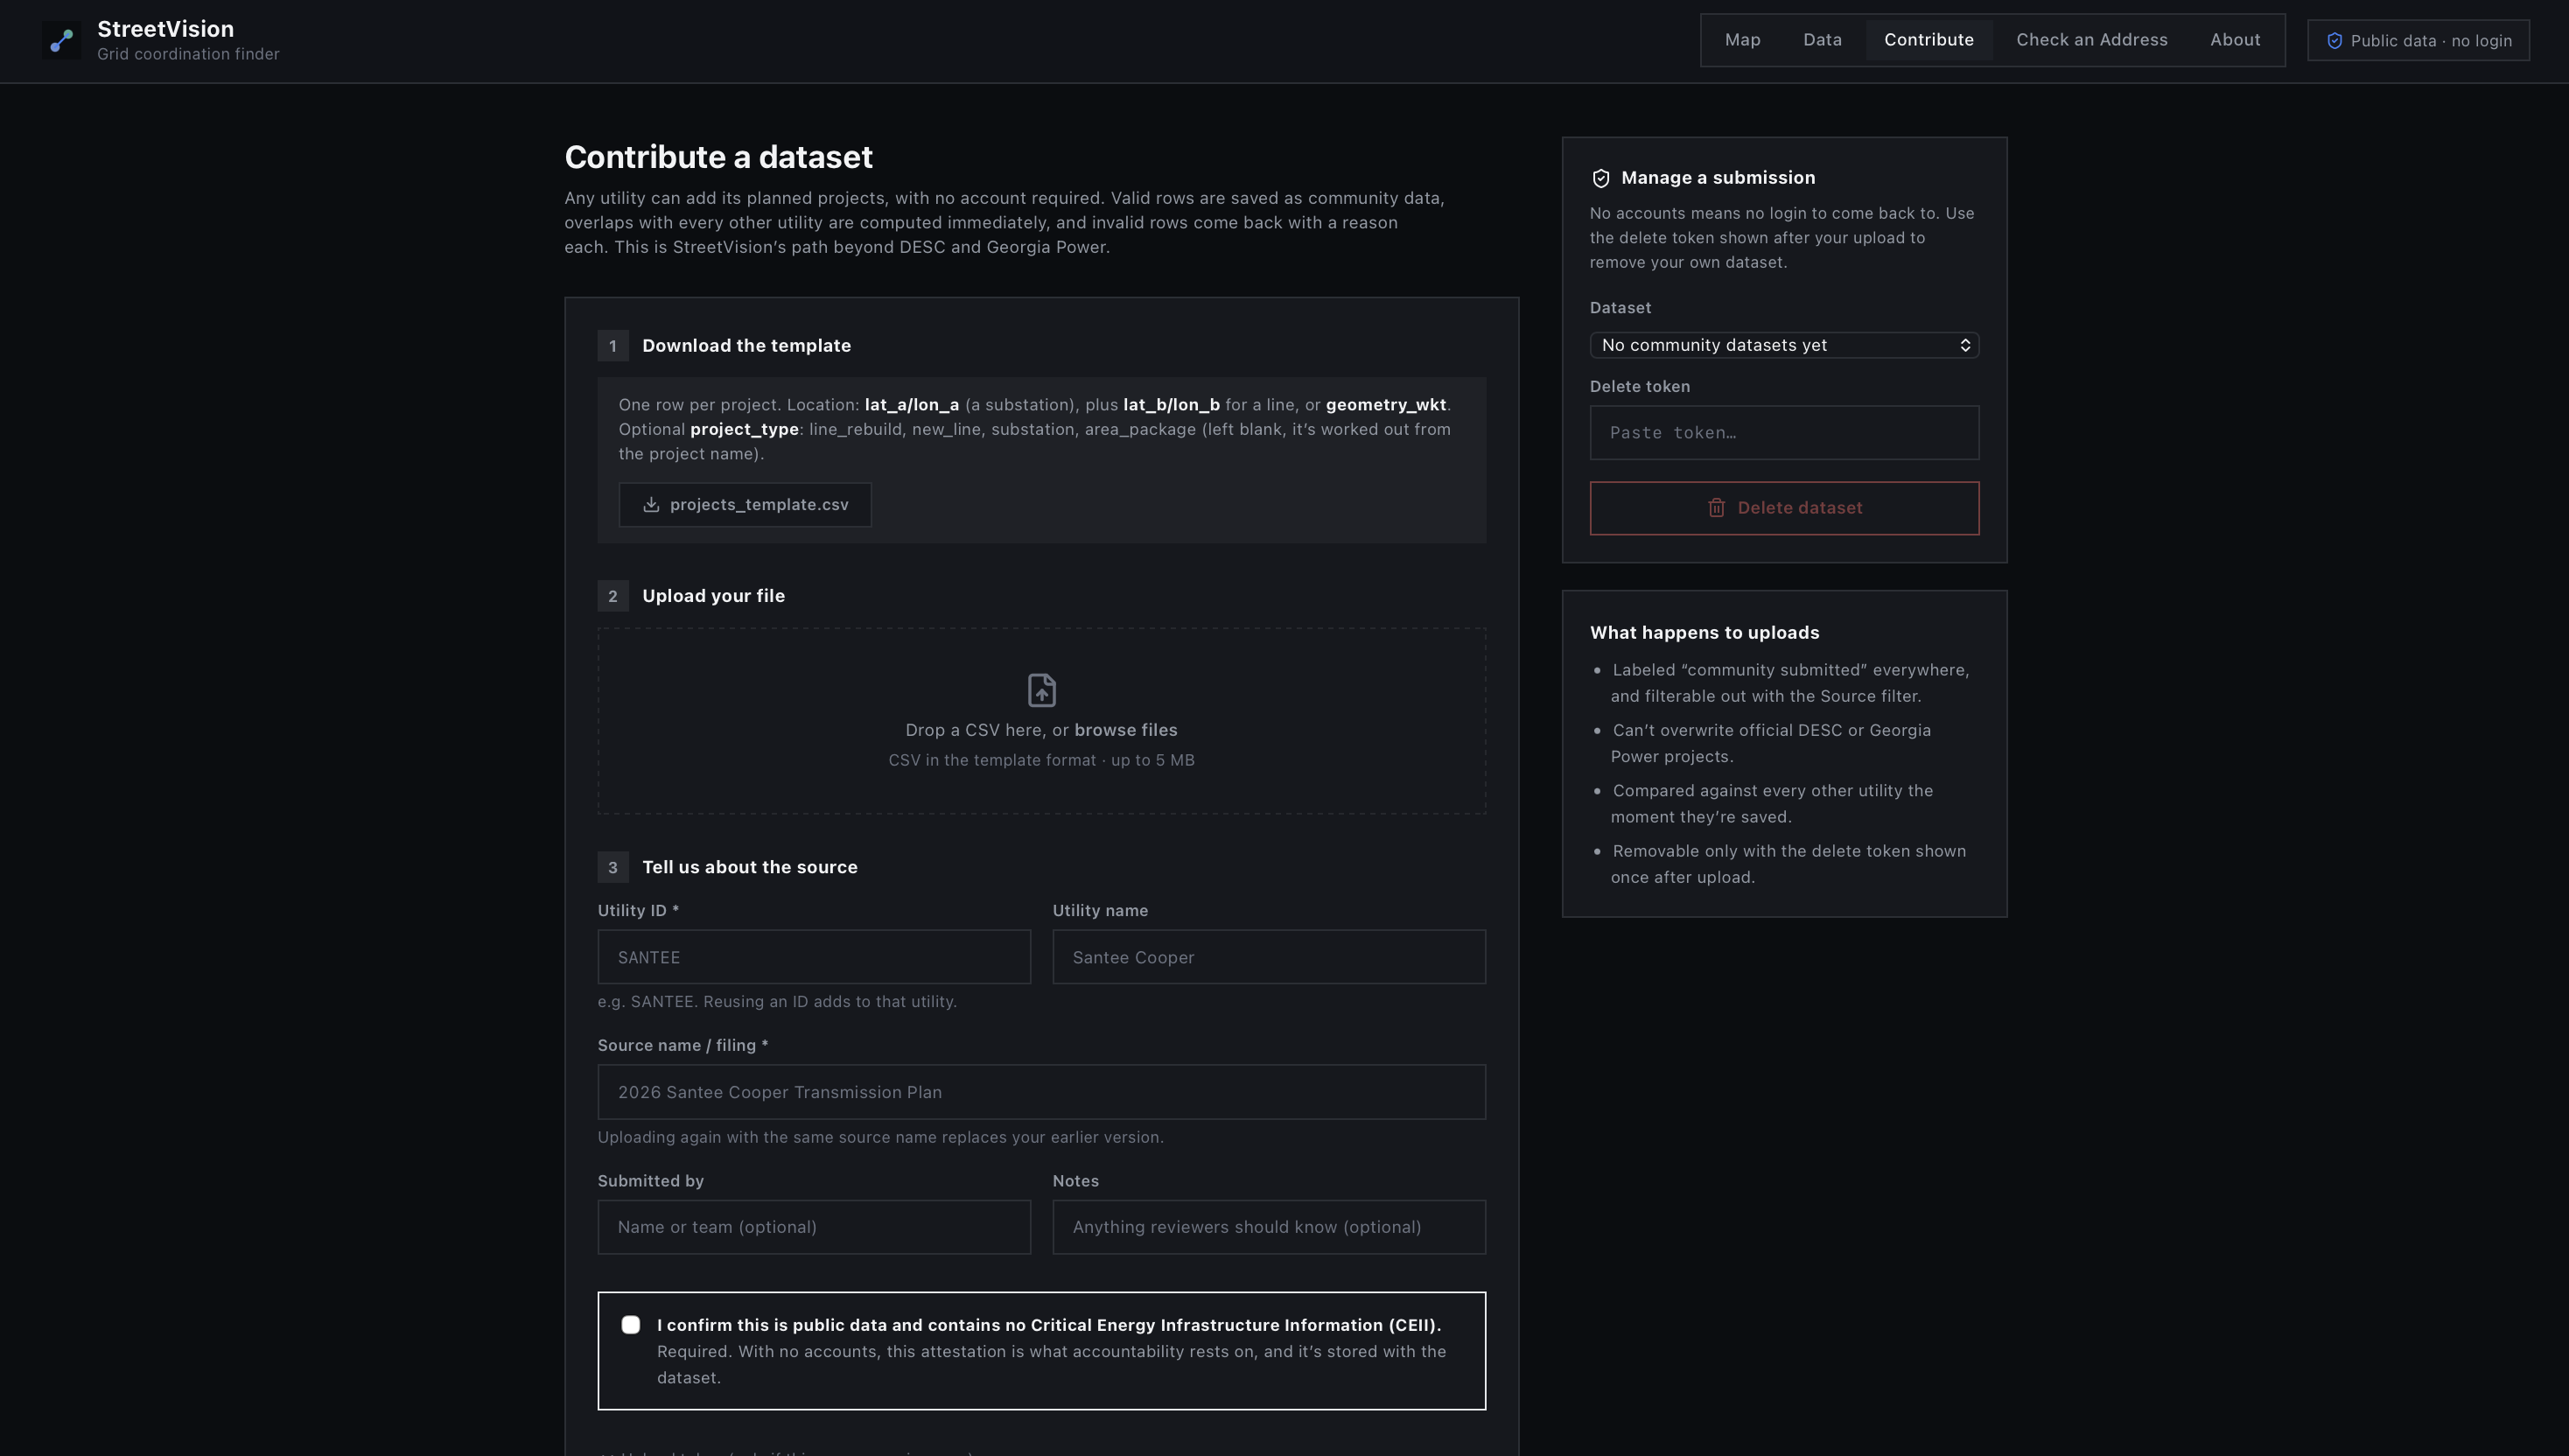
StreetVision reads public utility planning documents, maps each planned project, and flags projects from different utilities that are within 25 miles of each other and scheduled around the same time. It ranks these overlaps so the best opportunities to share land show up first. Our demo compares Dominion Energy South Carolina and Georgia Power.
How we built it
Python scripts pull project data out of the PDFs. OpenStreetMap is used to find real locations for each project. The data is stored in PostgreSQL with PostGIS, which handles the distance and overlap checks. A FastAPI backend serves the results to a React and MapLibre map.
Challenges we ran into
Every utility formats its PDFs differently, so extracting the data was messy. Matching project names to real map locations was also hard, since names are inconsistent. We also had to learn how utility planning works along the way.
Accomplishments that we're proud of
We built a full pipeline from raw PDFs to a ranked, interactive map, using only public data.
What we learned
We learned how transmission planning works, how to run spatial queries in PostGIS, and that cleaning data takes more time than analyzing it.
What's next for StreetVision
Adding more utilities and regions, improving location accuracy, and getting feedback from real utility planners.
Built With
- fastapi
- geojson
- maplibre-gl
- openstreetmap
- overpass-api
- postgis
- postgresql
- python
- react
- sql


Log in or sign up for Devpost to join the conversation.