Inspiration
Urban waterways are everywhere, but most of the time we experience the city without knowing they are there.
While exploring the OneAquaHealth Citizen Science approach, I became interested in a problem that comes even before data collection: how can citizens observe and care about an urban stream if they do not know where it is, what it is called, or how it connects to the city around them?
This became the starting point for StreamScope.
The project explores a simple idea: make the urban water network visible first.
Goiânia, Brazil, became the first study area, with waterways such as Ribeirão Anicuns, Rio Meia Ponte, Córrego Macambira, Córrego Cascavel, and many smaller streams represented through OpenStreetMap data.
What it does
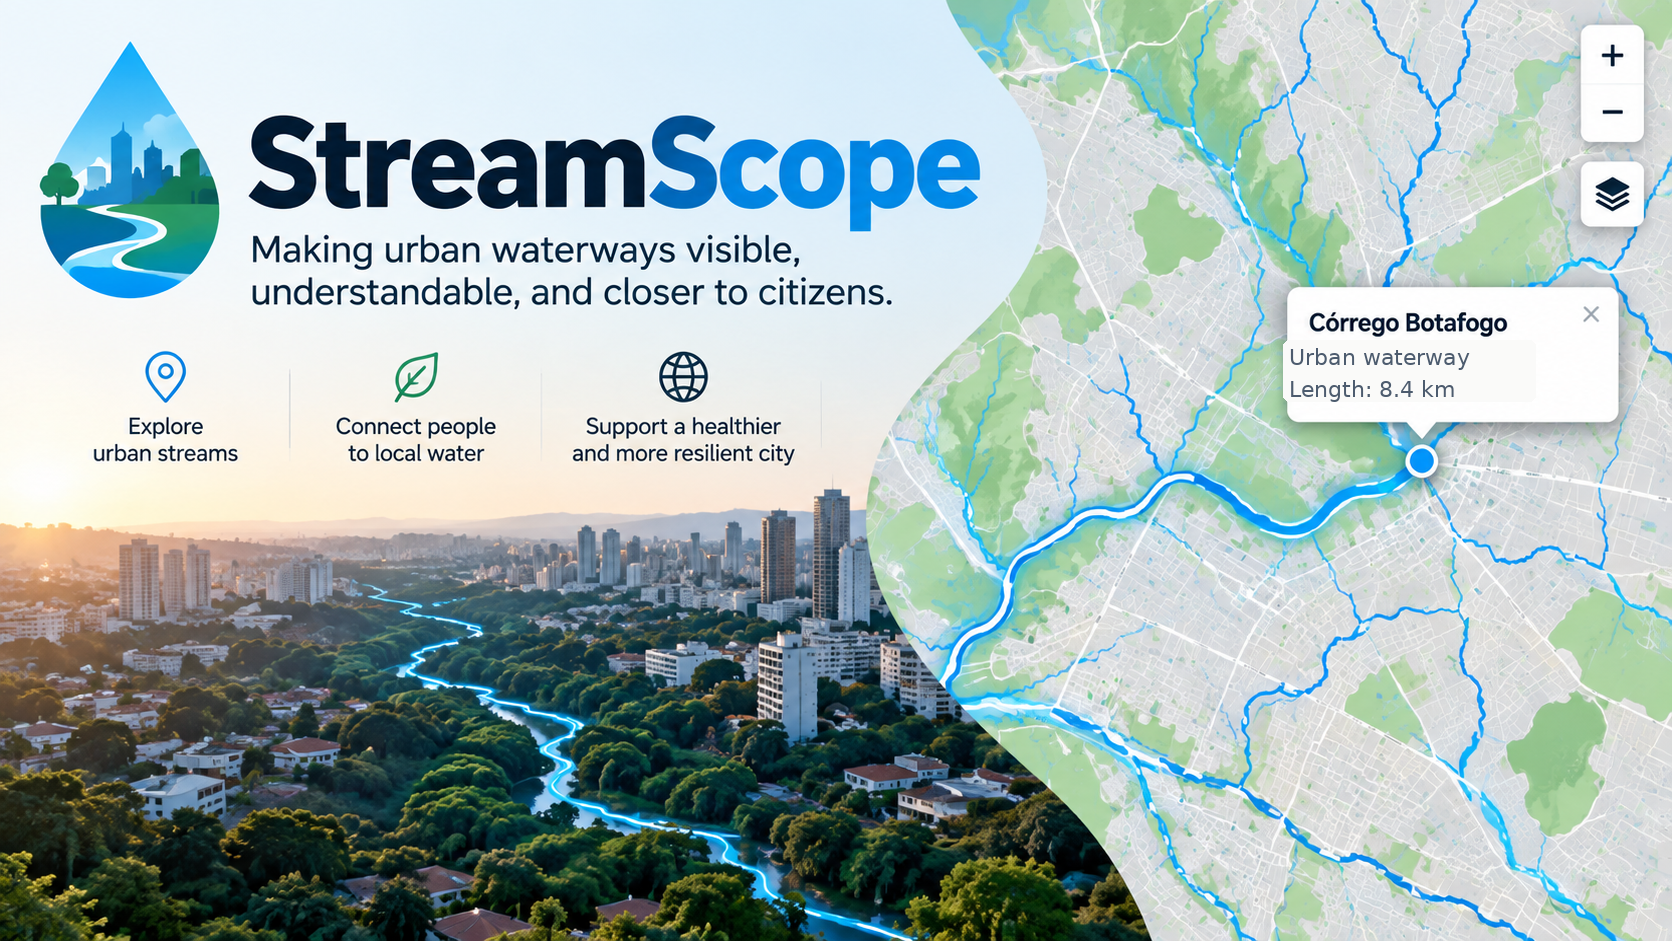
StreamScope is an interactive map focused on urban waterways.
Instead of treating rivers and streams as secondary elements of a conventional street map, the interface gives them visual priority while keeping streets and the urban environment as geographic context.
The current MVP allows users to explore the hydrographic network of Goiânia and discover waterways that may cross neighborhoods, roads, parks, and areas they interact with every day.
The idea is inspired by thematic maps such as cycling maps: if we can build maps specifically to understand mobility infrastructure, we can also build maps specifically to understand urban water infrastructure and ecosystems.
This creates a geographic entry point for citizen science.
Before asking someone to evaluate water color, riparian vegetation, pollution, channel conditions, sewage discharge, or other environmental indicators, we can first help them answer:
What waterway is near me?
How I built it
The project uses hydrographic data extracted from OpenStreetMap, including rivers, streams and other mapped waterway features in Goiânia.
OpenStreetMap data was queried through the Overpass API and processed into geographic data that can be rendered on the web.
The application was built with Angular and TypeScript, using MapLibre GL JS for interactive map visualization and GeoJSON as the main geographic data representation. Geographic processing and experimentation also use Turf.js.
A major part of the work was not simply displaying a basemap, but understanding how waterways are represented in OpenStreetMap: individual segments, names, waterway classifications, underground sections, connections, and inconsistencies in community-generated geographic data.
Ribeirão Anicuns was used as an initial case for investigating how a single urban waterway can be represented across multiple geographic segments.
Challenges
The biggest challenge was discovering that a river is not necessarily represented as one clean object in geographic data.
The same waterway may be divided into many segments, have incomplete or inconsistent names, change classification, pass through underground sections, or connect to other waterways through relationships that are not immediately obvious.
This means that creating a meaningful water-centered map requires more than drawing blue lines.
Another challenge was scope. During the hackathon, there were many possible directions involving citizen science, environmental indicators, observations, storytelling, and analysis. I deliberately reduced the MVP to its most fundamental question: can we create an interface where the city's water network becomes the protagonist?
What I learned
This project made me look at my own city differently.
Open geographic data can reveal an environmental layer of the city that is physically present but cognitively almost invisible.
I also learned more about OpenStreetMap's waterway model, Overpass queries, geographic data processing, GeoJSON and interactive cartography.
Most importantly, the project reinforced the idea that citizen science is also a UX problem.
Good environmental data collection does not begin only with a form. It begins by helping people understand the place they are observing.
What's next
StreamScope is currently a focused prototype, but the map can become the geographic foundation for a broader citizen-science experience.
Future iterations could allow users to select an individual waterway, understand its course from source to mouth, divide it into meaningful urban sections, identify nearby neighborhoods, discover existing observations, and connect locations directly with OneAquaHealth citizen-science activities.
Another important direction is data quality. Missing names, incorrect classifications and incomplete waterway connections can themselves become opportunities for collaborative mapping and environmental participation.
The long-term concept is simple:
discover the waterway → understand the place → observe it → contribute data → see what the community is learning.
StreamScope starts with the first step: making urban waterways visible.
Built With
- angular.js
- api
- data
- geojson
- gis
- gl
- javascript
- maplibre
- open
- openstreetmap
- overpass
- scss
- turf.js
- typescript
- web


Log in or sign up for Devpost to join the conversation.