Inspiration
Finding land for solar development is not as simple as finding the sunniest location. A potential site also needs enough usable land, manageable terrain, limited environmental conflicts, and reasonable access to infrastructure.
These factors often conflict. One site may be flatter but farther from transmission, while another may have better infrastructure access but worse terrain. Many site-selection tools hide these decisions inside a weighted suitability score, where arbitrary weights determine what is considered "best."
We wanted to build a system that makes those tradeoffs visible instead.
SolarSight focuses on brownfields because they represent land that has already been disturbed and may have opportunities for productive reuse.
What it does
SolarSight is an interactive geospatial decision engine for screening North Carolina brownfields for solar redevelopment.
A planner specifies project requirements such as:
- Project size in MW AC
- Maximum terrain grade
- Whether mapped wetlands should be excluded
- Optional infrastructure constraints
SolarSight then evaluates hundreds of real brownfield sites and determines which candidates can support the project.
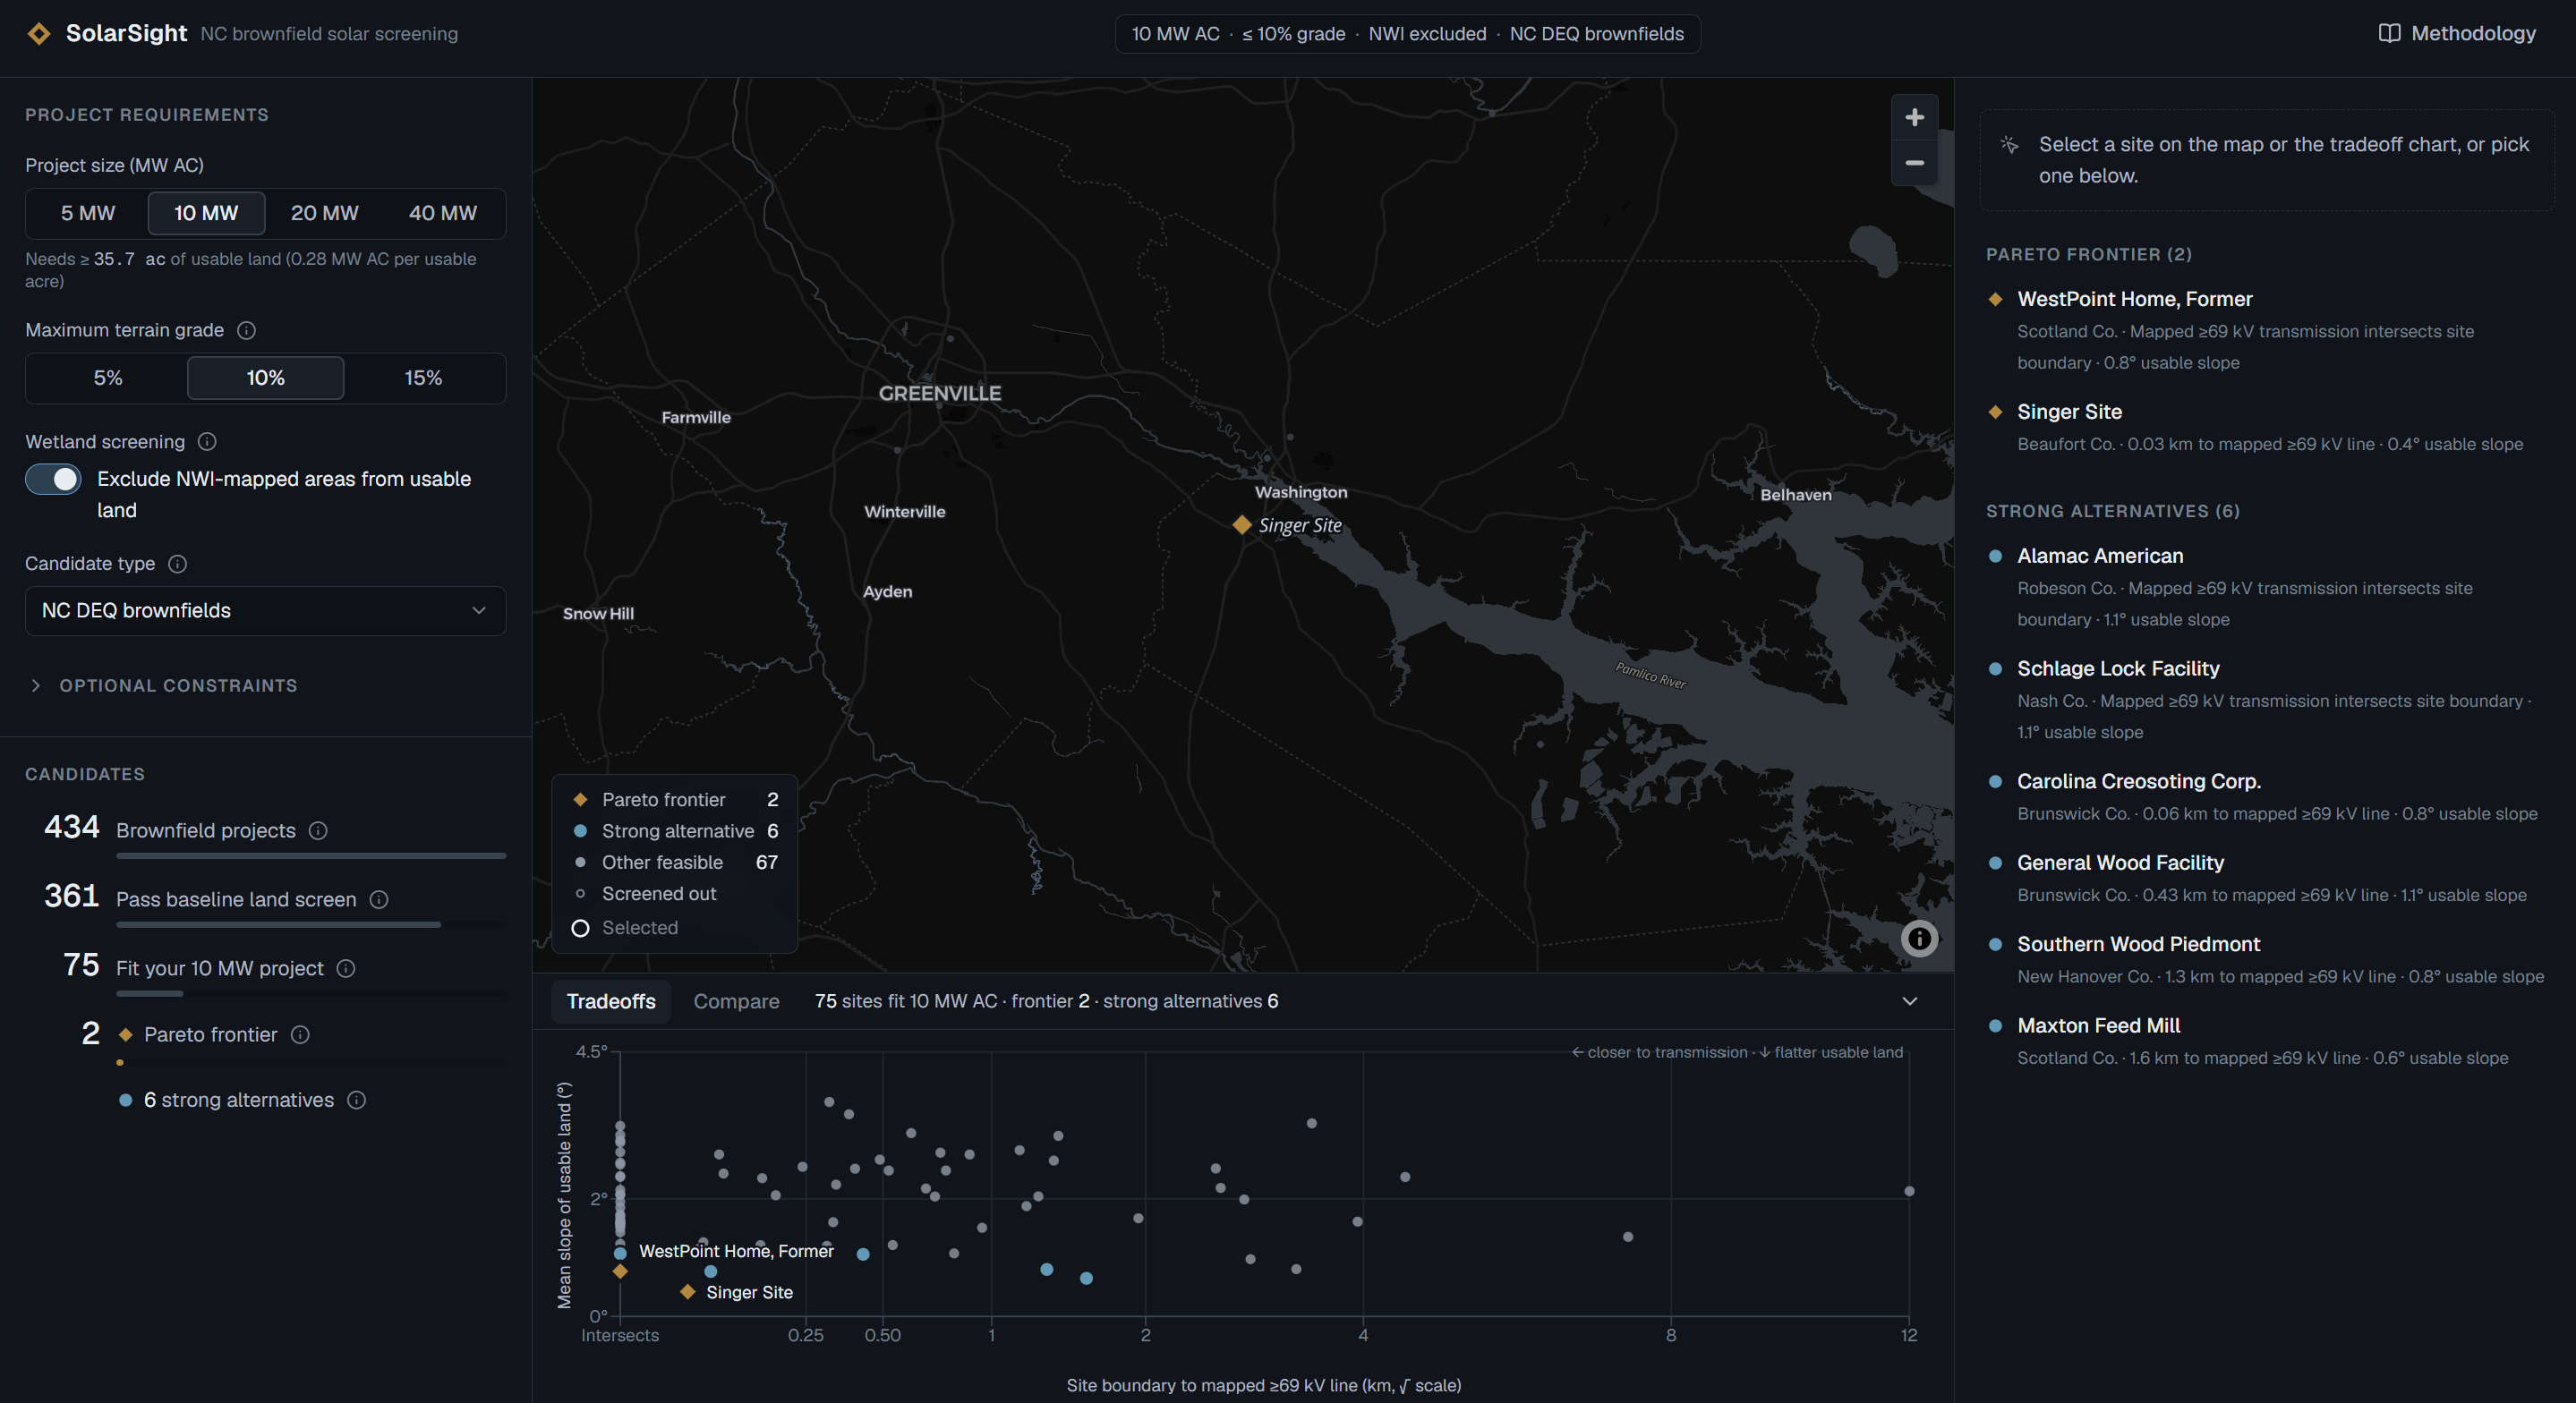
For feasible sites, SolarSight uses Pareto optimization across two active objectives:
- Minimize distance to mapped high-voltage transmission
- Minimize mean slope of usable land
Instead of producing an arbitrary overall score, SolarSight identifies the Pareto frontier: sites where improving one objective requires sacrificing another.
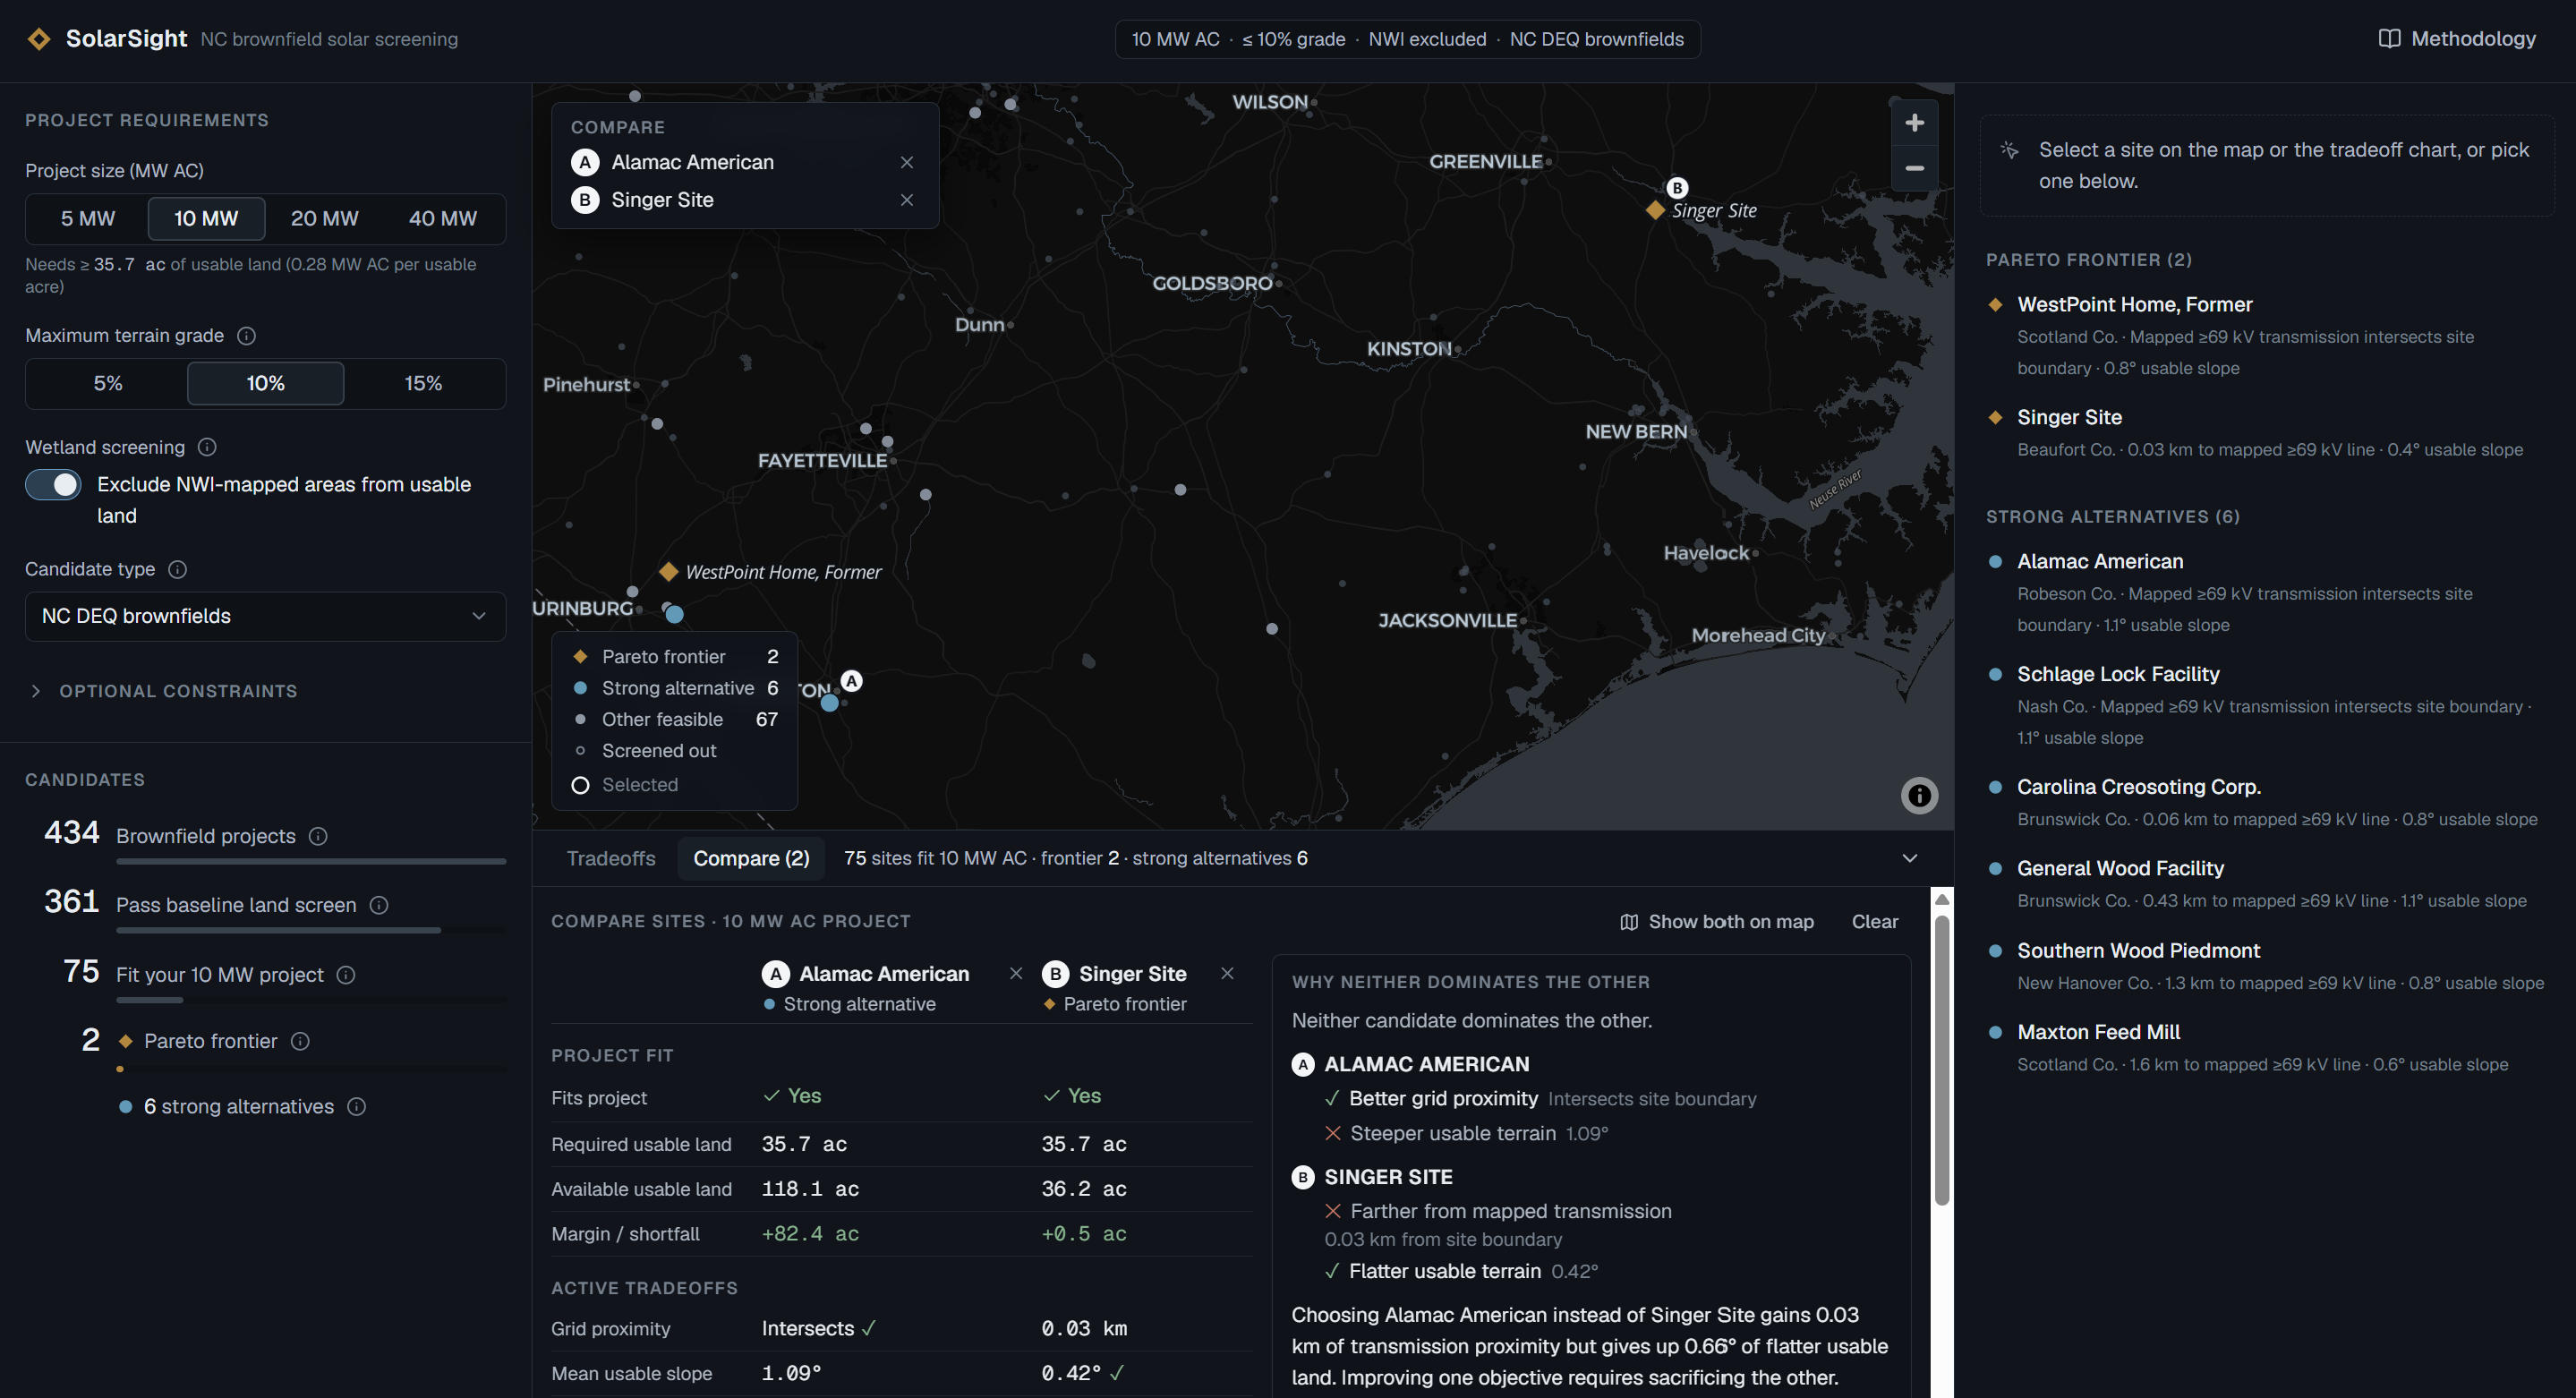
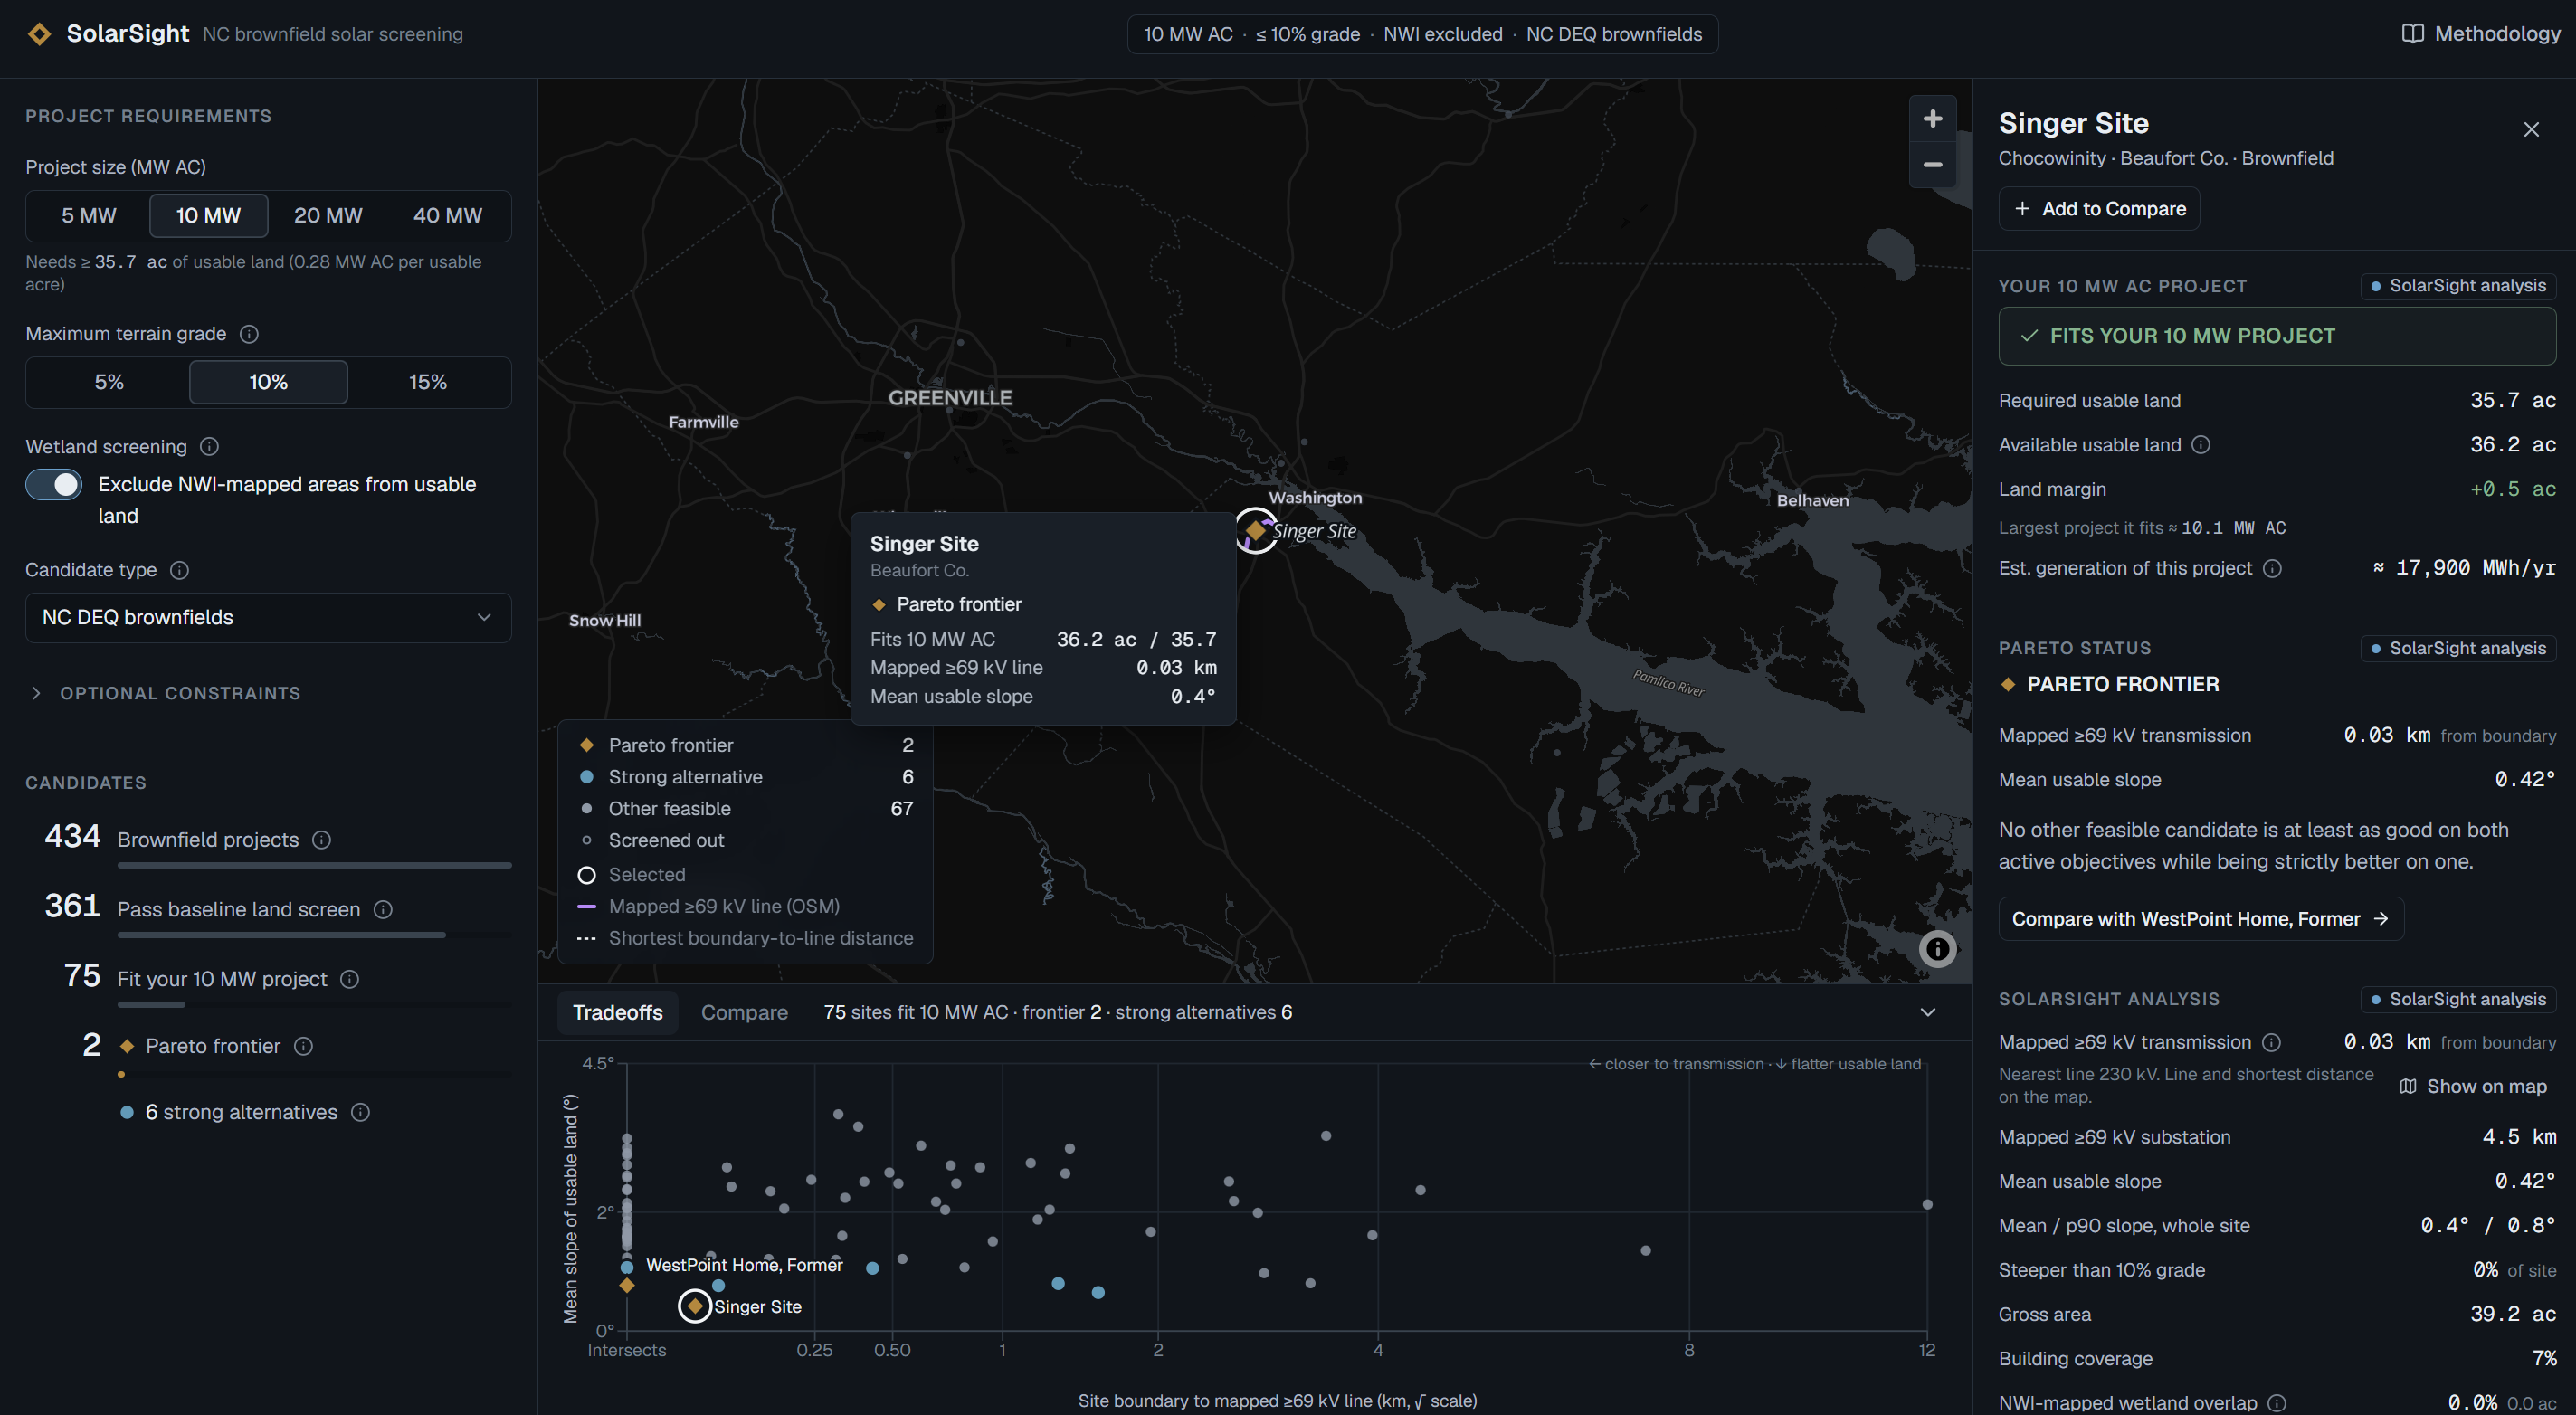
Users can explore candidates on an interactive map and tradeoff chart, inspect why a site fits or fails their project, see why one candidate dominates another, and directly compare competing sites.
Changing the project requirements immediately recomputes feasibility and the Pareto frontier.
How we built it
SolarSight has two main layers: an offline geospatial processing pipeline and an interactive decision application.
Geospatial pipeline
We built a Python pipeline that combines multiple real geospatial datasets, including:
- North Carolina DEQ brownfield project boundaries
- EPA RE-Powering America's Land screening data
- USGS elevation data
- National Wetlands Inventory data
- Mapped transmission infrastructure
The pipeline performs geometry validation and repair, coordinate reference system transformations, cross-dataset entity matching, raster terrain analysis, polygon intersections, wetland overlap calculations, usable-land calculations, and nearest-infrastructure geometry.
The result is a normalized geospatial candidate dataset containing the metrics required by the decision engine.
Decision engine
At runtime, SolarSight evaluates each candidate against the planner's current project requirements.
Candidates that pass those requirements are evaluated using Pareto dominance rather than a weighted score.
A candidate dominates another when it is at least as good on both active objectives and strictly better on at least one. Candidates that are not dominated form the Pareto frontier.
We implemented the interactive decision logic in TypeScript and validate its results against our Python reference implementation using a suite of golden scenarios.
Interface
The frontend is built with Next.js, React, and TypeScript.
MapLibre GL renders the geographic candidate space and transmission context, while Recharts visualizes candidates in objective space. Both views are linked, so selecting or comparing a site remains consistent across the map, chart, and site details.
The Compare workflow translates the optimization results into plain language. SolarSight can explain why one site dominates another or, for two frontier sites, which objective each site improves and what tradeoff the planner would be making.
Challenges we ran into
One of the largest challenges was reconciling datasets that were created for different purposes and at different times.
EPA screening records had to be matched against current North Carolina brownfield geometries while preserving the distinction between historical EPA attributes and metrics calculated by SolarSight.
Terrain analysis required working with raster elevation data and converting it into meaningful site-level usable-land and slope metrics.
Infrastructure distance also produced an interesting edge case. Many large industrial properties are crossed by mapped transmission lines, producing a mathematically correct distance of zero. Rather than replacing this with centroid distance or artificially modifying the result, SolarSight treats this as a geometric state and displays it as "Intersects site boundary."
Another challenge was designing the optimization itself. Adding more objectives would make more candidates appear Pareto-optimal, while a weighted score would introduce assumptions we could not justify. We therefore kept the active optimization intentionally small and moved other factors into explicit project constraints and contextual information.
Accomplishments that we're proud of
We are especially proud that SolarSight is not simply a visualization of a prepared dataset.
Changing project requirements causes the decision engine to recompute site feasibility, Pareto relationships, map classifications, tradeoff-space positions, and candidate explanations.
The application can also explain its results. Instead of telling a planner that one site scored 87 and another scored 82, SolarSight can show that one candidate dominates another because it has both better transmission proximity and flatter usable terrain.
When neither candidate dominates the other, SolarSight exposes the actual tradeoff rather than pretending there is a universally best answer.
We also built automated parity tests between the browser decision engine and our Python reference implementation so that interactive results remain consistent with the underlying analysis.
What we learned
The biggest lesson was that geospatial decision support is as much about communicating uncertainty and tradeoffs as it is about performing spatial calculations.
We learned how to reconcile large government geospatial datasets, work across raster and vector data, calculate metrics from real geometries, and design a multi-objective optimization system around defensible assumptions.
We also learned that explainability can be a product feature. Pareto optimization became much more useful once users could see why a site was dominated and directly compare competing alternatives.
What's next for SolarSight
SolarSight is currently a screening tool, not an engineering, permitting, or interconnection determination.
Future versions could incorporate additional authoritative information such as land ownership and availability, interconnection capacity and queue data, more detailed environmental constraints, and project economics.
The underlying workflow could also be extended beyond North Carolina by connecting equivalent brownfield and infrastructure datasets from other states.
Our goal is to keep the same principle as the system expands: make assumptions explicit, preserve the underlying geographic evidence, and show decision-makers the real tradeoffs instead of hiding them inside a single score.
Built With
- epa-re-powering
- geojson
- geopandas
- maplibre-gl-js
- national-wetlands-inventory
- nc-deq-brownfields
- next.js
- openstreetmap
- pytest
- python
- react
- recharts
- shadcn/ui
- tailwind-css
- typescript
- usgs-3dep
- vitest
- zod
- zustand

Log in or sign up for Devpost to join the conversation.