-
-
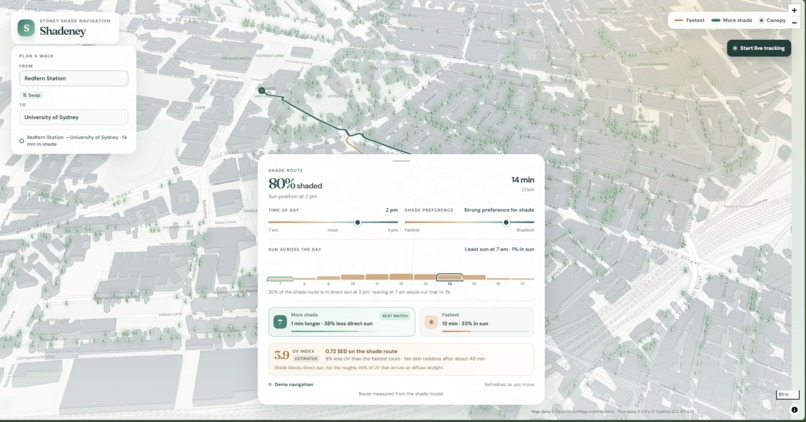
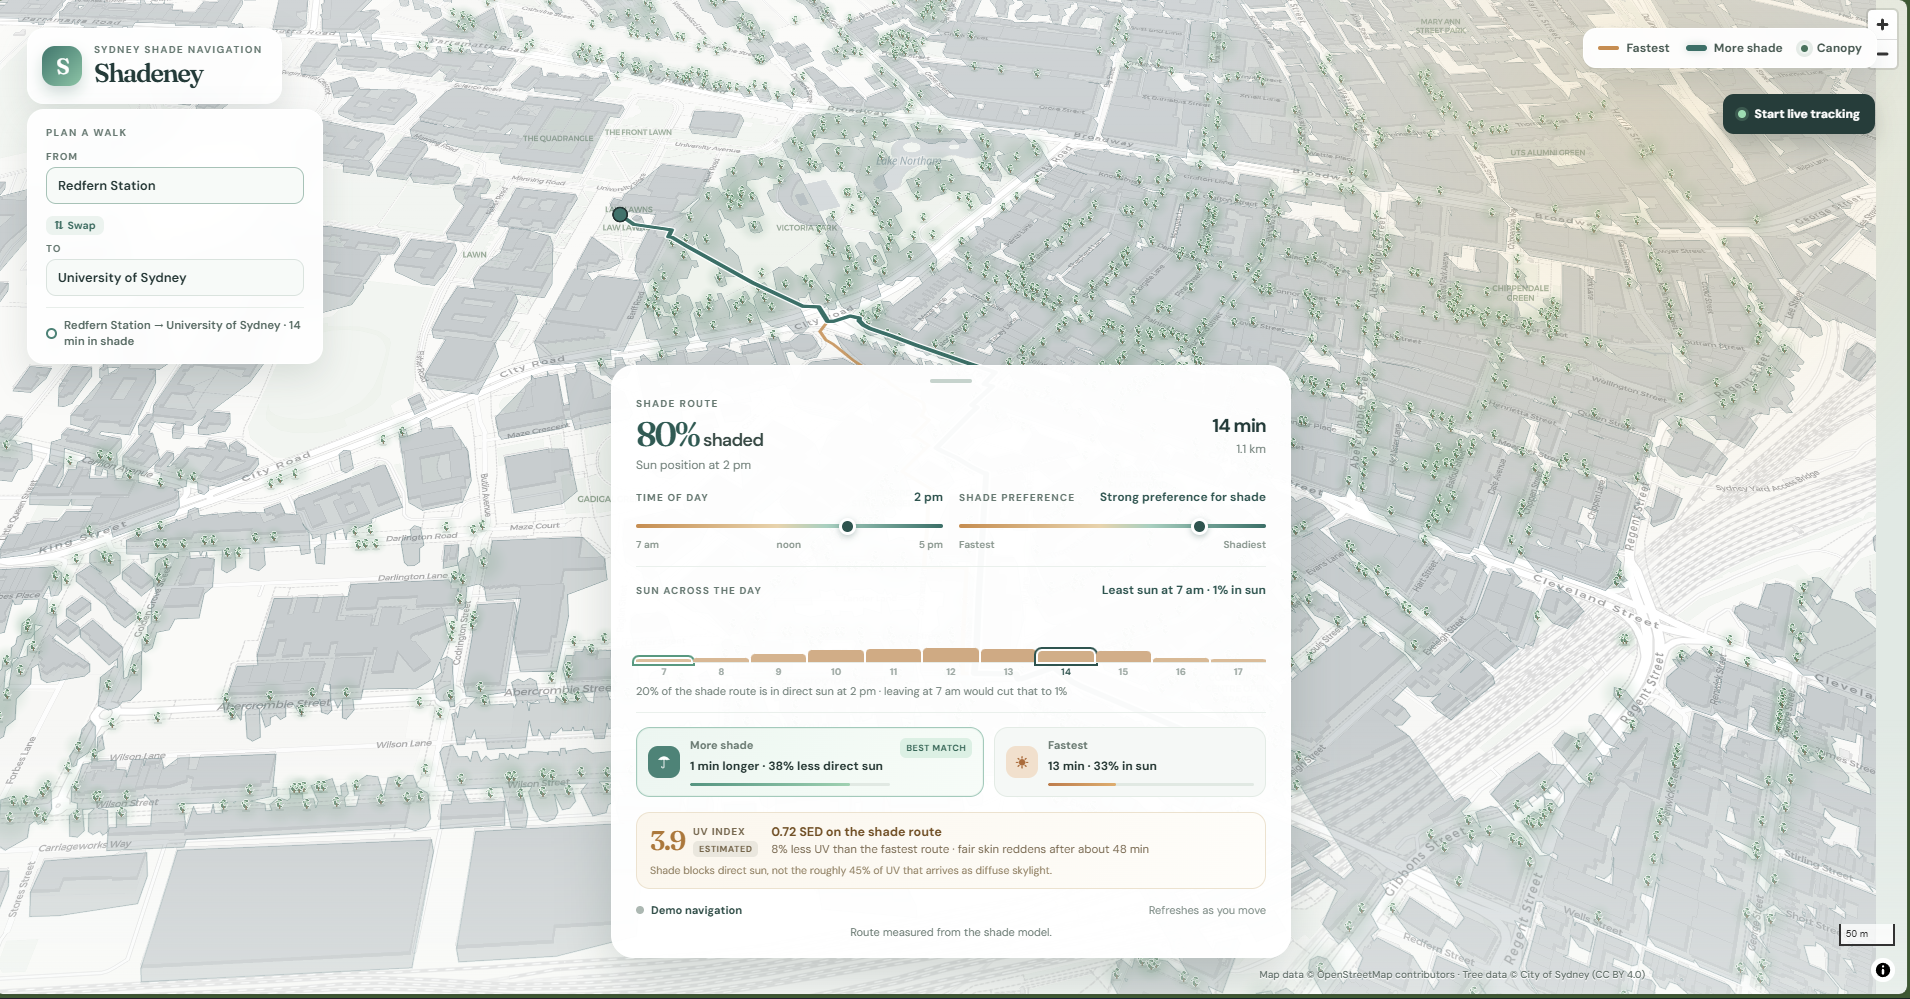
Website view on laptop
-
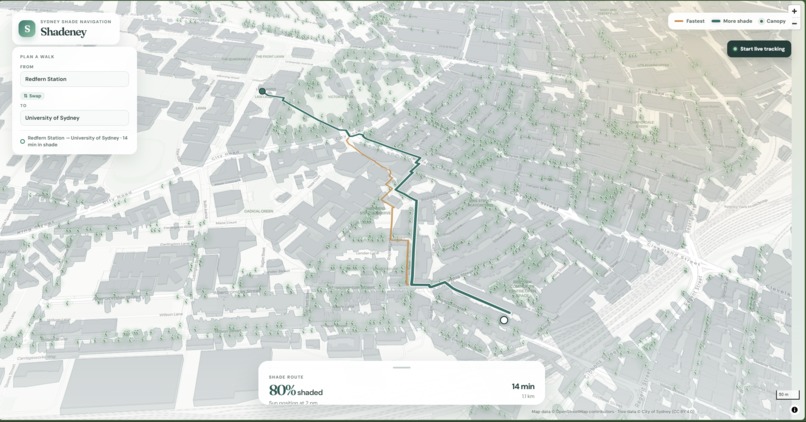
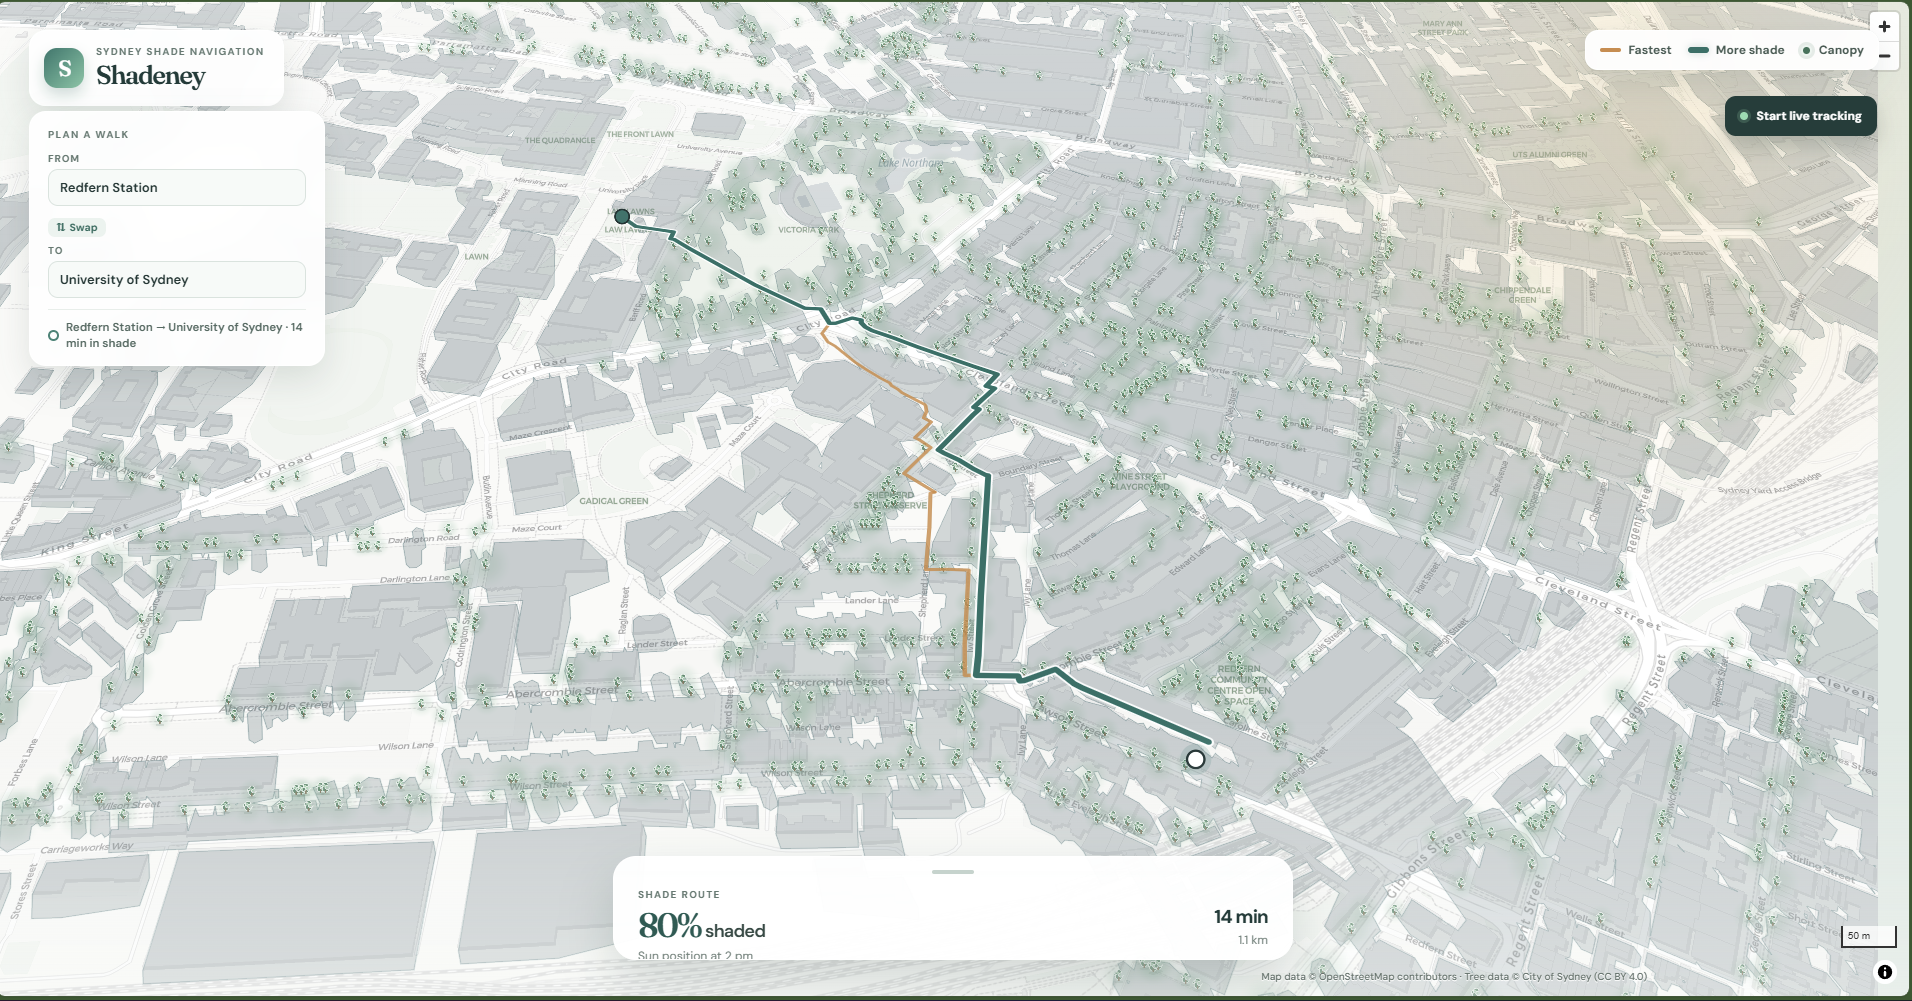
Website view on laptop
-
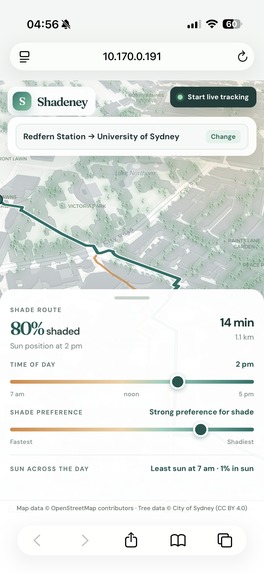
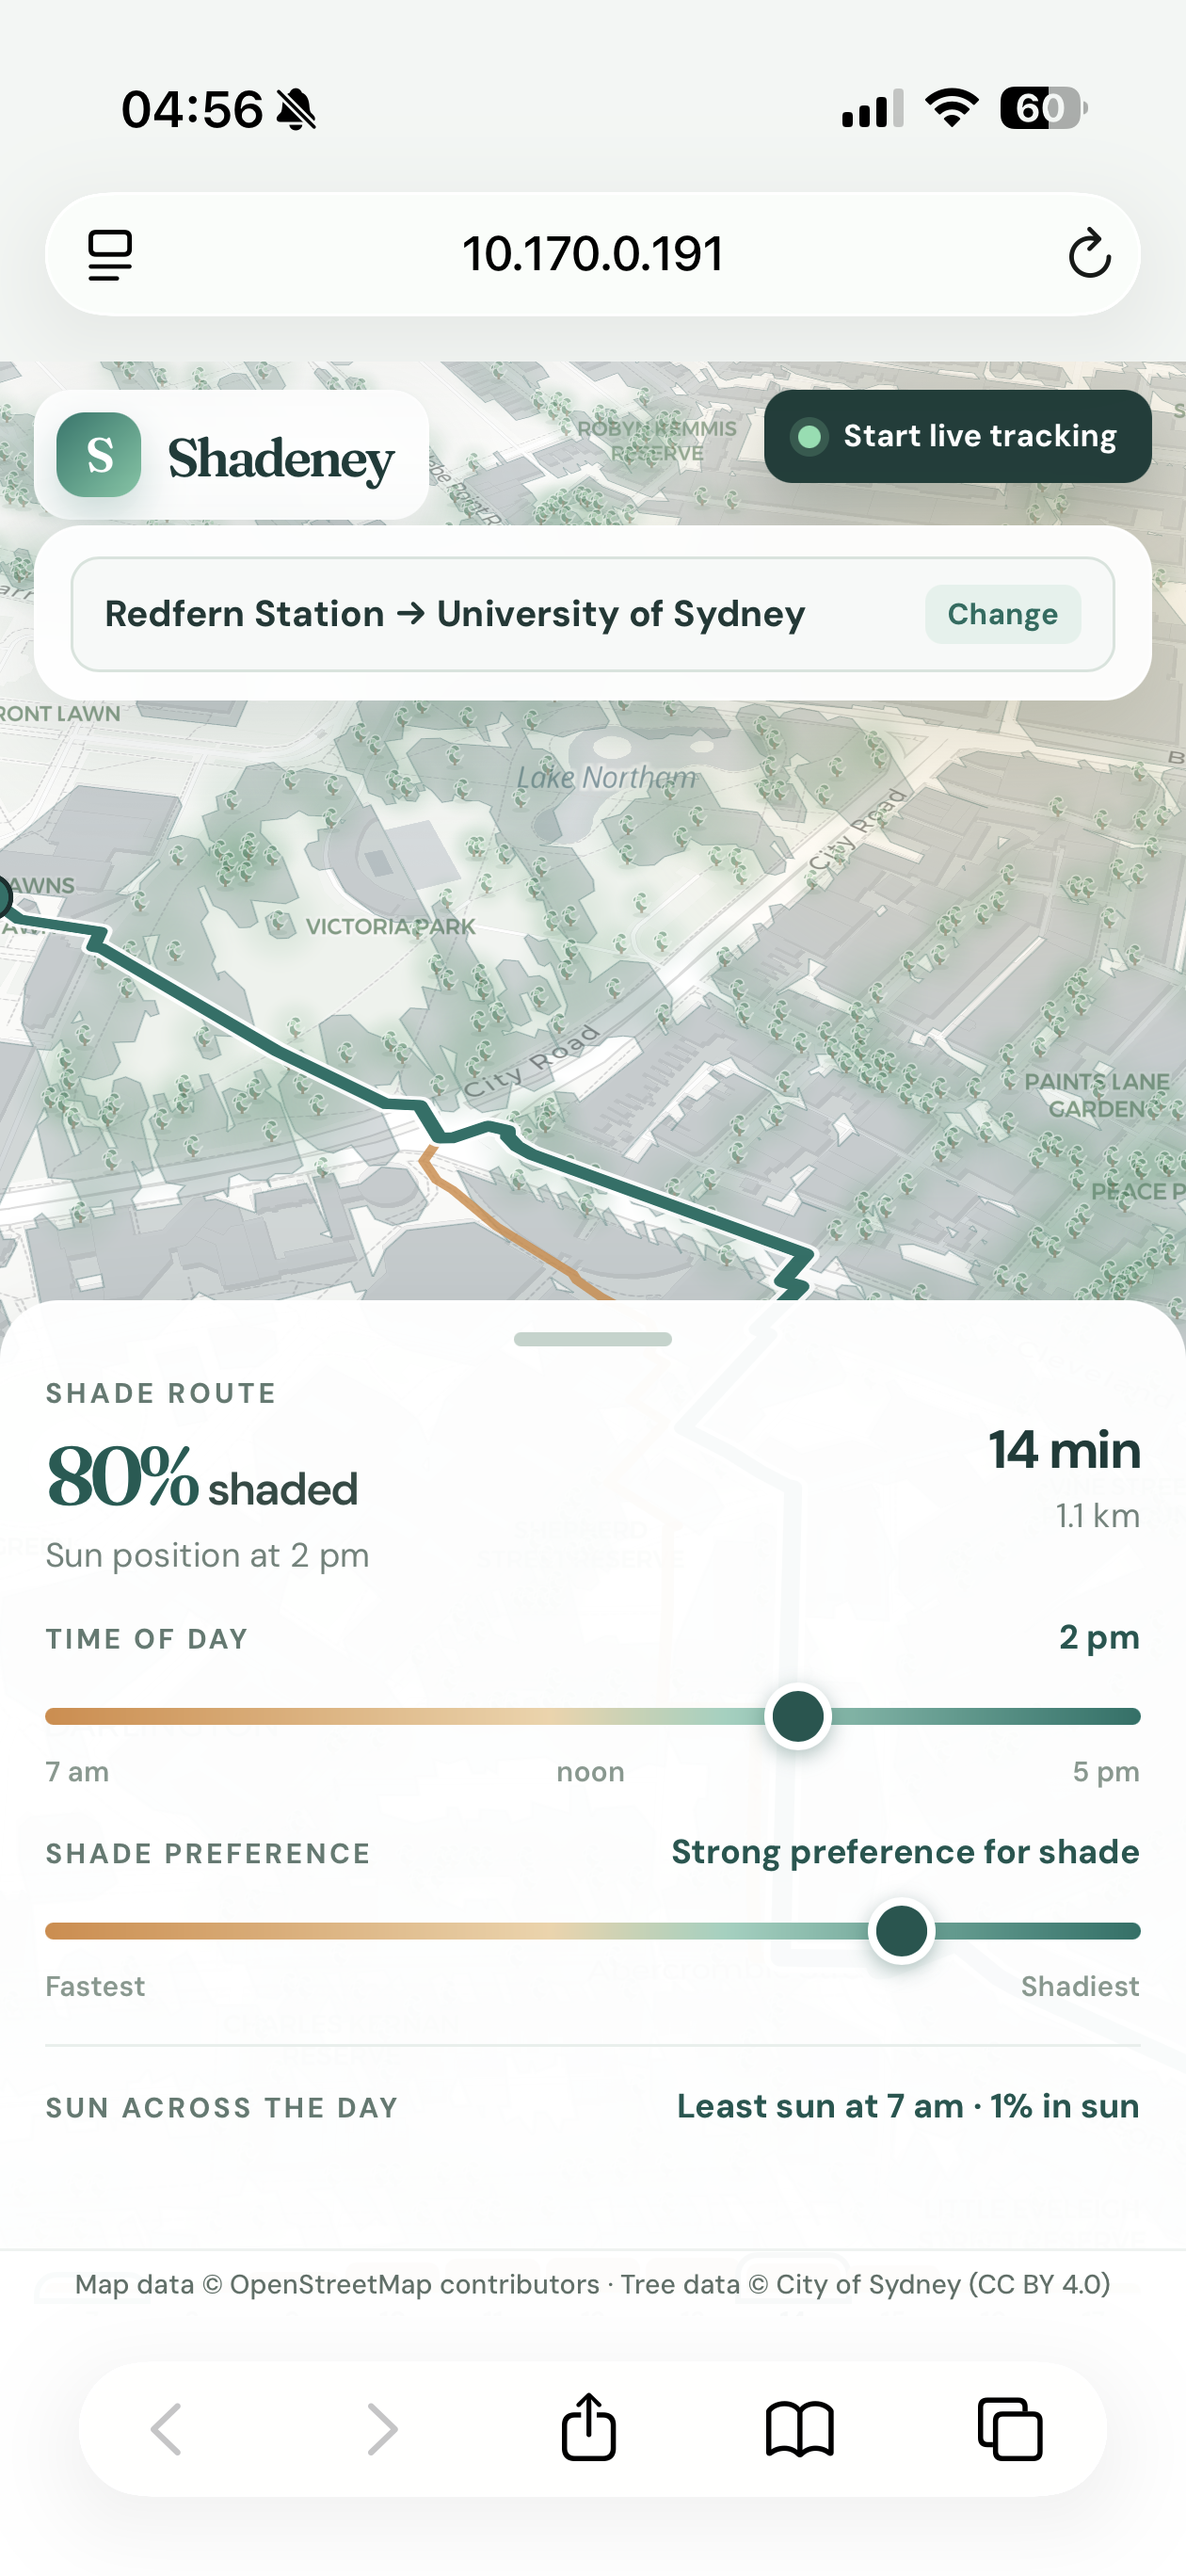
Website view on phone
-
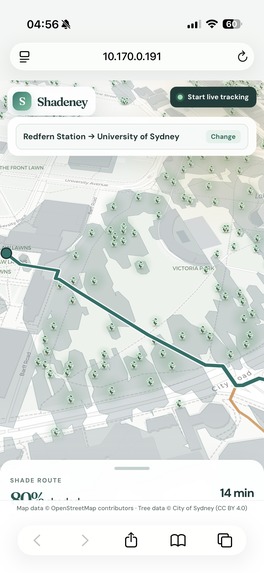
trees are more visible when zoom in
-
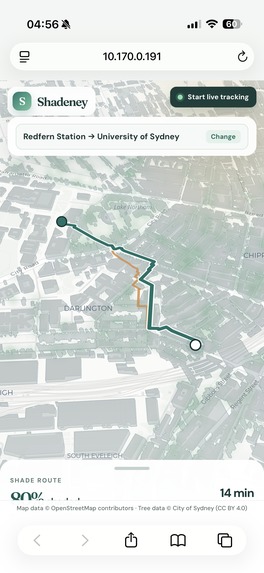
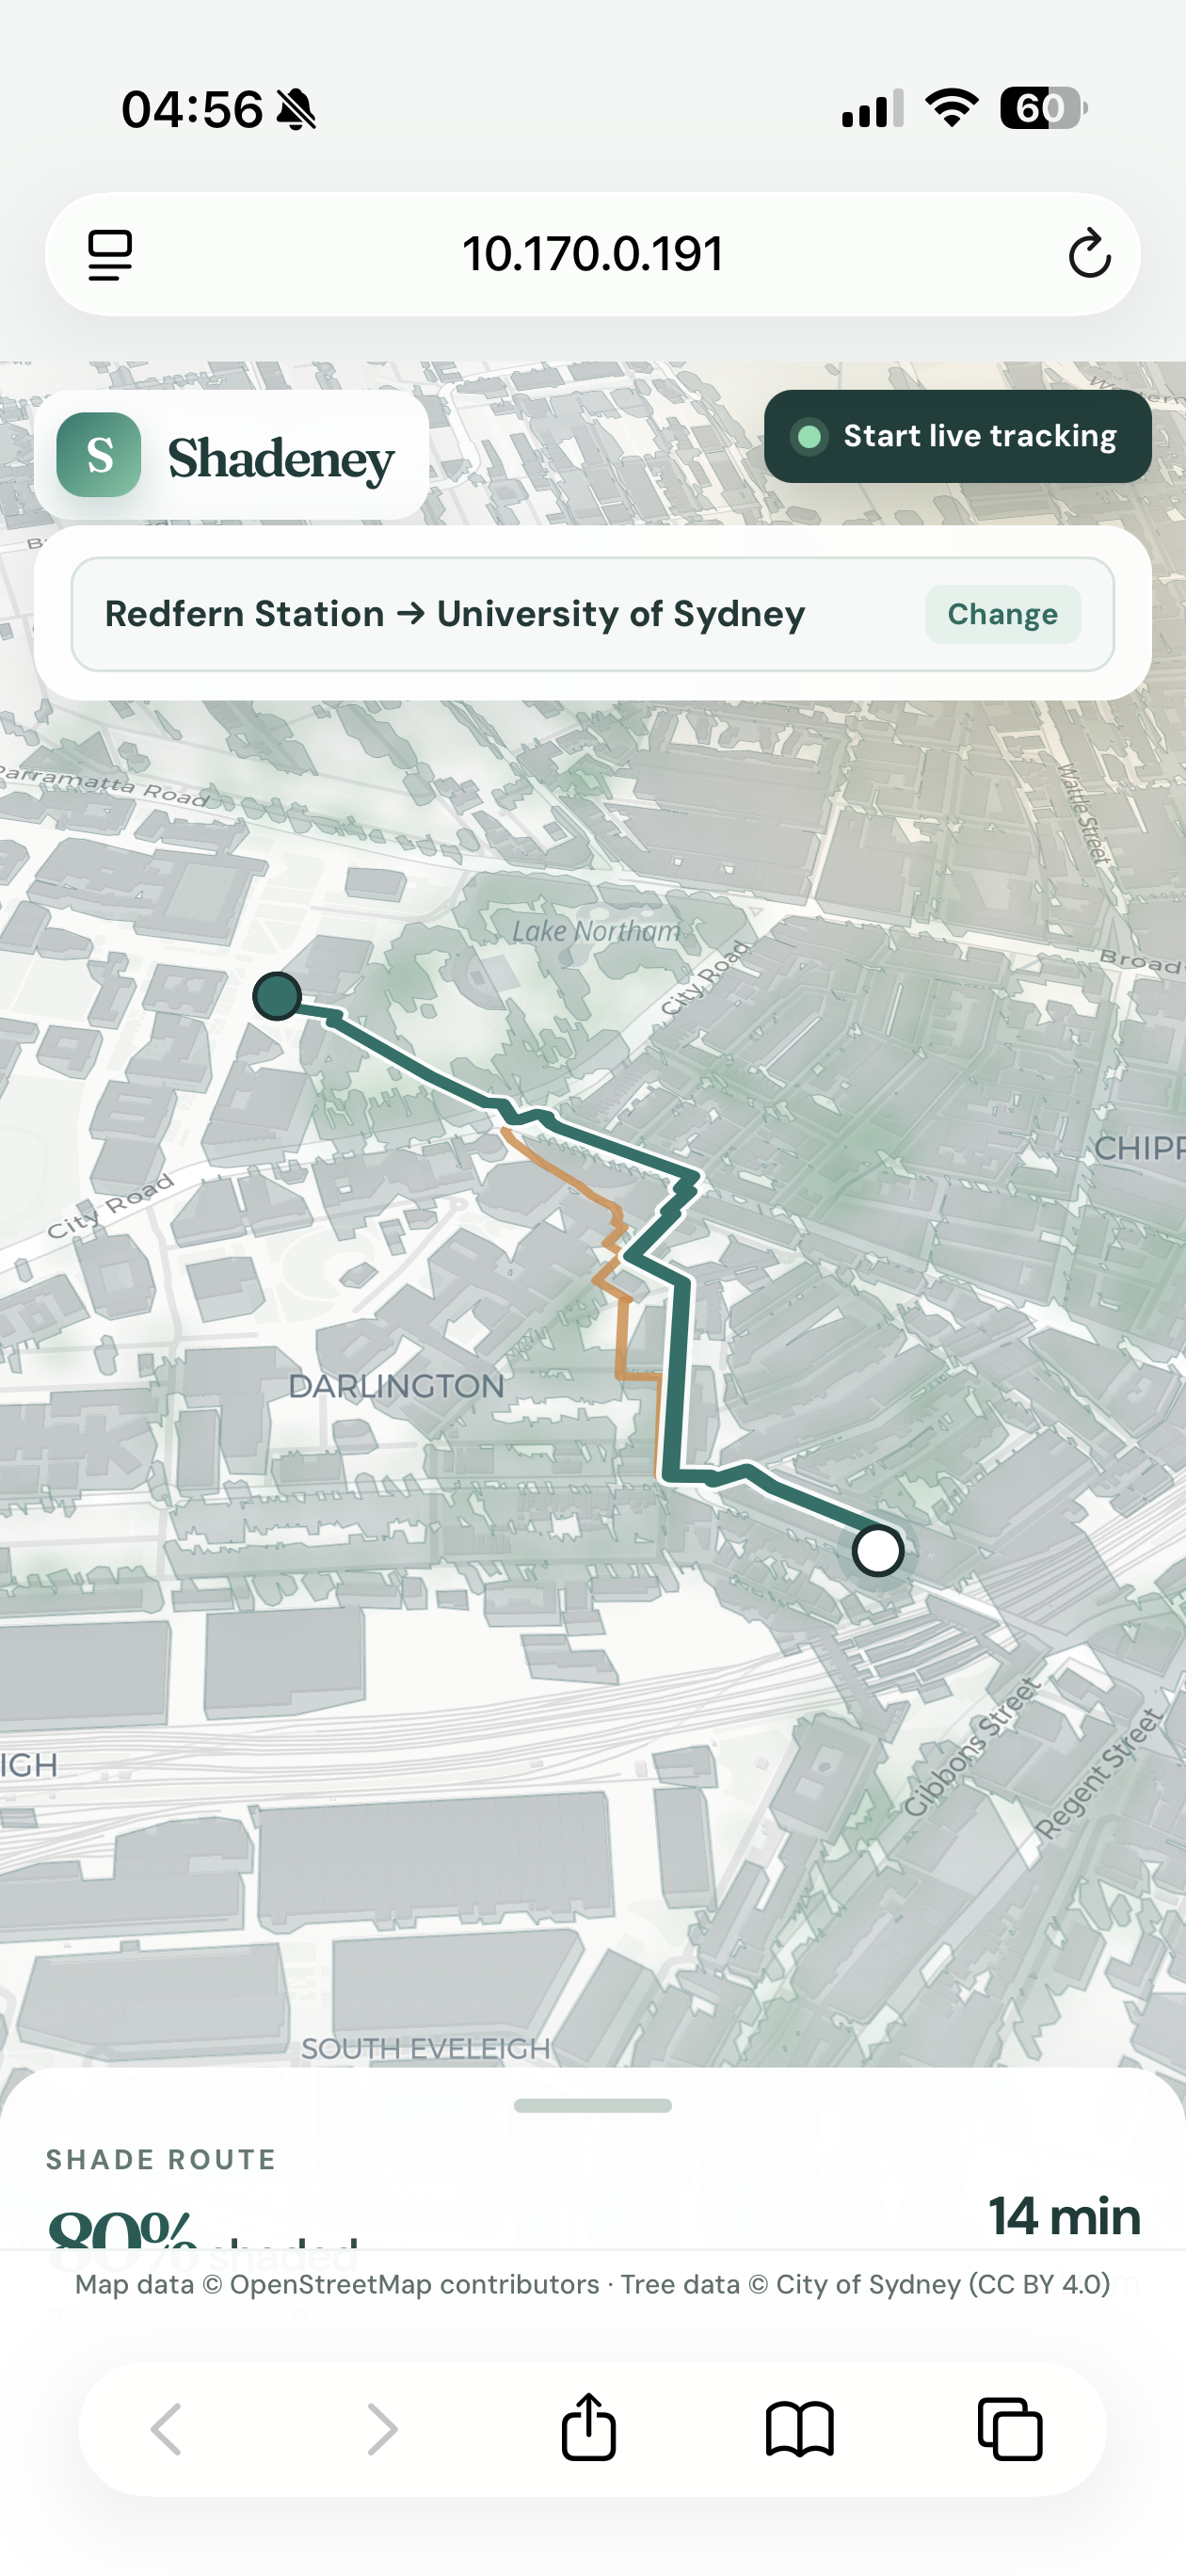
Website view on phone

Inspiration
Sydney is a city you walk, and for six months of the year it is a city you walk squinting. Every map app answers one question — what is fastest — and treats a 1.1 km walk down a bare arterial as identical to the same distance under street trees. It is not identical.
Shade is one of the blocks that make up our world: unevenly distributed, invisible in every dataset people actually use, and quietly deciding who walks and who doesn't. For older people, parents with prams, people with light-sensitive conditions, or anyone in a wheelchair sitting lower and closer to hot pavement, a shaded route isn't a preference.
What it does
Shadeney gives you two walking routes and lets you choose: the fastest, or the one that keeps you out of direct sun. Move the time-of-day slider and the map redraws — shade at 9am and shade at 4pm are different cities.
On our demo route, Redfern Station to the University of Sydney:
| route | distance | time | in direct sun |
|---|---|---|---|
| fastest | 1070 m | 13 min | 356 m |
| cooler | 1113 m | 14 min | 220 m |
43 metres and one minute more, for 38% less direct sun.
How we built it
There is no dataset of where the shade is, so we computed one.
- Geometry — 10,479 building footprints and 23,655 City of Sydney street trees, projected to metres (EPSG:7856).
- Solar position — real ephemeris via pvlib for every hour from 06:00 to 19:00.
- Shadow casting — each footprint and tree canopy swept along its shadow vector (length
height / tan(elevation), direction opposite the sun), then dissolved into one shadow layer per hour. - Exposure — 30,670 walkable footpath segments intersected against that layer by real geometric difference, not point sampling.
- Routing — Dijkstra over the walk graph, edge cost blending travel time against sun exposure.
The result is 30,670 segments × 14 hours, loaded once at startup. Routes return in about 170 ms.
Challenges we ran into
A wrong shade model looks exactly like a right one. A sign error in the shadow direction produces shadows of the correct length pointing the wrong way, and nothing appears broken. We pinned the direction on both axes with tests and treated a symmetric exposure curve peaking at solar noon as the signature of correct solar geometry.
Trees are not a detail. Adding canopy dropped mean exposure at 07:00 from 0.205 to 0.137 — a third of this city's shade is trees, not buildings. The tree service also caps at 2,000 records per request, so a naive single fetch silently loses 70% of the canopy and still looks plausible.
The pipeline left 15 of 16 cores idle for 19 minutes. The hours share no state, so we parallelised them: 1120s to 193s. We verified the output was byte-identical to the sequential run across all 429,324 values rather than trusting the speedup.
A black map with an empty console. Vite's dependency pre-bundling silently 404'd MapLibre's web worker, so no vector tile could ever be parsed. Every network request returned 200 while nothing rendered.
What we learned
Shade is not the same as no UV. About 45% of ground-level UV is diffuse skylight, so a building's shadow blocks the beam but not the sky. When we added a live UV feed from ARPANSA, the honest dose reduction on our route came out at 8%, not 38% — partly because the shadier route is also longer, and that extra time accrues diffuse UV. Both numbers are real but they answer different questions: 38% is about heat and glare, 8% is about skin. We kept both, labelled separately, rather than quoting the flattering one.
Most of our own data is estimated, and saying so is better than hiding it. Only 1.4% of building heights in our area are surveyed; 44% come from floor counts, 29% from building type, and 26% are a generic default. The tree data, by contrast, is nearly complete — 5 fallbacks across 23,655 trees. Our best-measured input does the heaviest lifting; our weakest one is the buildings.
What's next
- On-demand corridors. Routes outside the precomputed area can be fetched and computed live in about 3.4 seconds of compute. We built it and left it out of the demo because it depends on a public API whose latency we measured at anywhere from 5 seconds to a hard timeout.
- Partial canopy transmission — we treat trees as opaque; leaf density and season would sharpen it.
- Heat, not just sun. Surface temperature and wind would turn a shade model into a real thermal comfort model.
Data & attribution
- Footpaths and buildings: © OpenStreetMap contributors (ODbL 1.0)
- Street trees: © City of Sydney (CC BY 4.0)
- Live UV index: ARPANSA
- Basemap: CARTO
Built With
- fastapi
- geojson
- geopandas
- javascript
- openstreetmap
- osmnx
- python
- react
- shapely
- vite


Log in or sign up for Devpost to join the conversation.