-
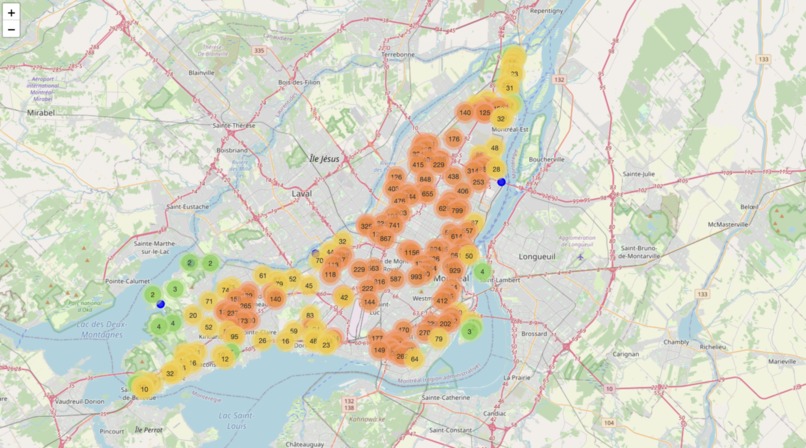
Collision Report
-

Street Parking
-
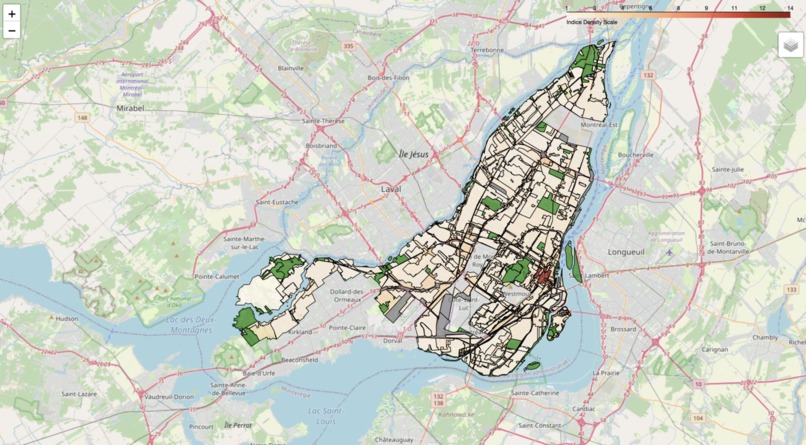
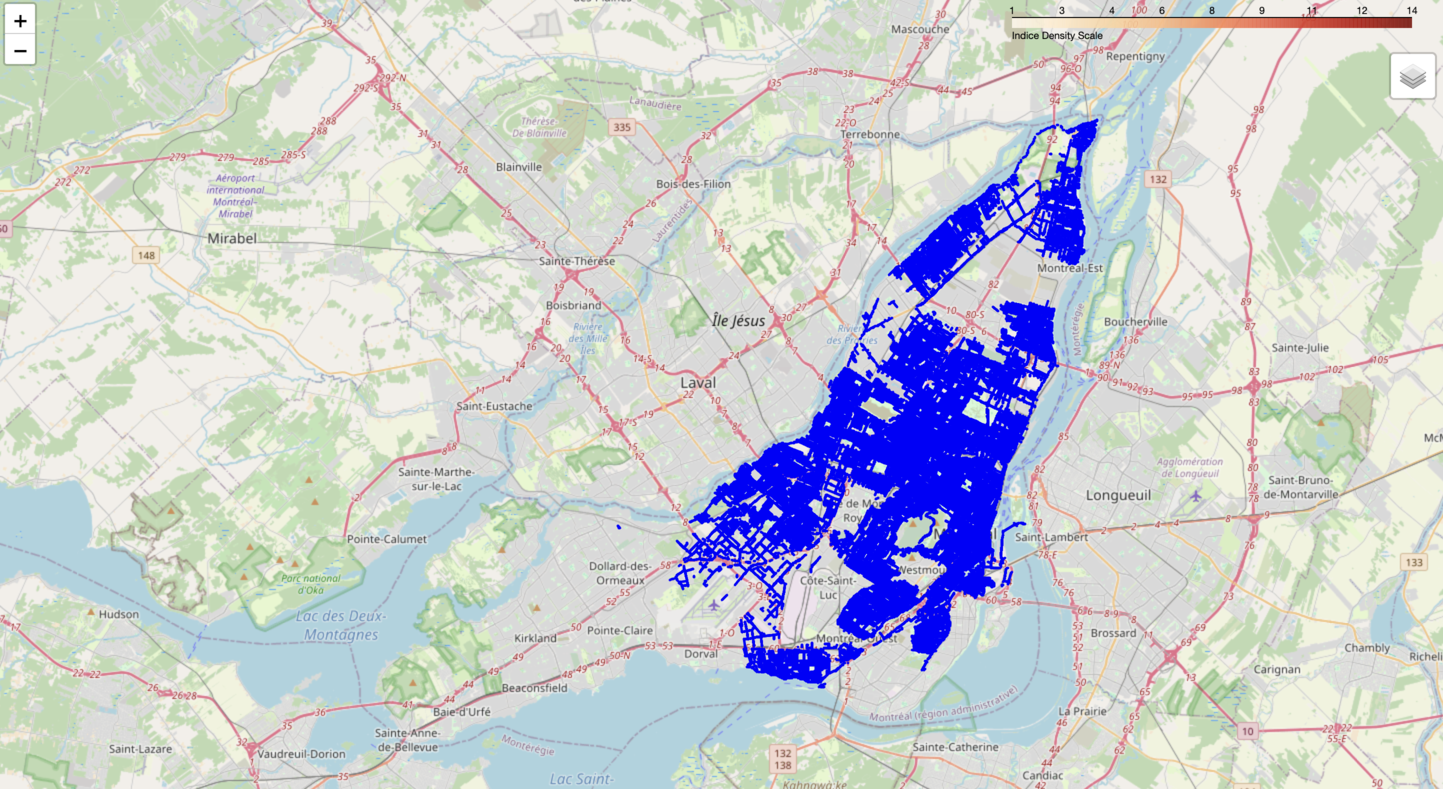
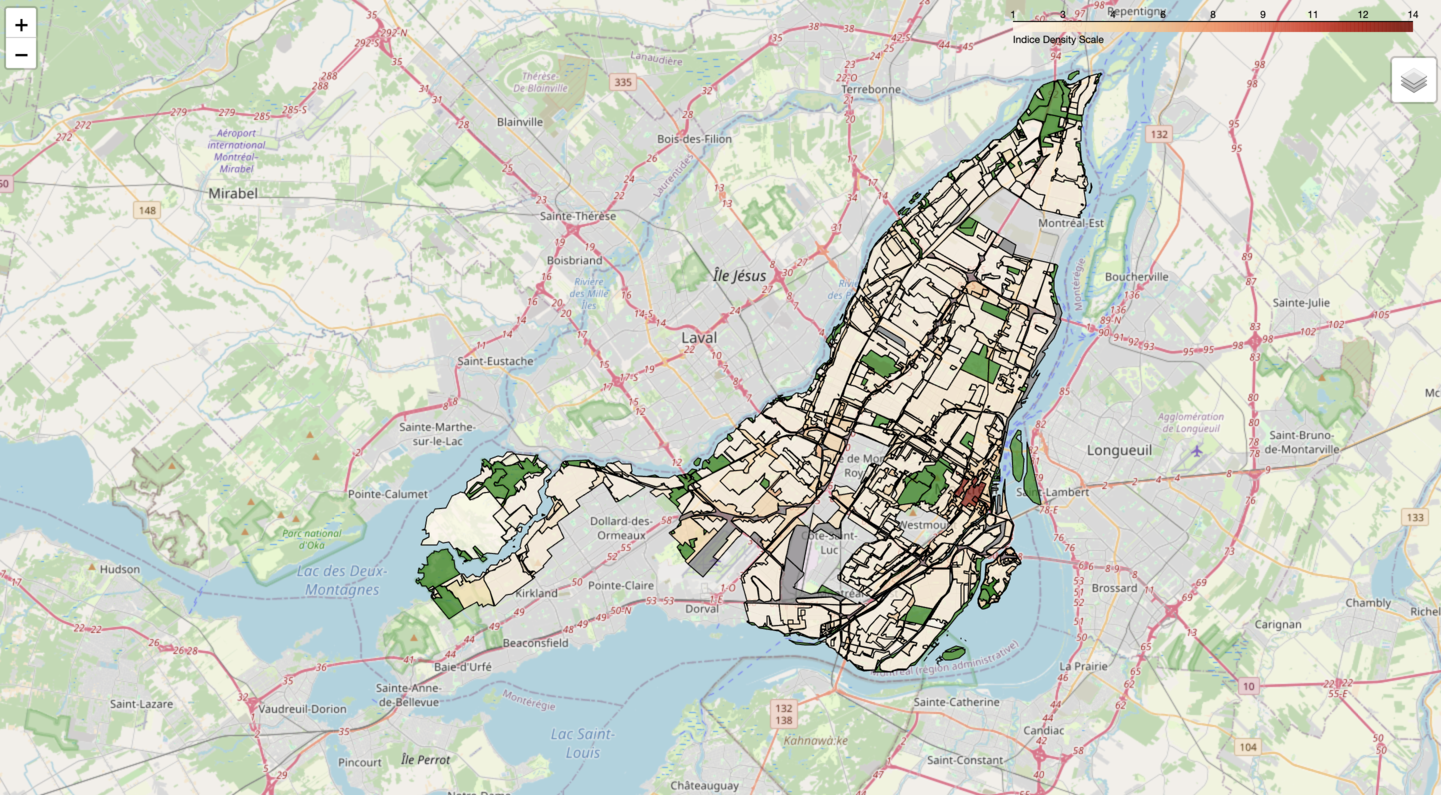
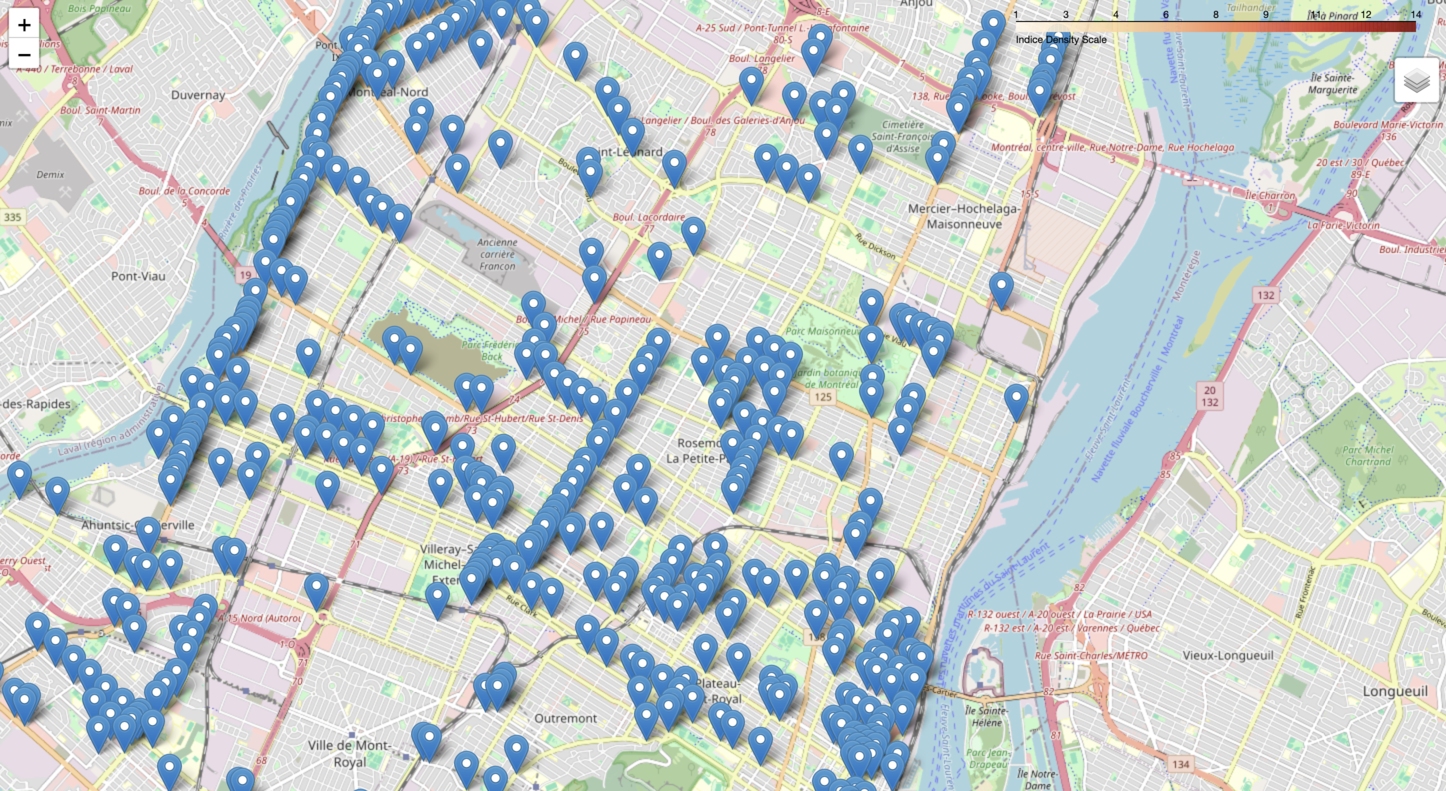
City Density
-
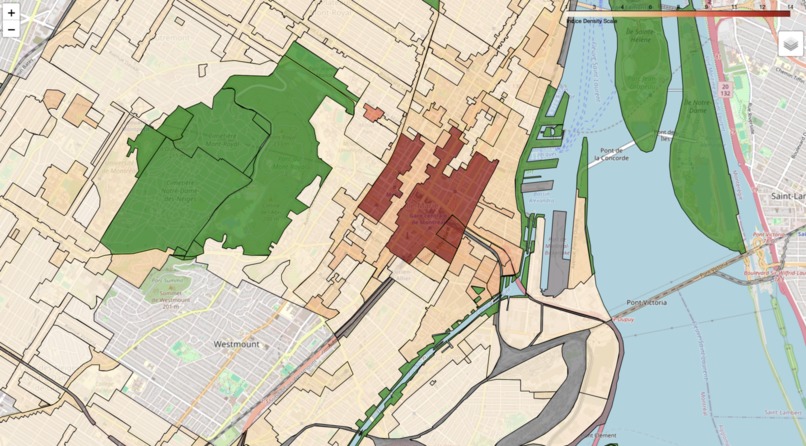
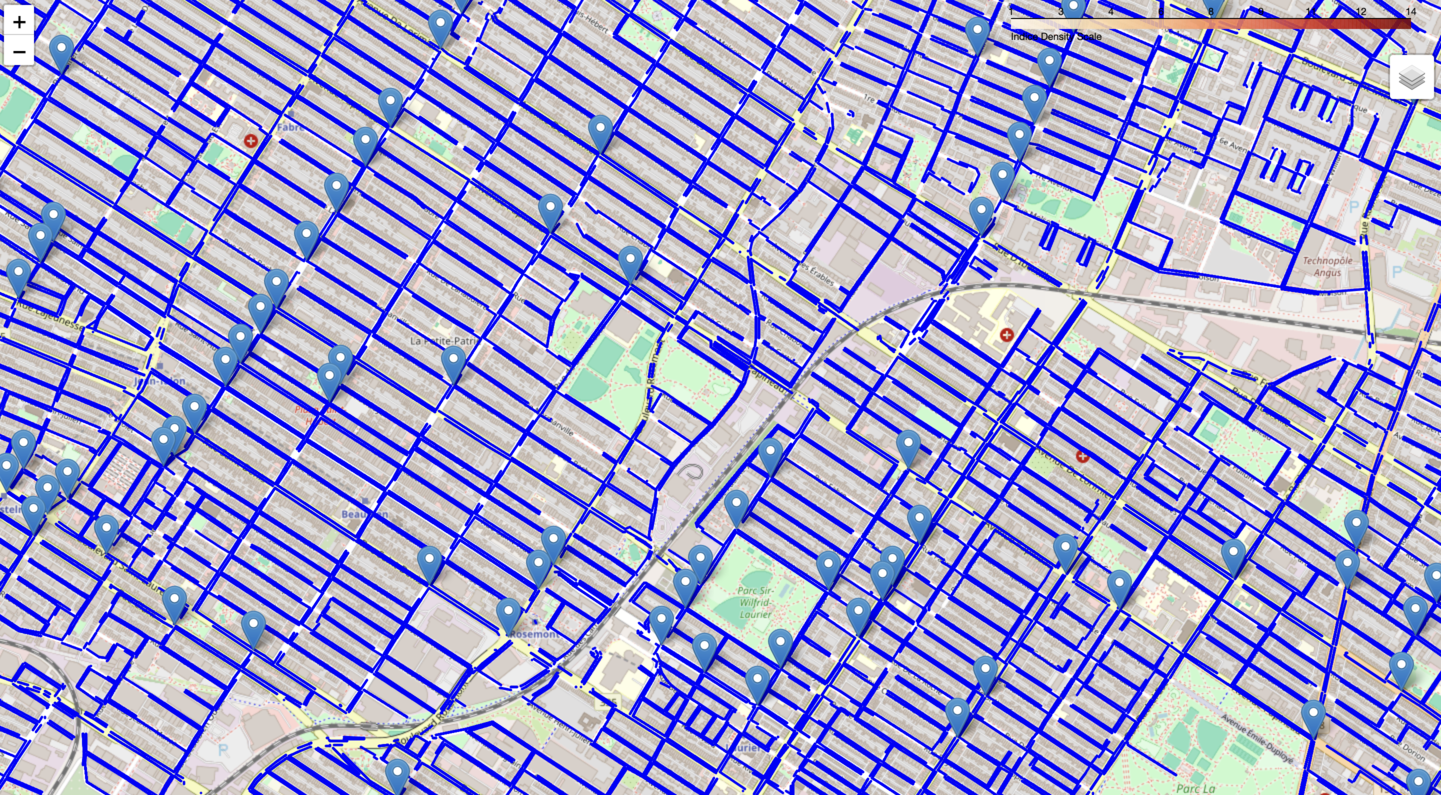
Density Levels - Zoomed In
-
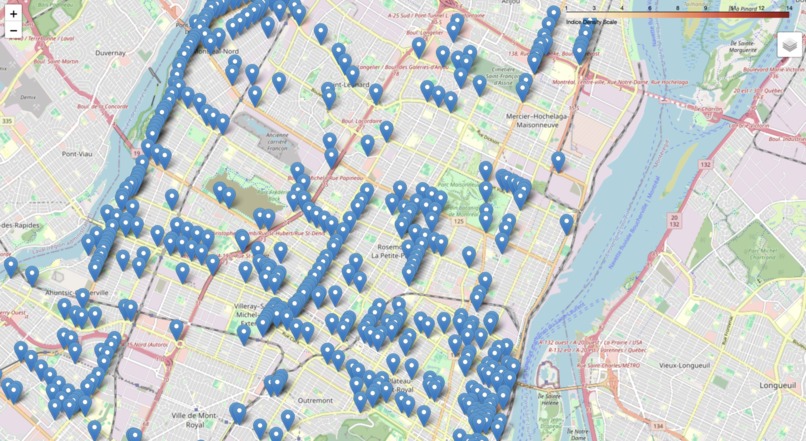
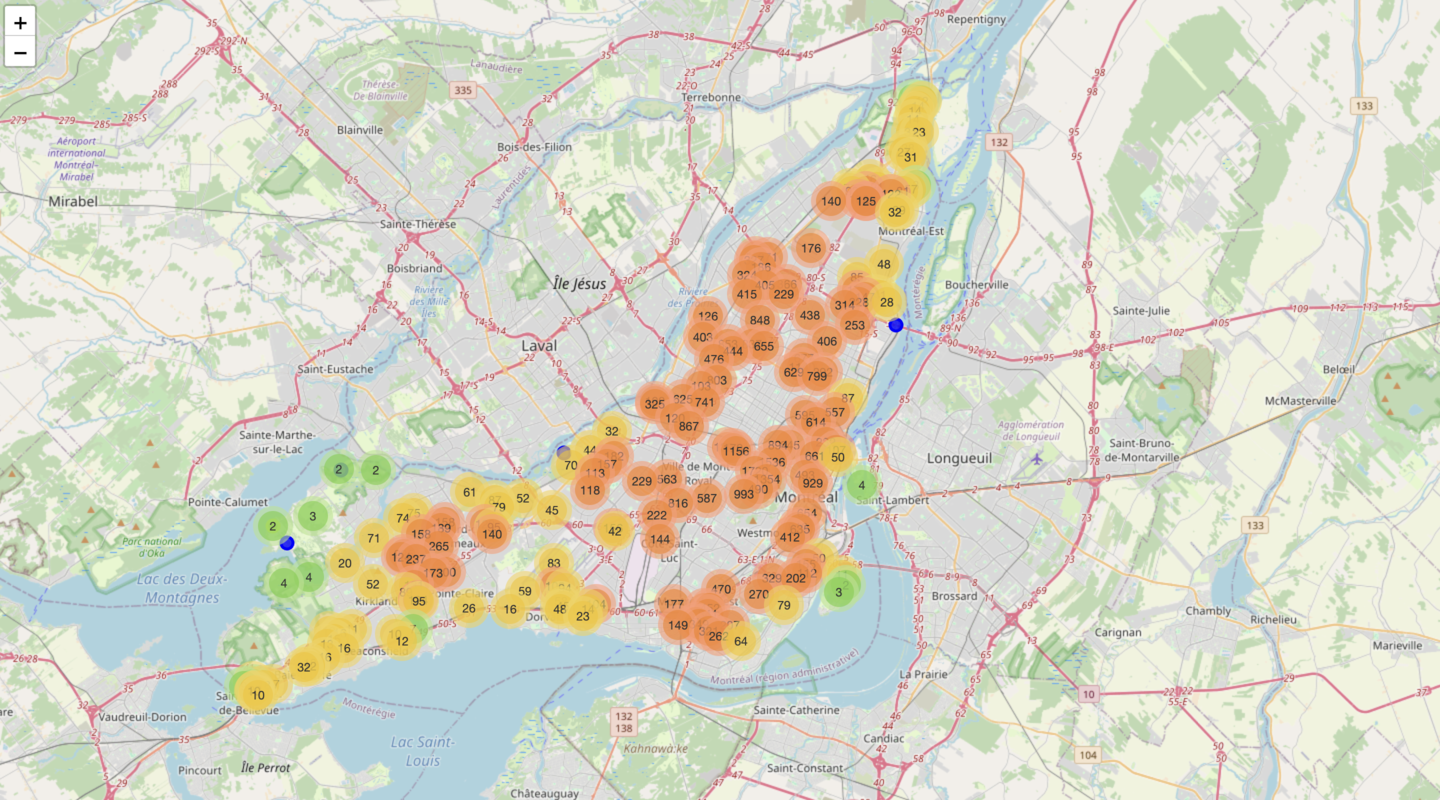
Intersection Busyness Levels
-
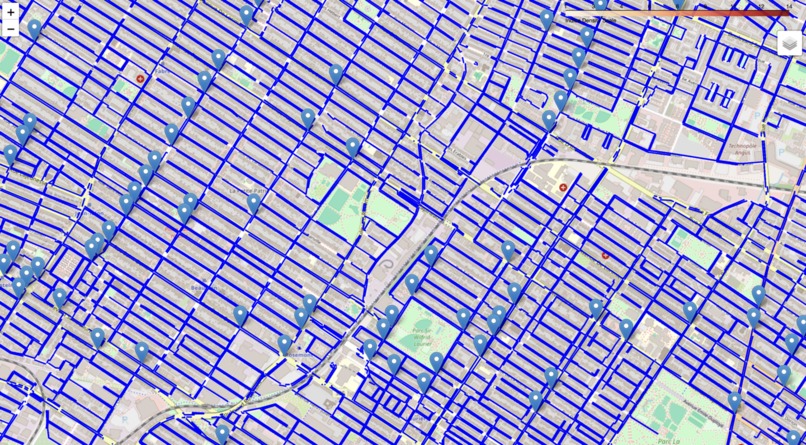
Street Parking - Zoomed In

Inspiration
We wanted to find out where traffic accidents are happening in Montreal to identify patterns that could explain the underlying causes behind the frequency of accidents.
What it does
We overlayed multiple datasets on a map containing data about building density, in-street parking, collision data (aggregated by severity of personal injuries) and busyness level at intersections (with data about # of cyclists, # of bicycles, # of cars and pedestrians)
How we built it
We used data hosted by the City of Montreal and accessed it via their API and HTTPS requests. After preprocessing the data to extract the relevant features, we used Folium to map all the data using the coordinates of each data point.
With Folium we were able to develop a map using different layers that can be toggled and multiple color schemes to make data interpretation more relevant.
Challenges we ran into
We faced issues with the call limits of the API. We could only request up to 30,000 results, yet most datasets contained over 200,000 data points. We also faced the challenge of using Folium for the first time, as we tried to optimize the HTML files with the maps because the more data the map contained, the more time and resources it would need.
Accomplishments that we're proud of
That we finished!! On a serious note, we are proud of developing the start of a tool that can help city planners find hotspot of high collision incidence to foster better street design and safer communities.
What we learned
We learned a lot about data visualization and how to handle geographic data, specifically GeoJSON files. We also explored the complexities of rendering maps with complicated polygons and an abundance of coordinates as it can strain computing resources.
What's next for Car Collisions
We would like to keep adding data to our map, such as the types of vehicles involved in collisions, the distance from the closest emergency dispatch center to problematic areas and predicted response times, etc.
We also want to optimize the way we are rendering our maps on the browser to make sure that our data visualizations are available to everyone regardless of the computer's resources.


Log in or sign up for Devpost to join the conversation.