-
-
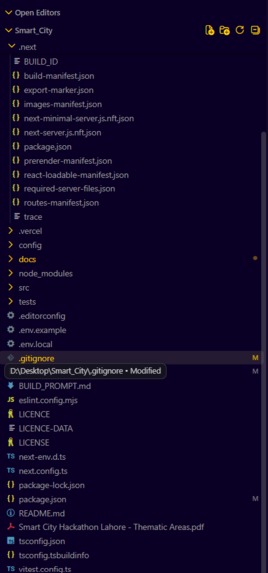
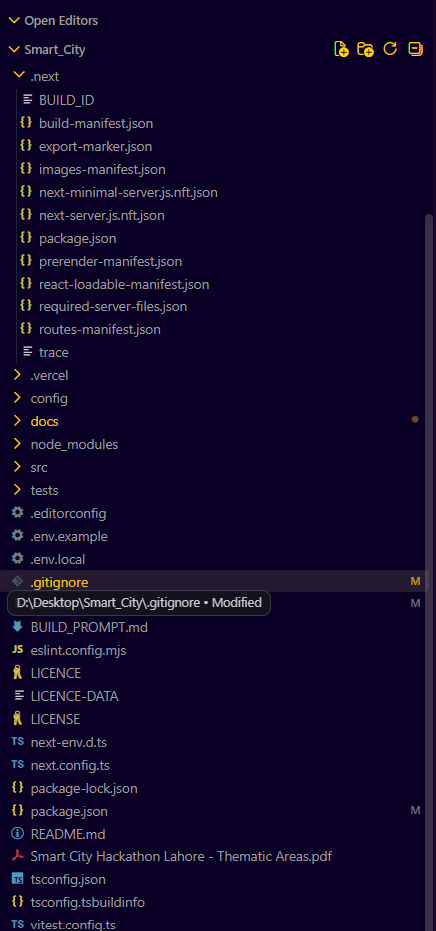
Project Structure
-
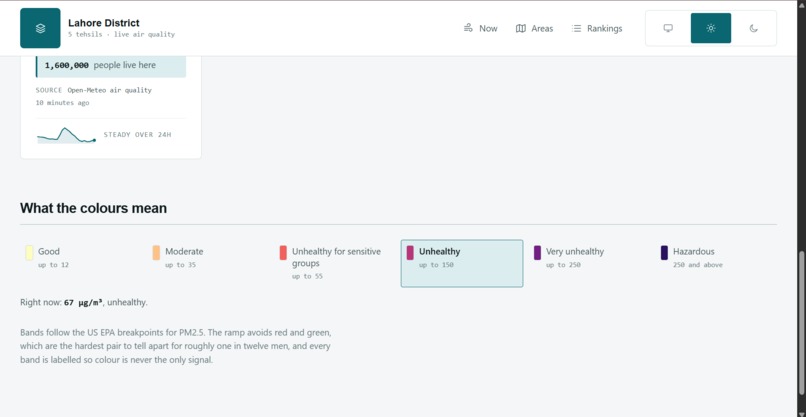
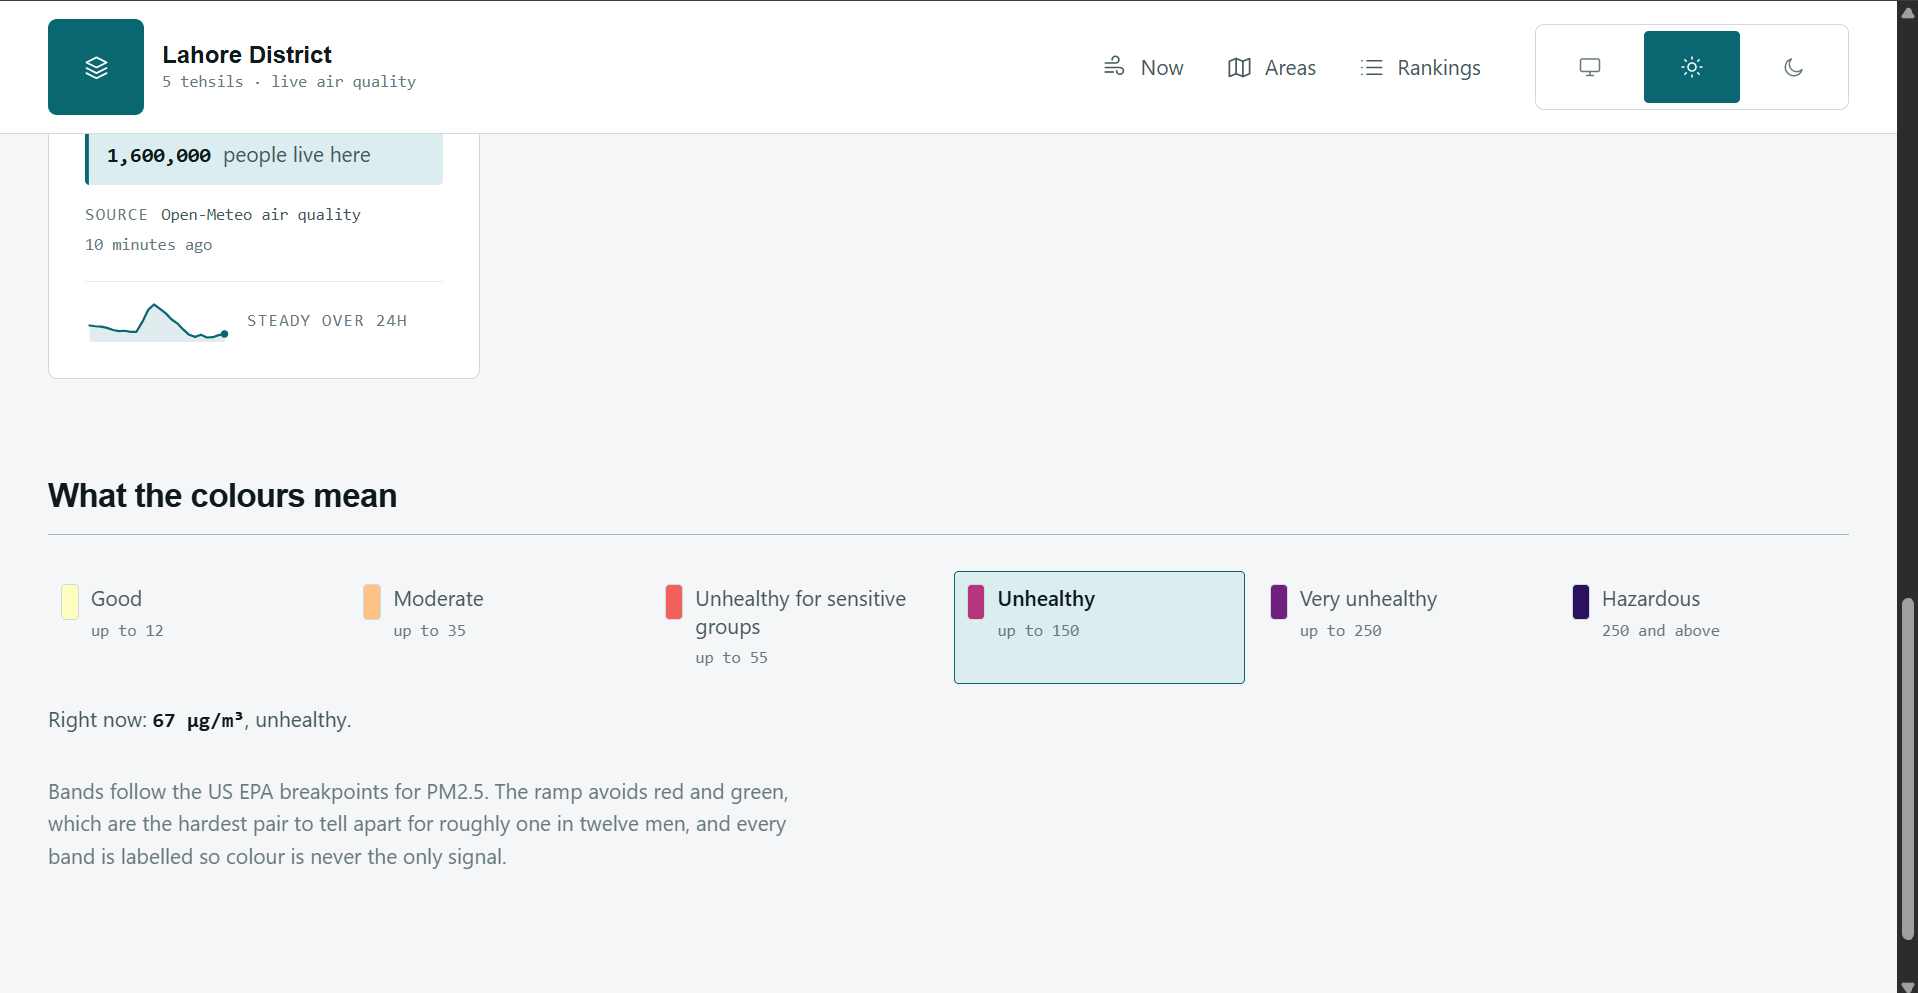
Meaning of colors
-
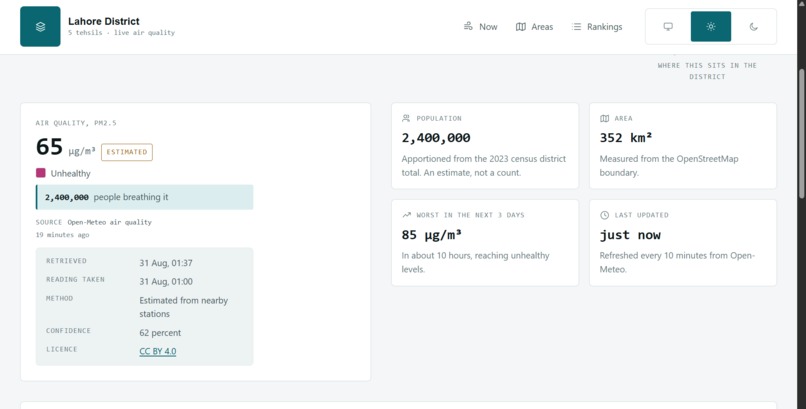
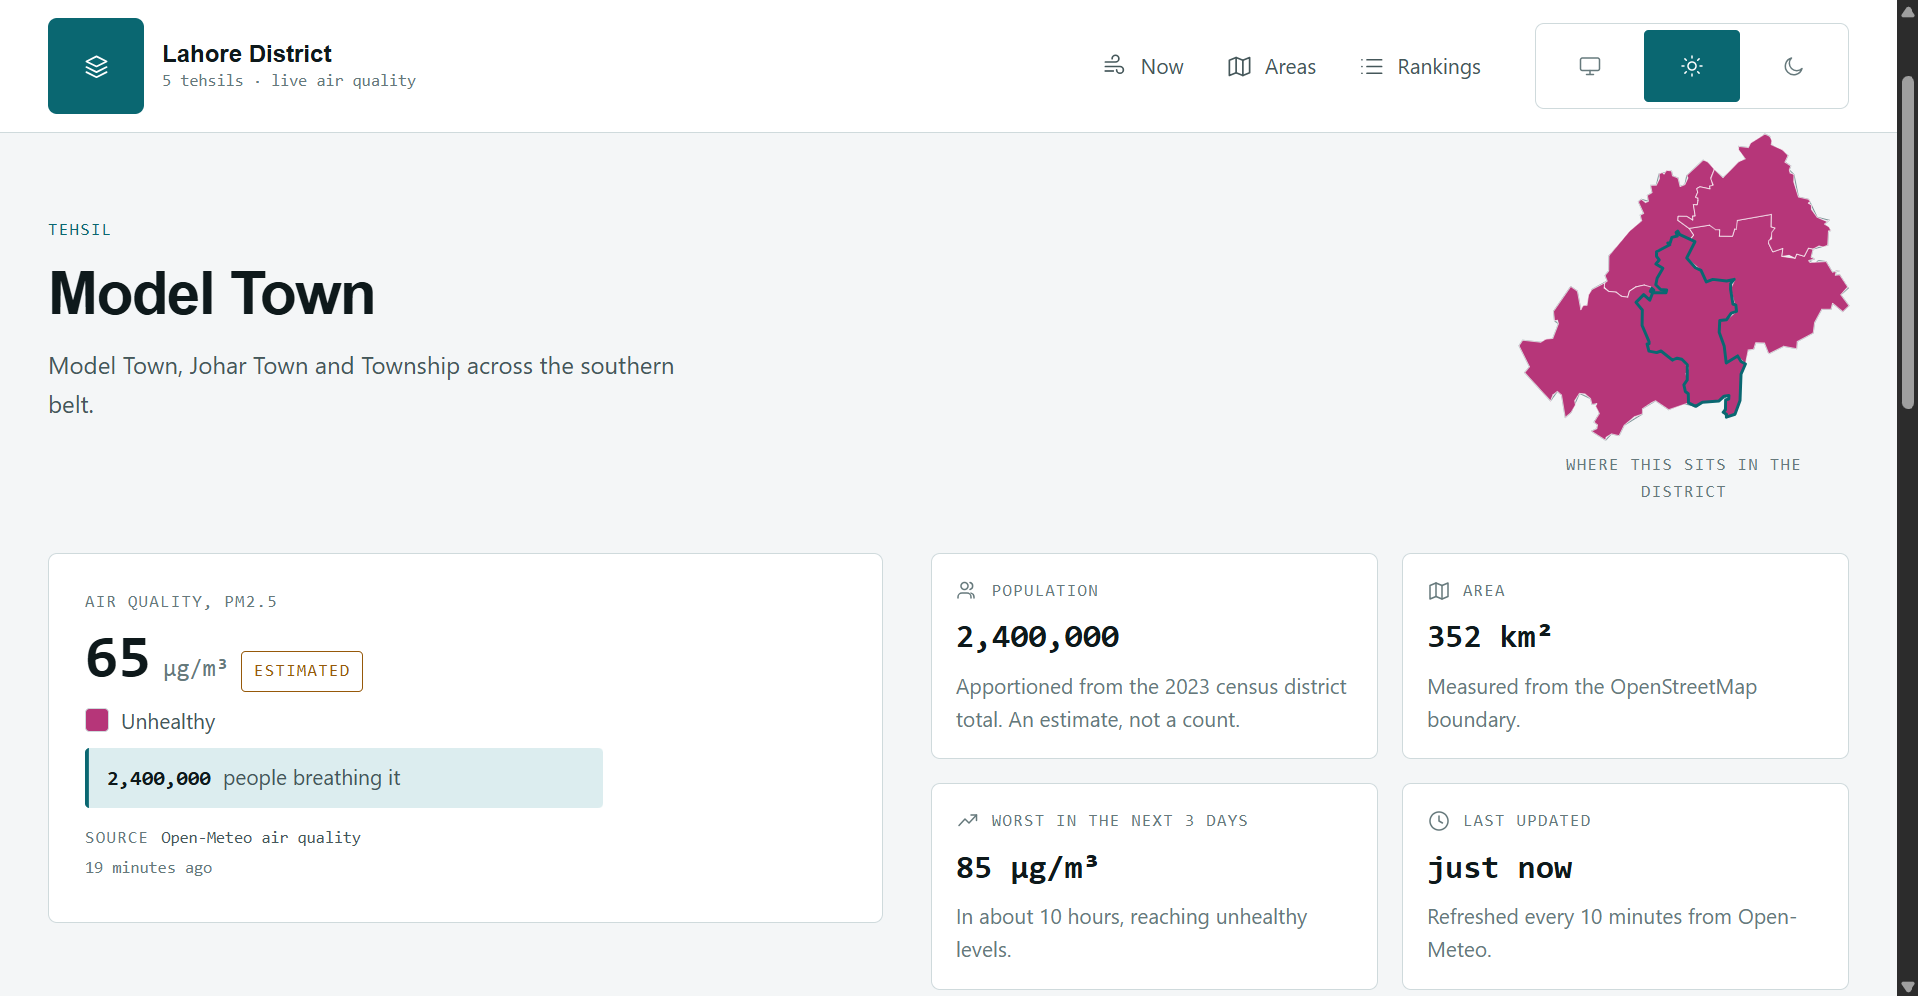
Detail of single Tehseel
-
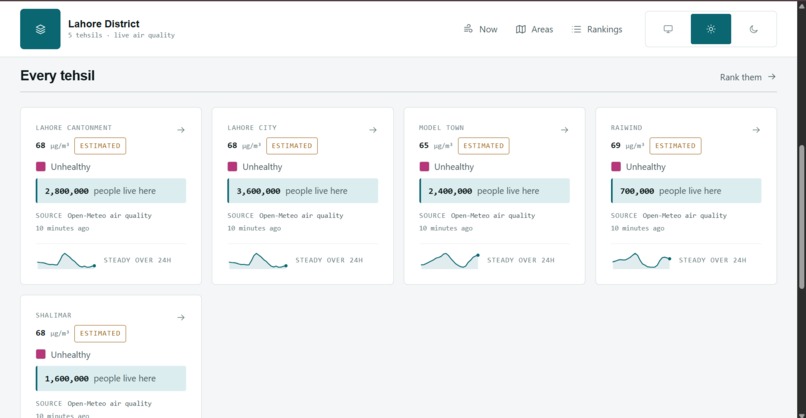
Dashboard
-
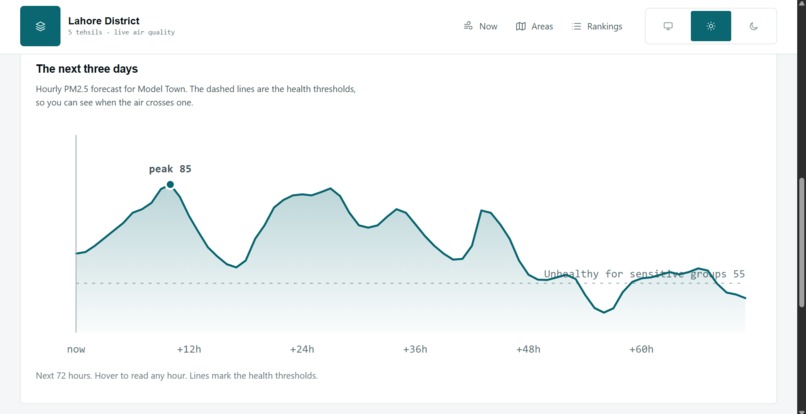
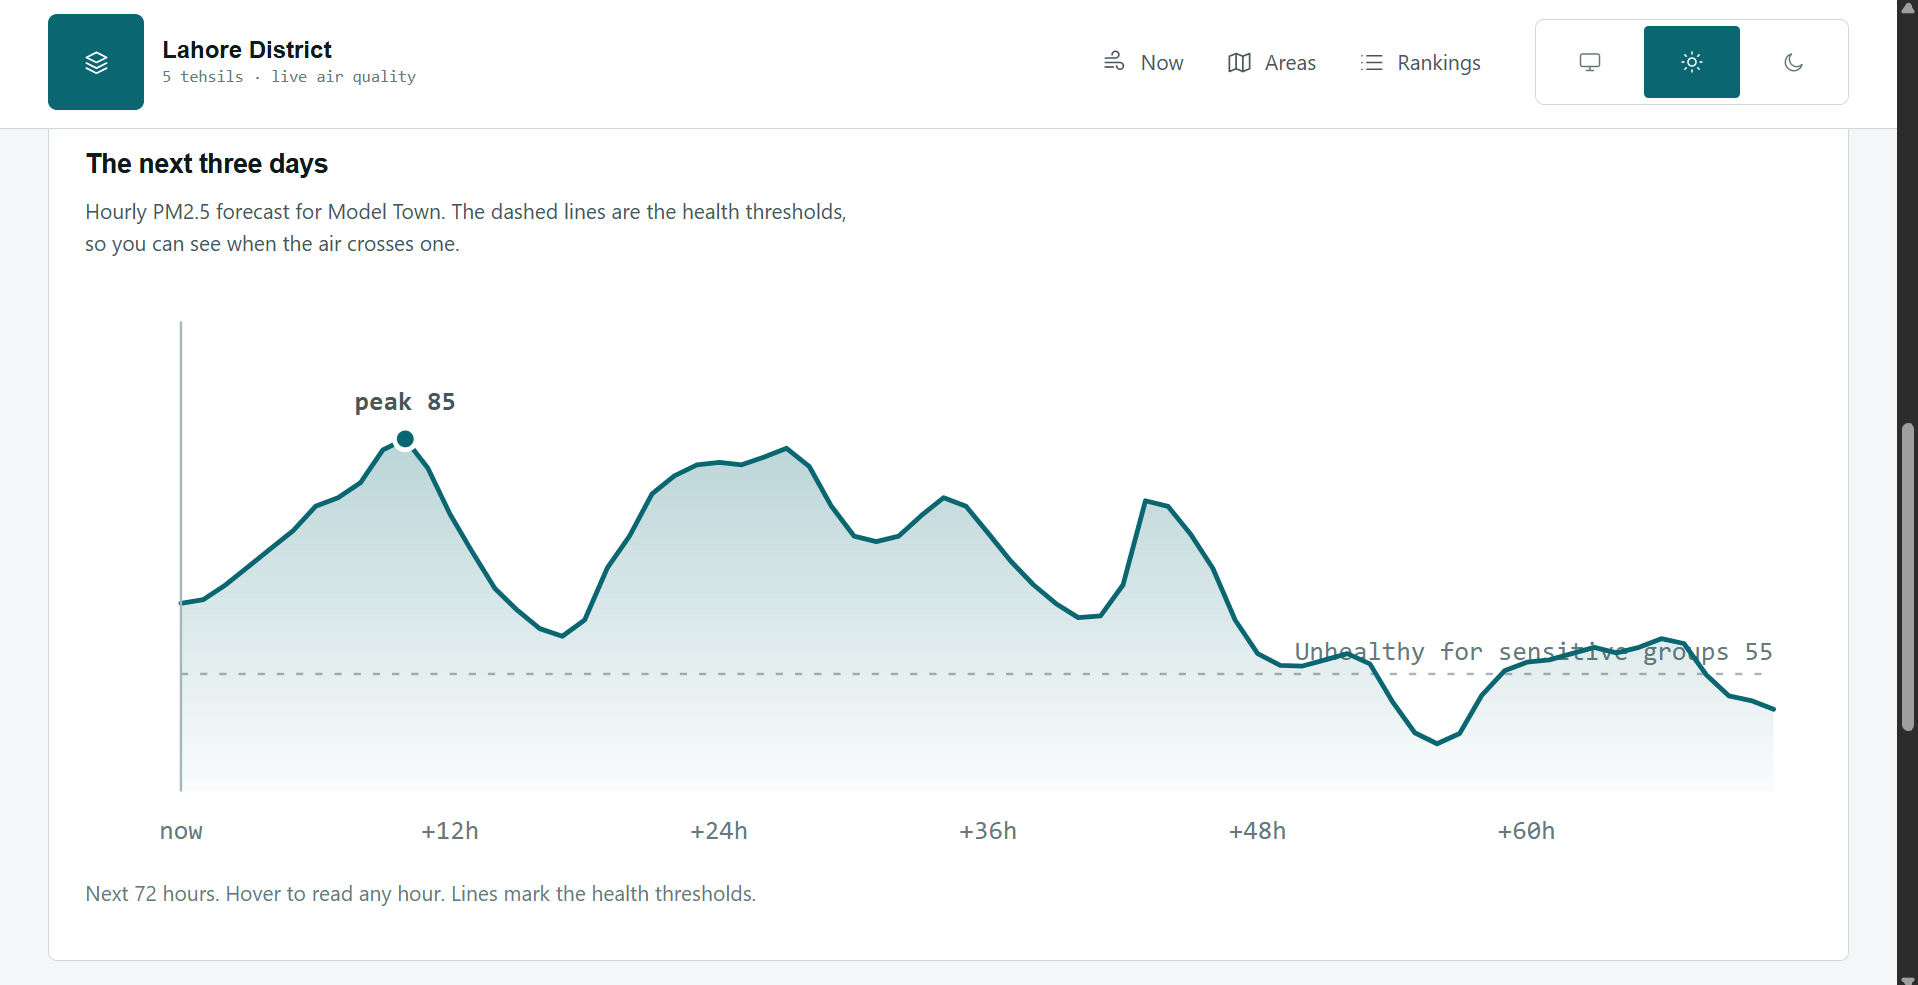
Graphical Representation of Air Quality of Model Town
-
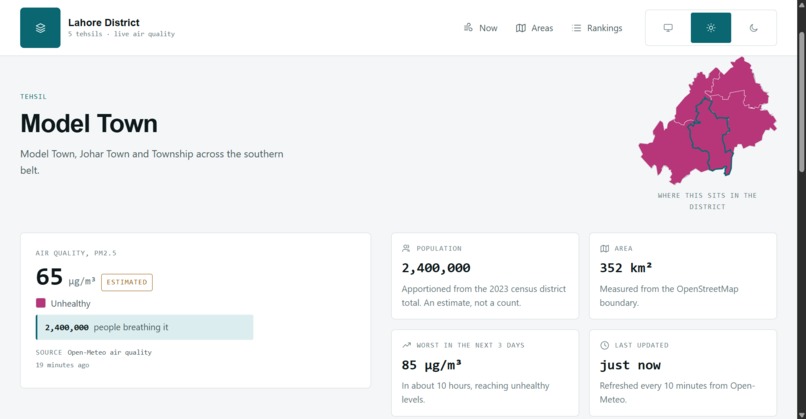
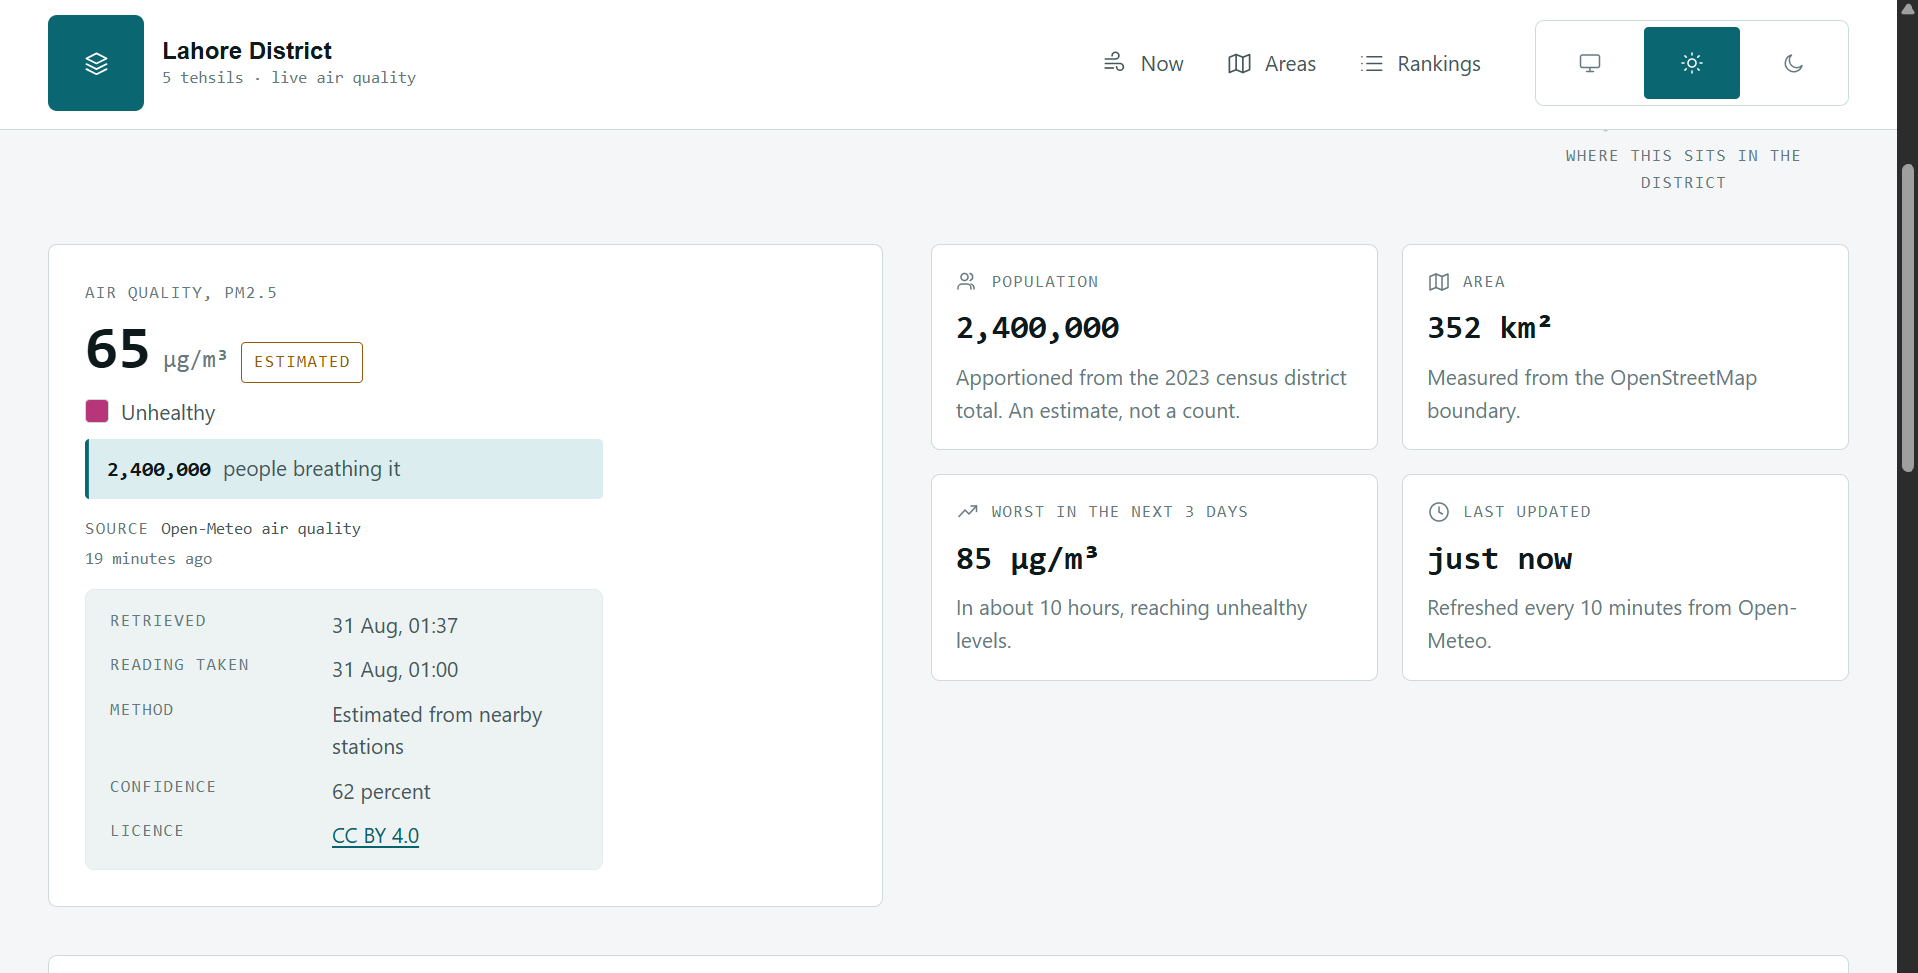
Model Town Details
-
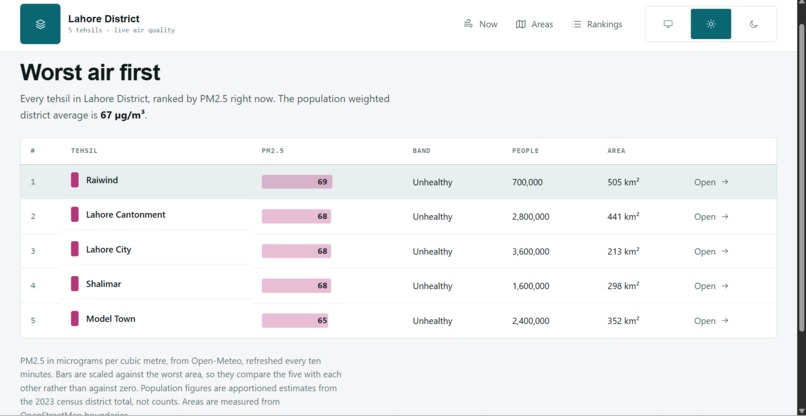
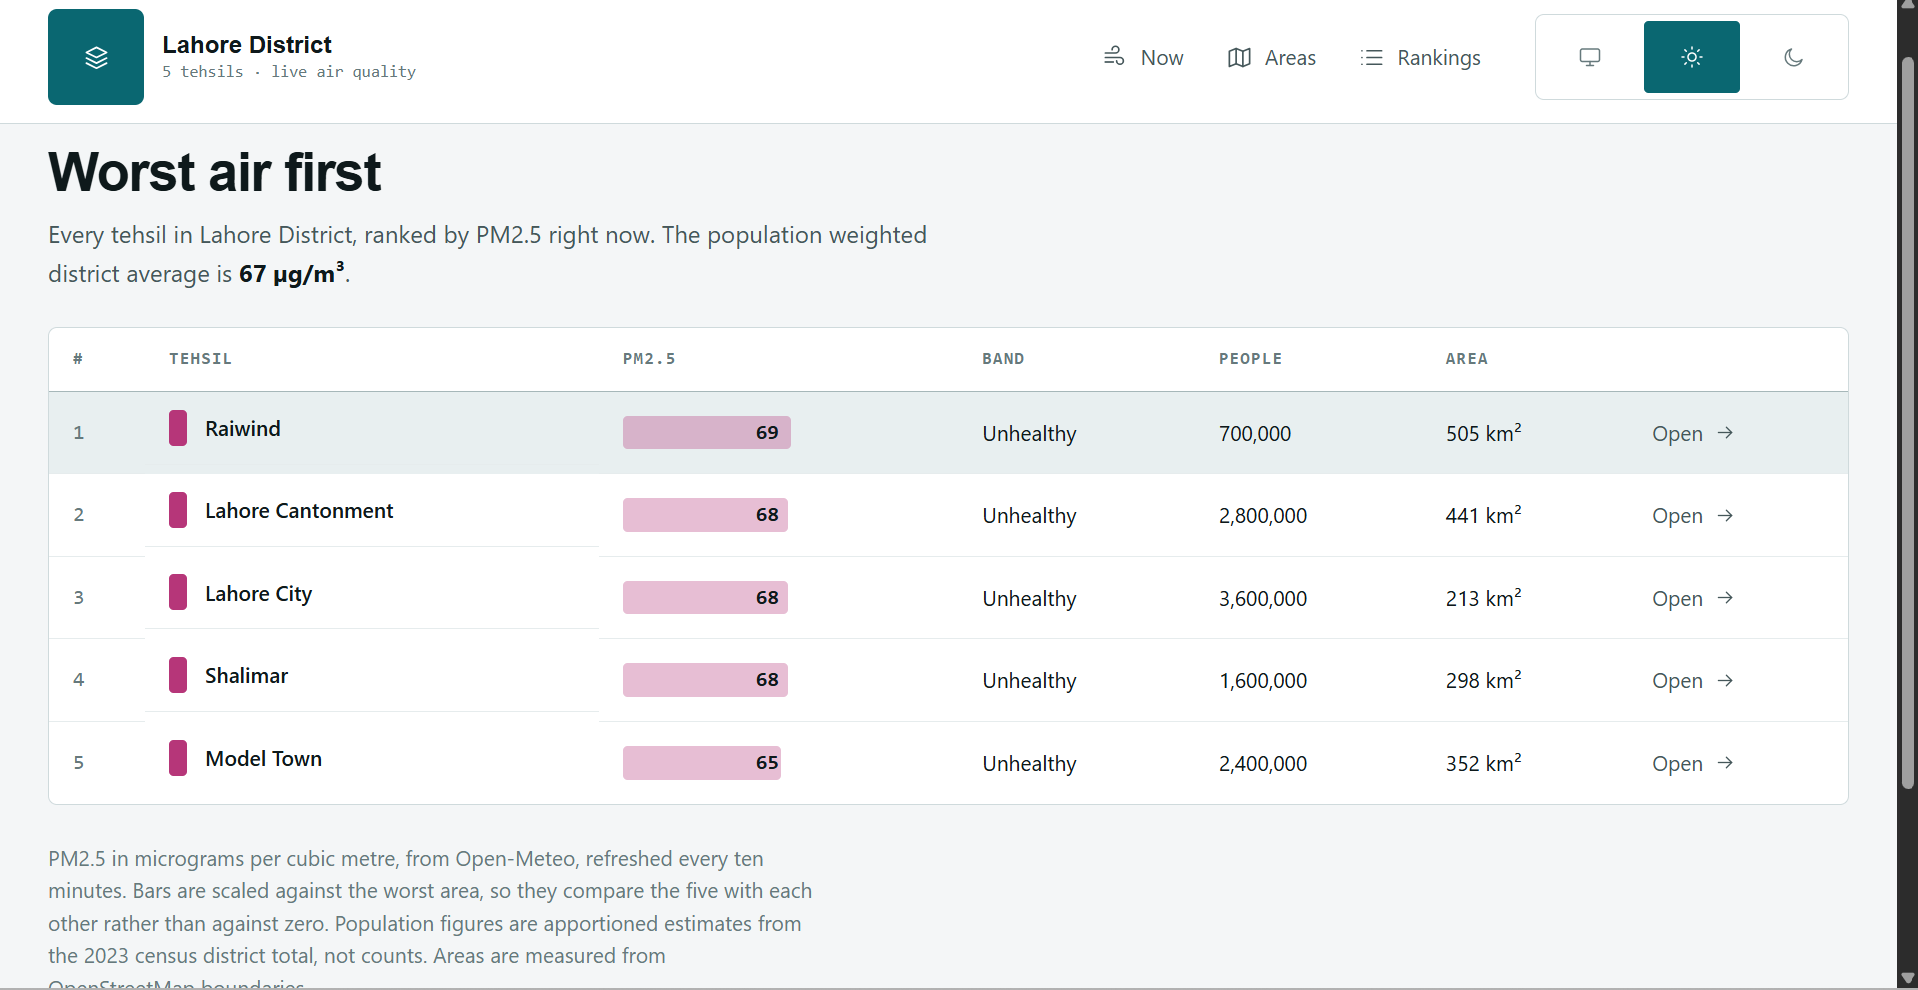
Ranking of Air Quality of all the Tehsils of Lahore
-
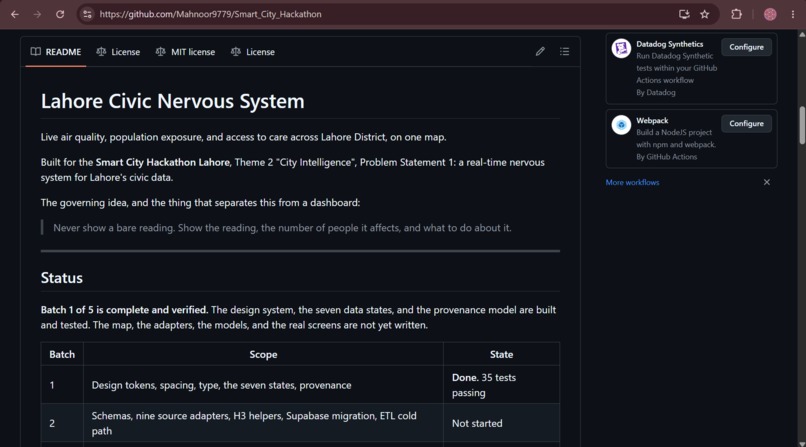
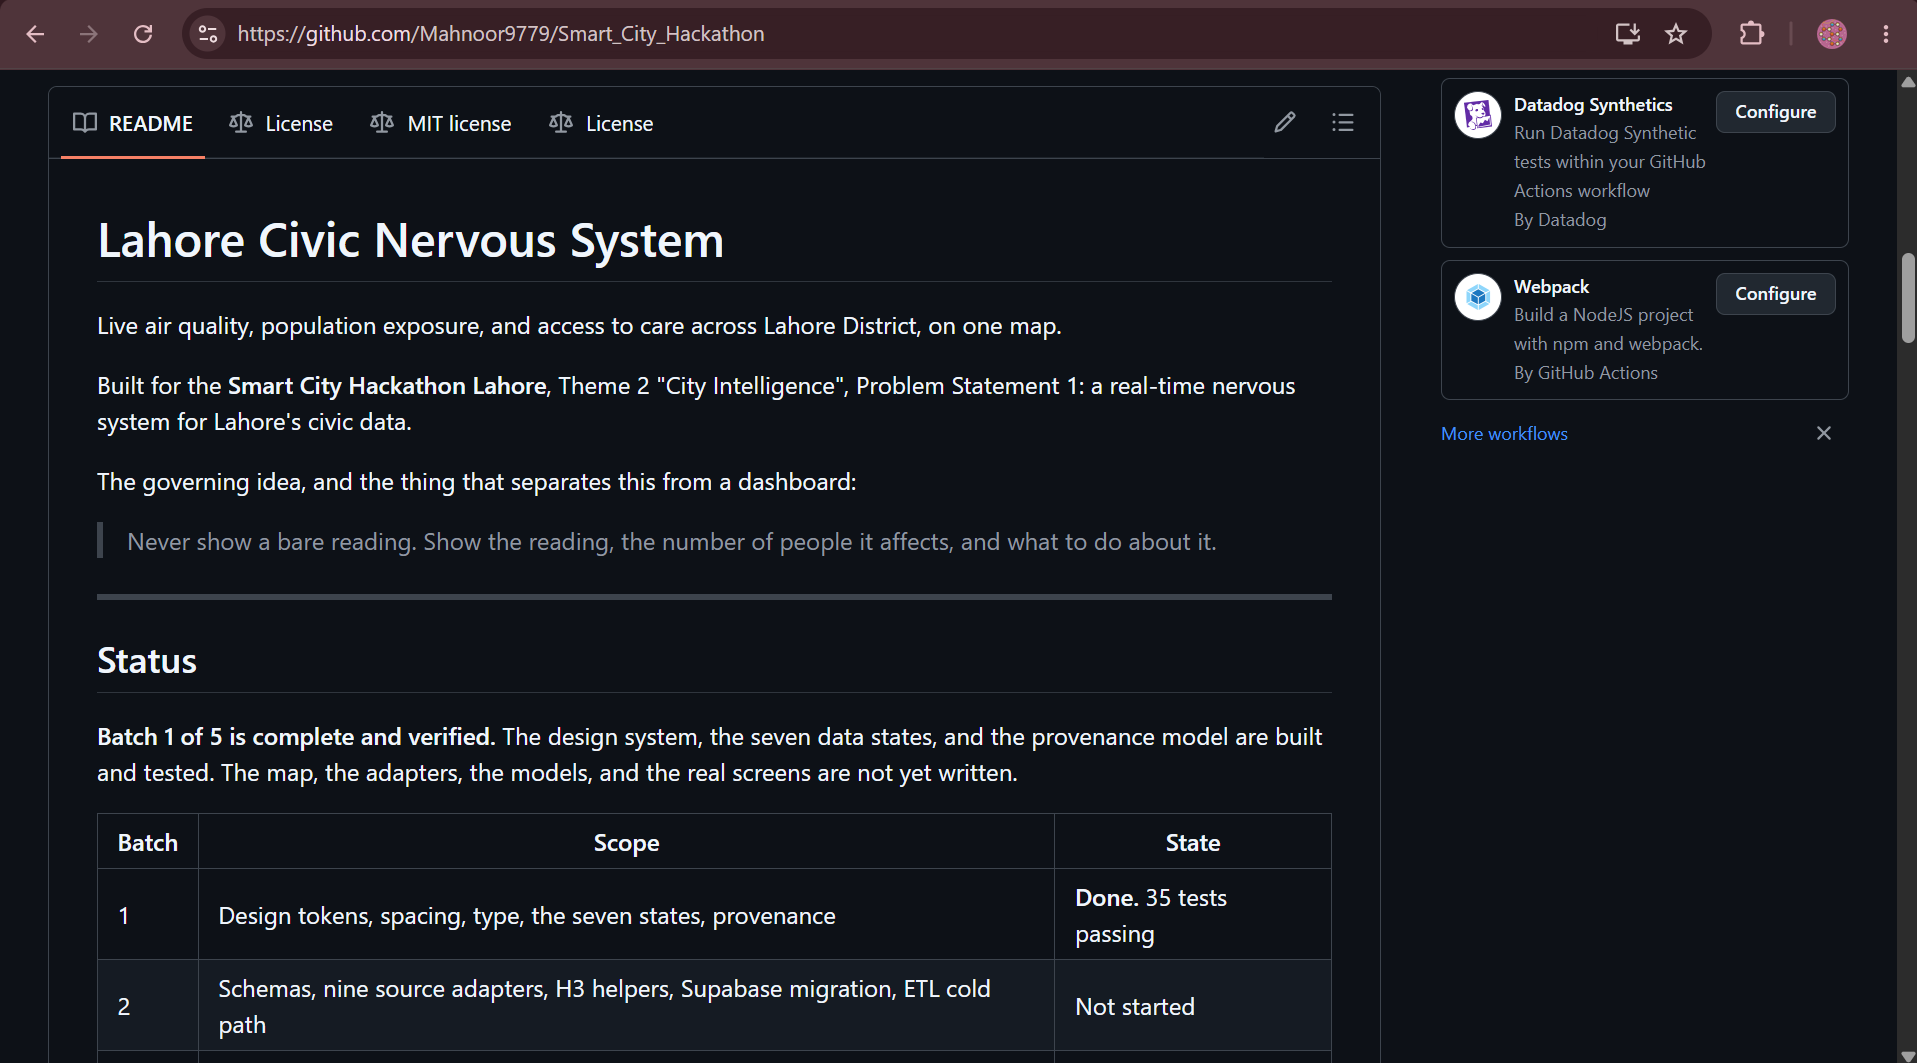
Readme
-
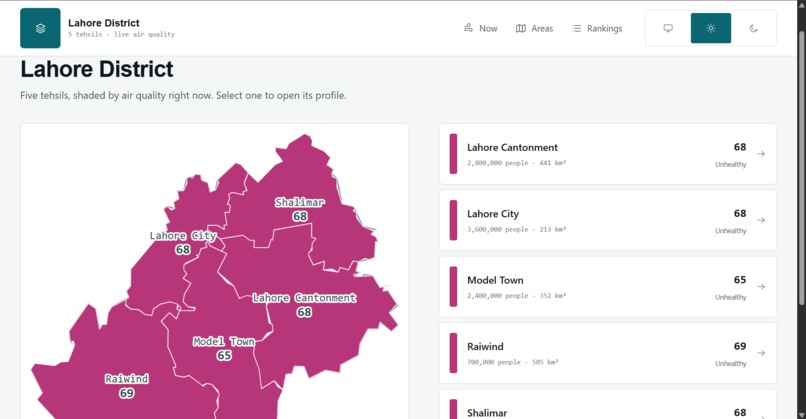
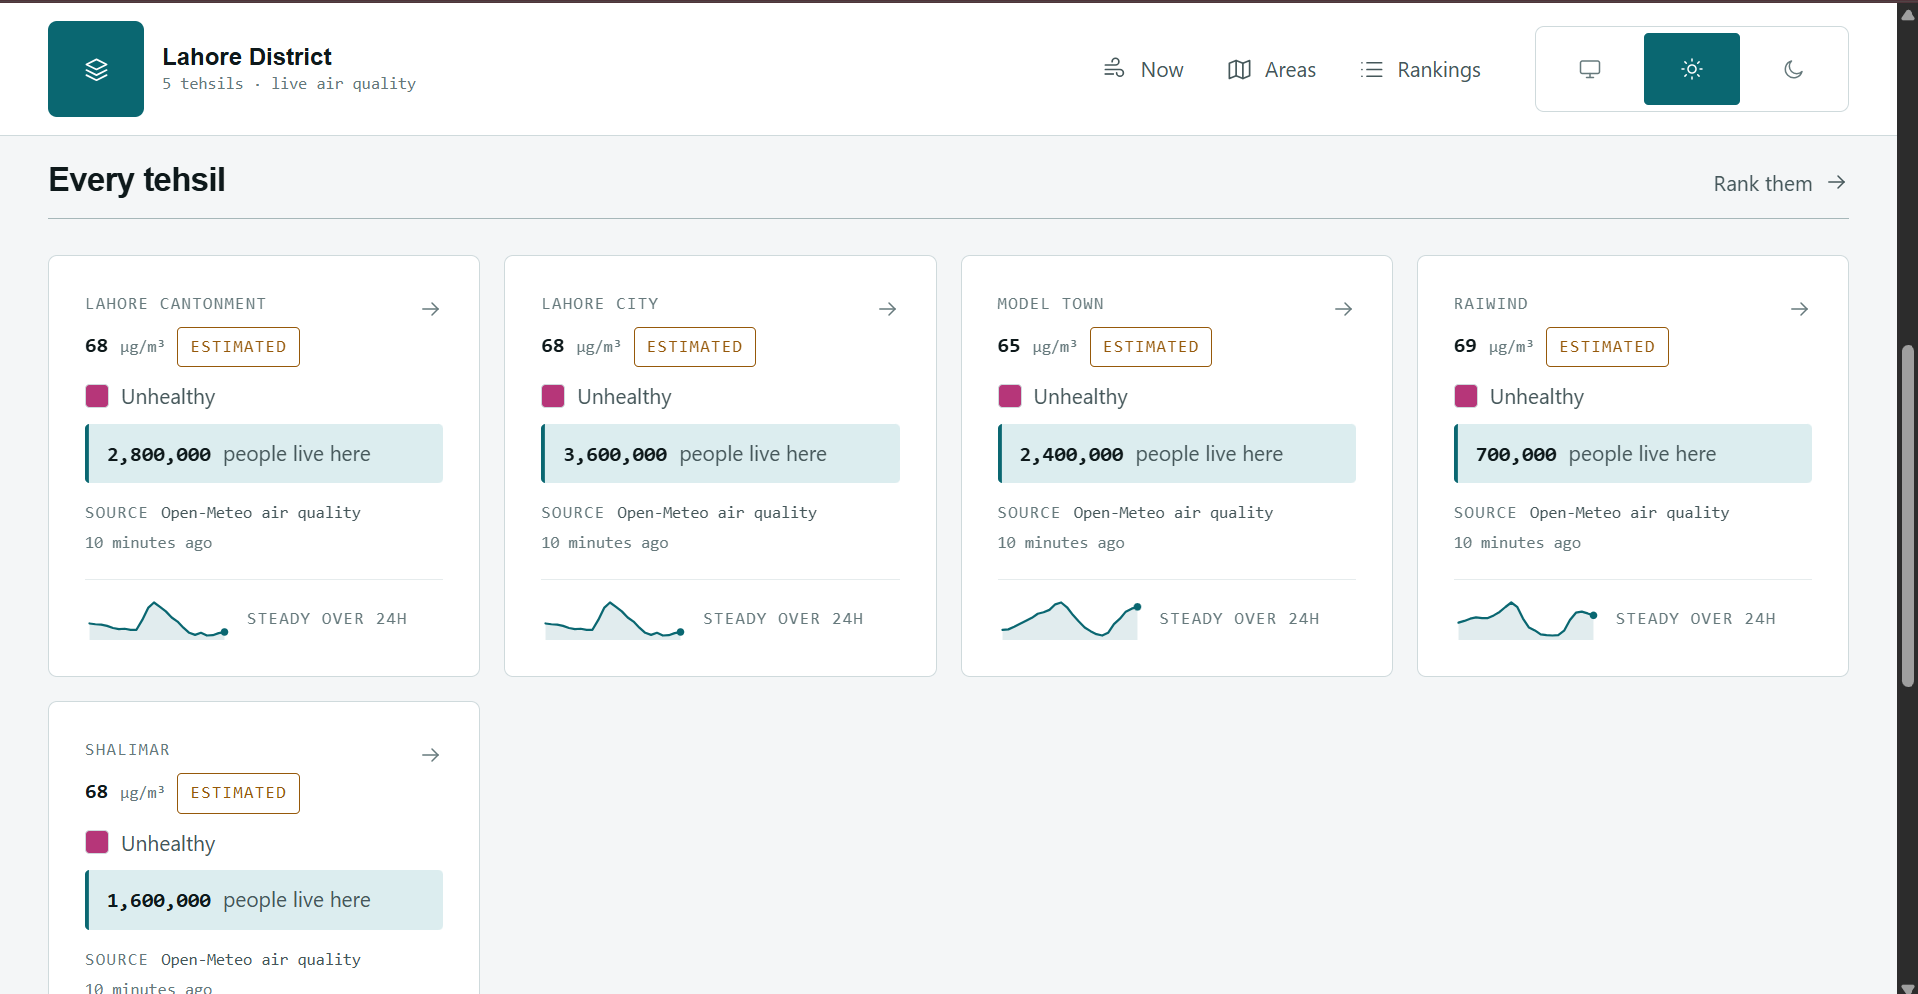
List of Air Quality of all Tehsils of Lahore
-
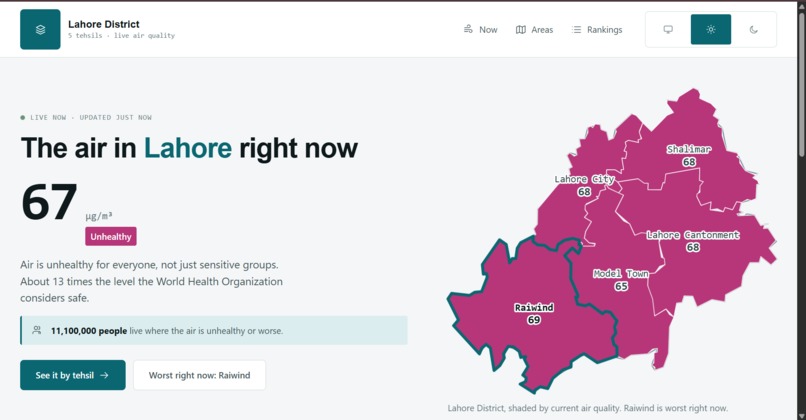
Hero Section
-
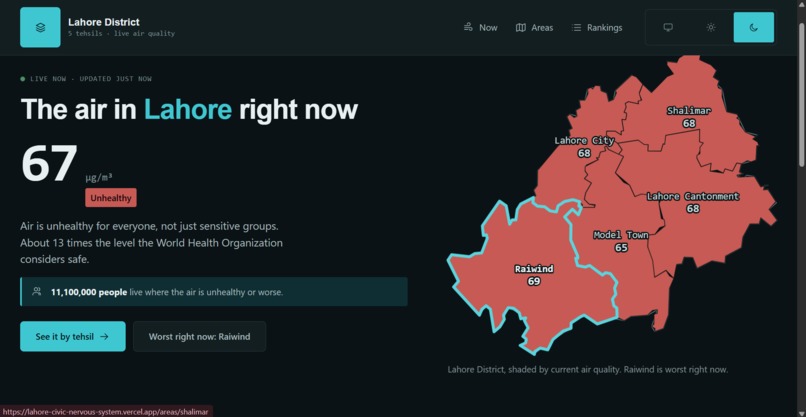
Dark theme
-
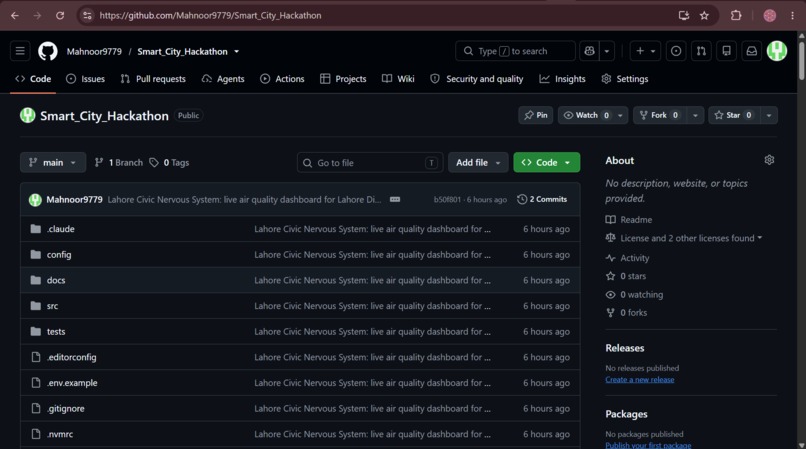
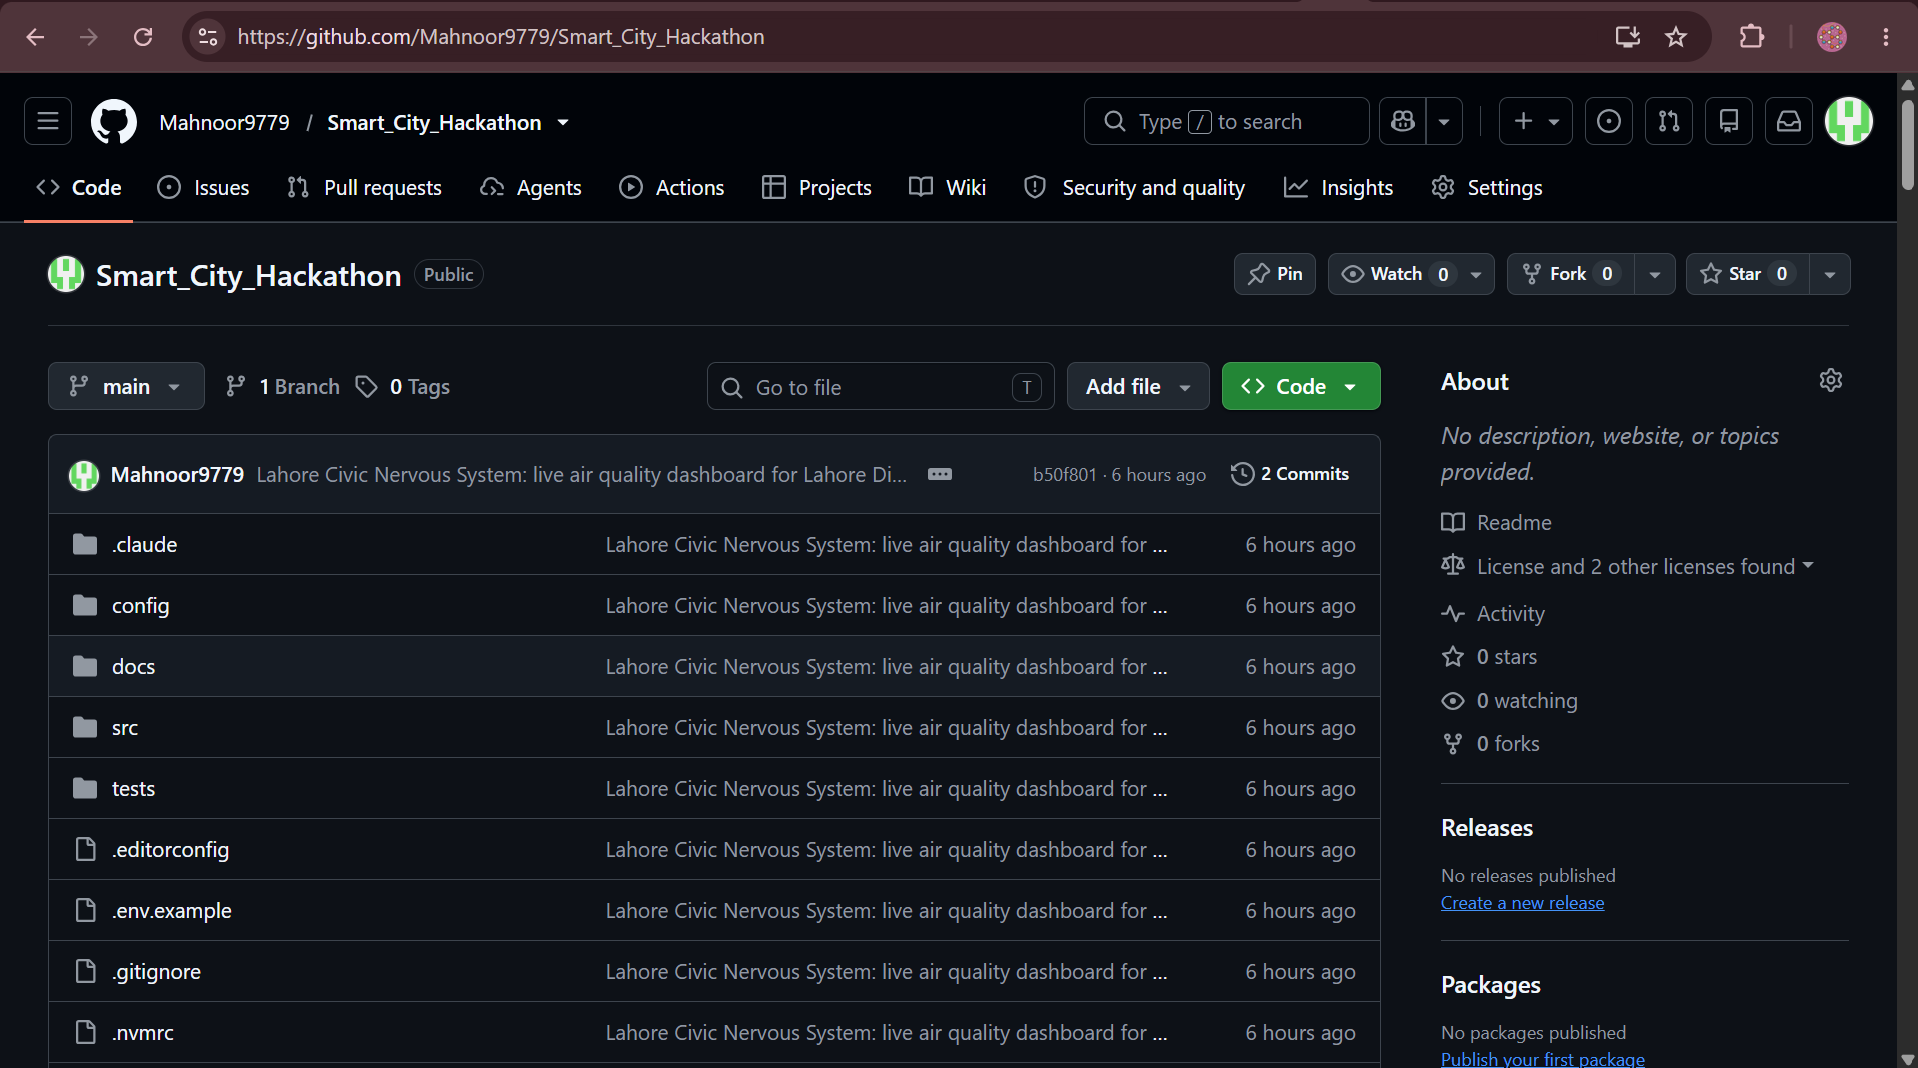
Project Repository
Inspiration
The brief opens with Rio de Janeiro's operations centre, which did not invent new infrastructure. It connected data that already existed across departments. Lahore has the same pieces lying around: Suthra Punjab GPS-tracks its collection fleet, Punjab EPA runs air monitors, PITB is building One Map Punjab. What it does not have is anything that joins them into one view.
But the thing that actually shaped this project was smaller and more specific. Every air quality app in Pakistan shows you a number. A number is a measurement. It is not information until you know who it reaches. "PM2.5 is 78" tells you nothing you can act on. "78, and 3.6 million people are breathing it in Lahore City tehsil alone" is a different sentence entirely.
So the whole platform is built around one rule: never show a bare reading. Every value on every screen carries the population it affects.
What it does
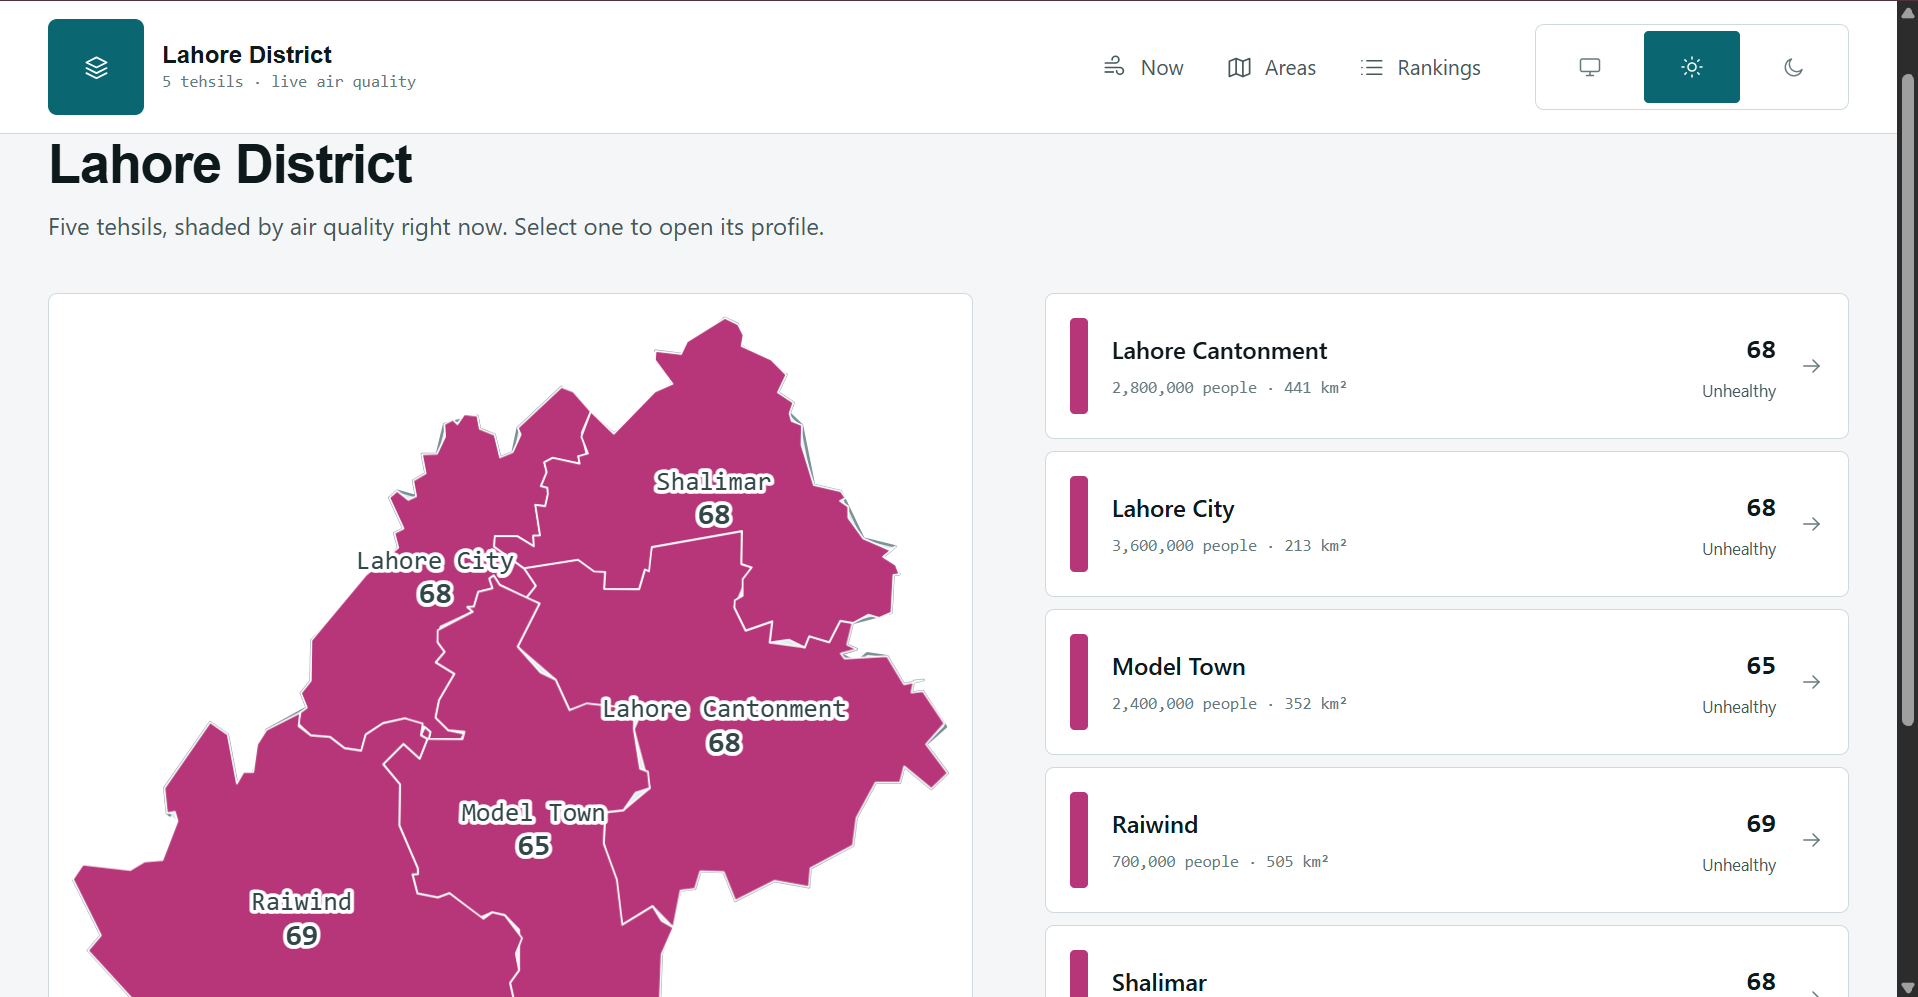
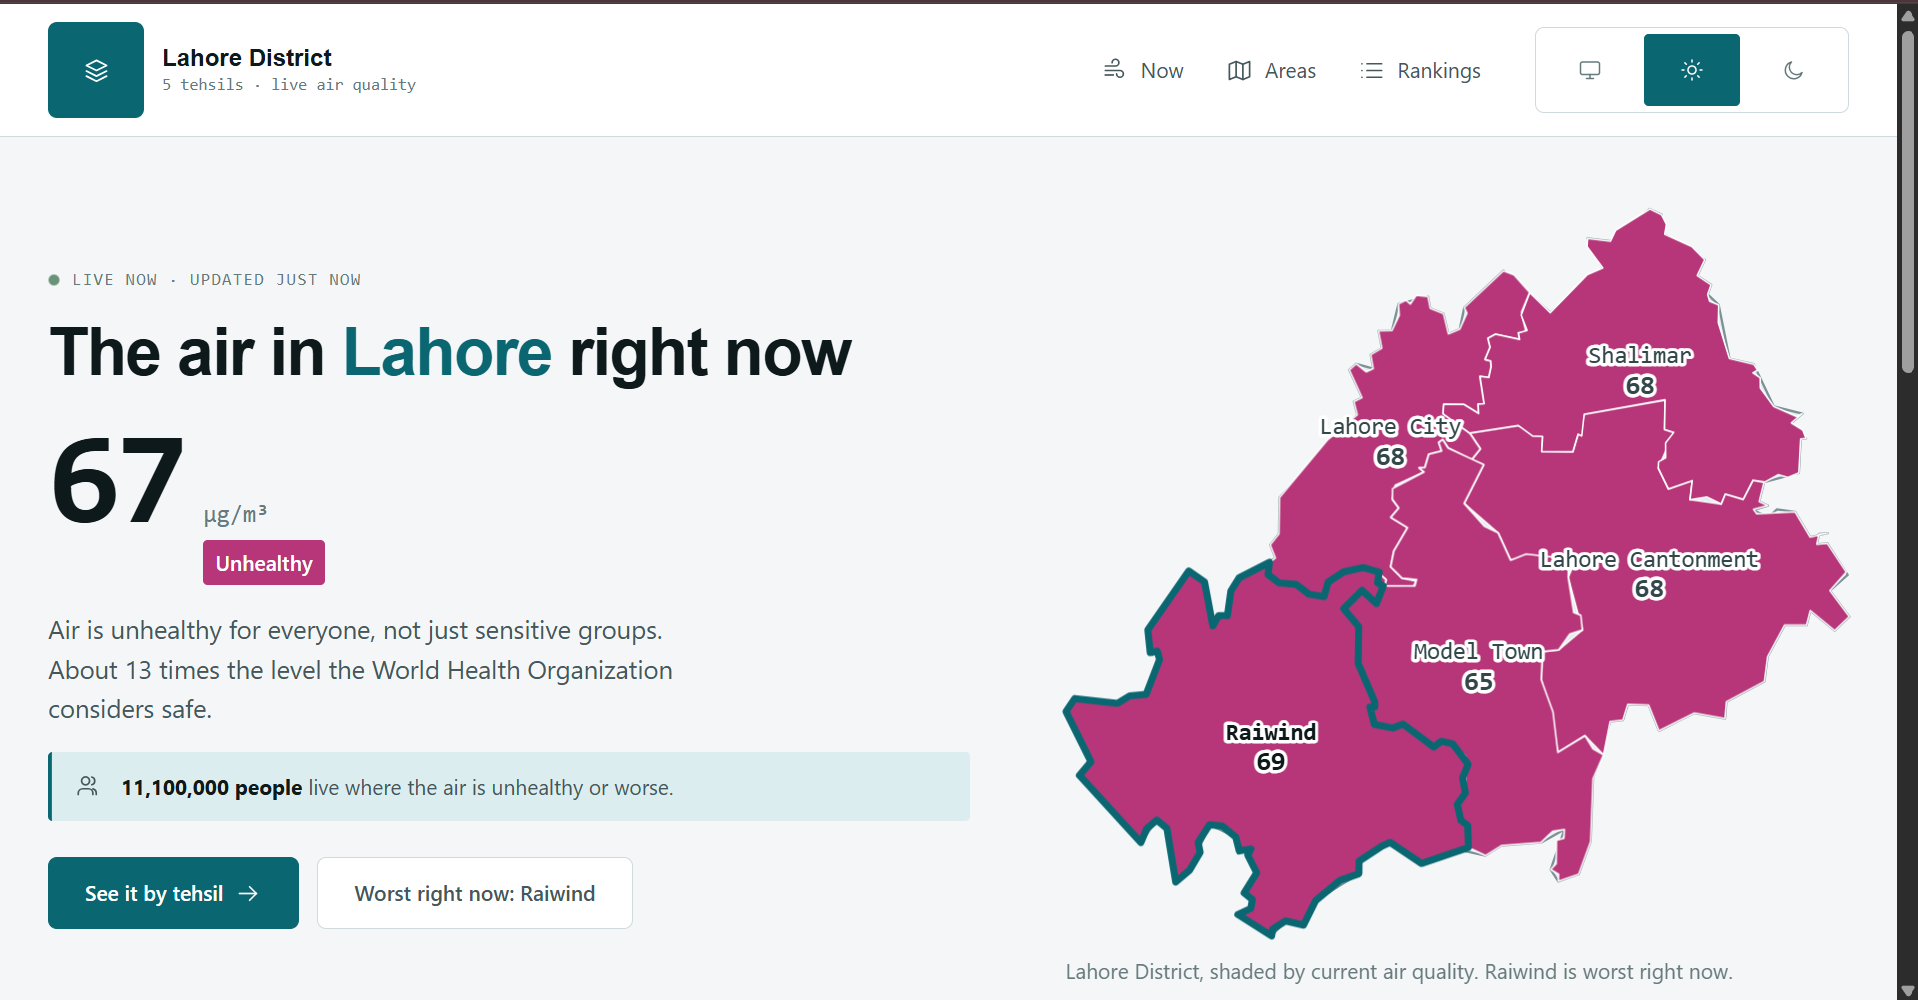
A live civic dashboard for Lahore District. It fetches real air quality every ten minutes and maps it across the district's five tehsils, drawn from actual OpenStreetMap boundaries rather than an illustration.
- Now answers three questions in order: where is this, how bad is it, who does it affect.
- Areas is the map plus a comparison list.
- Area profile gives one tehsil in depth, with a 72-hour forecast chart whose dashed lines are the health thresholds, so you can see when the air crosses into unhealthy rather than just that it is high.
- Rankings is a real sortable table, worst first, which doubles as the accessible equivalent of the map.
The district figure is a population-weighted mean, not a flat average of five unequal places:
$$\bar{c} = \frac{\sum_{i} c_i \, p_i}{\sum_{i} p_i}$$
where $c_i$ is the concentration in tehsil $i$ and $p_i$ its population. A plain mean would let Raiwind, with 700,000 people, count as much as Lahore City with 3.6 million.
How we built it
Real geometry, not a drawing. Lahore District's boundary came from OpenStreetMap via Nominatim at 1,629 vertices, simplified with Douglas-Peucker to 118 points, then projected equirectangular with a latitude correction so the shape is not stretched. The five tehsil boundaries came from Overpass, with their outer ways stitched into closed rings.
The check that the geometry is actually right: the five tehsils sum to 1,809 km² against a district total of roughly 1,772 km², inside 2 percent. That number is what told us the projection and the stitching were correct.
Live data with no key. Open-Meteo is keyless and sends permissive CORS headers, so the map carries real readings from the first render, with no account to approve and no secret to leak. One request returns all five tehsils.
Inline SVG, not a tiled map. The map answers one question, "where am I looking", and has to answer it in the first second on a mid-range phone. At 118 points it is about 1.5 KB and needs no tiles, no network, and no JavaScript to appear.
A design system with tests. 35 automated tests cover colour contrast, theme token parity, and the platform's own content rules.
Challenges we ran into
OpenStreetMap has no union councils for Lahore. The brief asks for a union council view, so we queried Overpass across the district bounding box for every administrative level. Levels 6 and 7 exist. There are zero relations at level 8 or 9. Union councils are simply not mapped here.
Rather than invent a subdivision, we use tehsils, and the interface says "tehsil" everywhere and prints the level in use in the footer. An interface that implies a precision its data lacks is worse than one that admits the limit.
Two URLs in the brief's own source list are wrong. The AQICN Lahore path
returns 404; the working one is aqicn.org/city/lahore. WorldPop's REST API has
moved to hub.worldpop.org.
The AQICN demo token is a trap. It ignores your query and returns Shanghai data for any city and any coordinate pair. Testing with it gives you plausible-looking readings that have nothing to do with Lahore.
Licensing turned out to be a design constraint, not paperwork. AQICN's terms
state the data "can not be redistributed as cached or archived data", so those
readings can be displayed and never exported. OpenAQ is conditional, and exposes
redistributionAllowed as a machine-readable flag per station. That is why our
data record carries a required exportable boolean: the licence question travels
with the value instead of being remembered at the export endpoint.
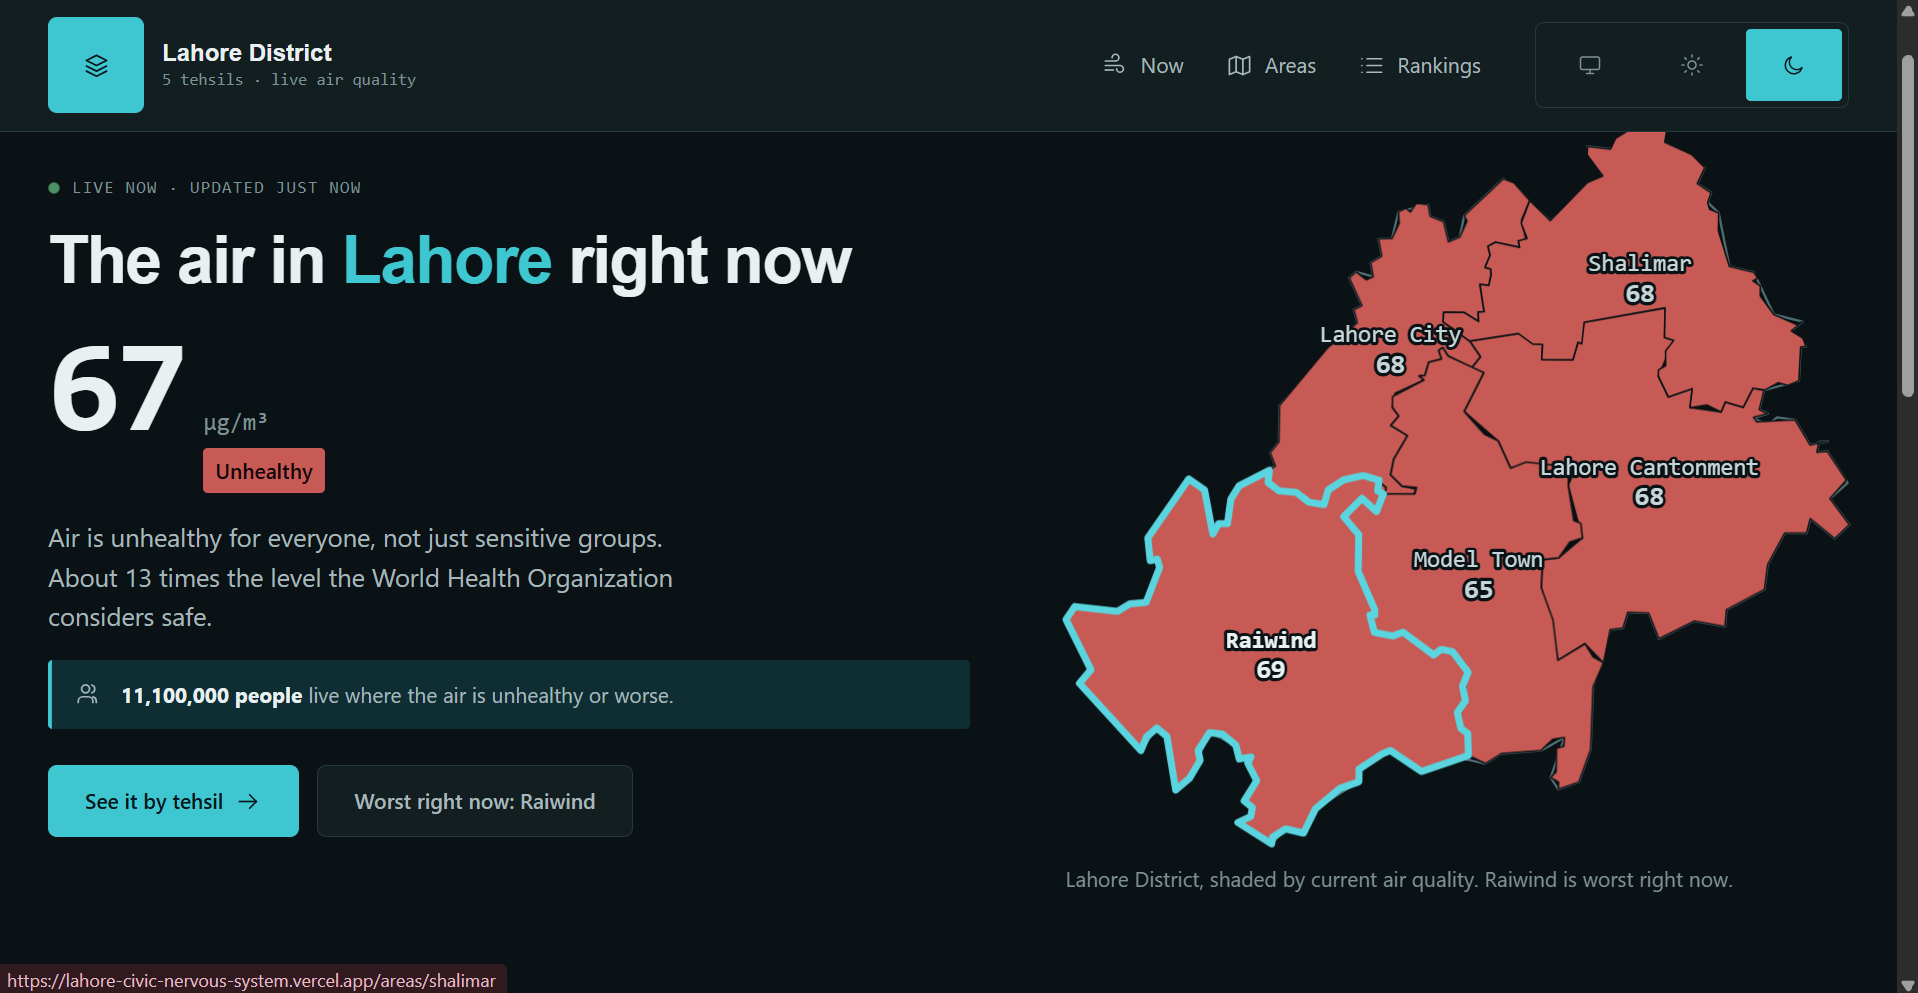
The severity ramp had to invert between themes. In light mode severity increases with darkness. In dark mode it increases with luminance, because a dark purple hexagon disappears on a dark map. The invariant being preserved is visual weight against the ground, not hue. Both directions are asserted strictly monotonic by an automated test.
React 19 hoists SVG <title> elements to <head> as document metadata,
which broke hydration on every page carrying a map. The fix was aria-label.
What we learned
The tests found things review did not. A contrast test caught a severity band at 3.20:1, below the accessibility threshold, in a colour we had looked at many times. Mutation testing then caught something worse: our theme parity test was matching a code comment instead of the actual CSS rule, so it had been comparing the light palette against itself and passing vacuously.
The broader lesson is that honesty is a feature. Open-Meteo's grid is about 11 km, coarser than a tehsil, so every reading is labelled estimated with a confidence value rather than presented as a measurement taken inside the area.
What's next
Ground sensor readings from OpenAQ and Punjab EPA behind server routes, WorldPop population rasters replacing the apportioned estimates, road-network travel times so "nearest hospital" means minutes by road rather than a circle on a map, a facility siting optimiser, and full Urdu with right-to-left layout.
Built With
- accessibility
- air-quality
- civic-tech
- css-modules
- data-visualization
- douglas-peucker
- eslint
- geojson
- geospatial
- next.js
- node.js
- nominatim
- open-data
- open-meteo
- openstreetmap
- overpass-api
- python
- react
- rest-api
- server-components
- svg
- typescript
- vitest
- wcag
- zod

Log in or sign up for Devpost to join the conversation.