Inspiration
Every year in Bangladesh, the floods return like an unwelcome guest. They sweep through Sunamganj and Sylhet, submerging schools, isolating hospitals, washing away fields, and tearing families apart. Mothers cook on rafts, children carry their books above the water, and elders pray that the water will stop rising.
The heartbreaking truth is: everyone knows it will happen again next year — yet every year the response is late, uncoordinated, and blind. People are left guessing: Which road is cut off? Will the clinic be underwater? Is the shelter safe?
That pain and frustration inspired JolChobi — “Water Picture” in Bangla. We wanted to build a tool that gives a clear, fast picture of the flood. Not just pixels, but a way for responders to act, and for families to feel seen.
What it does
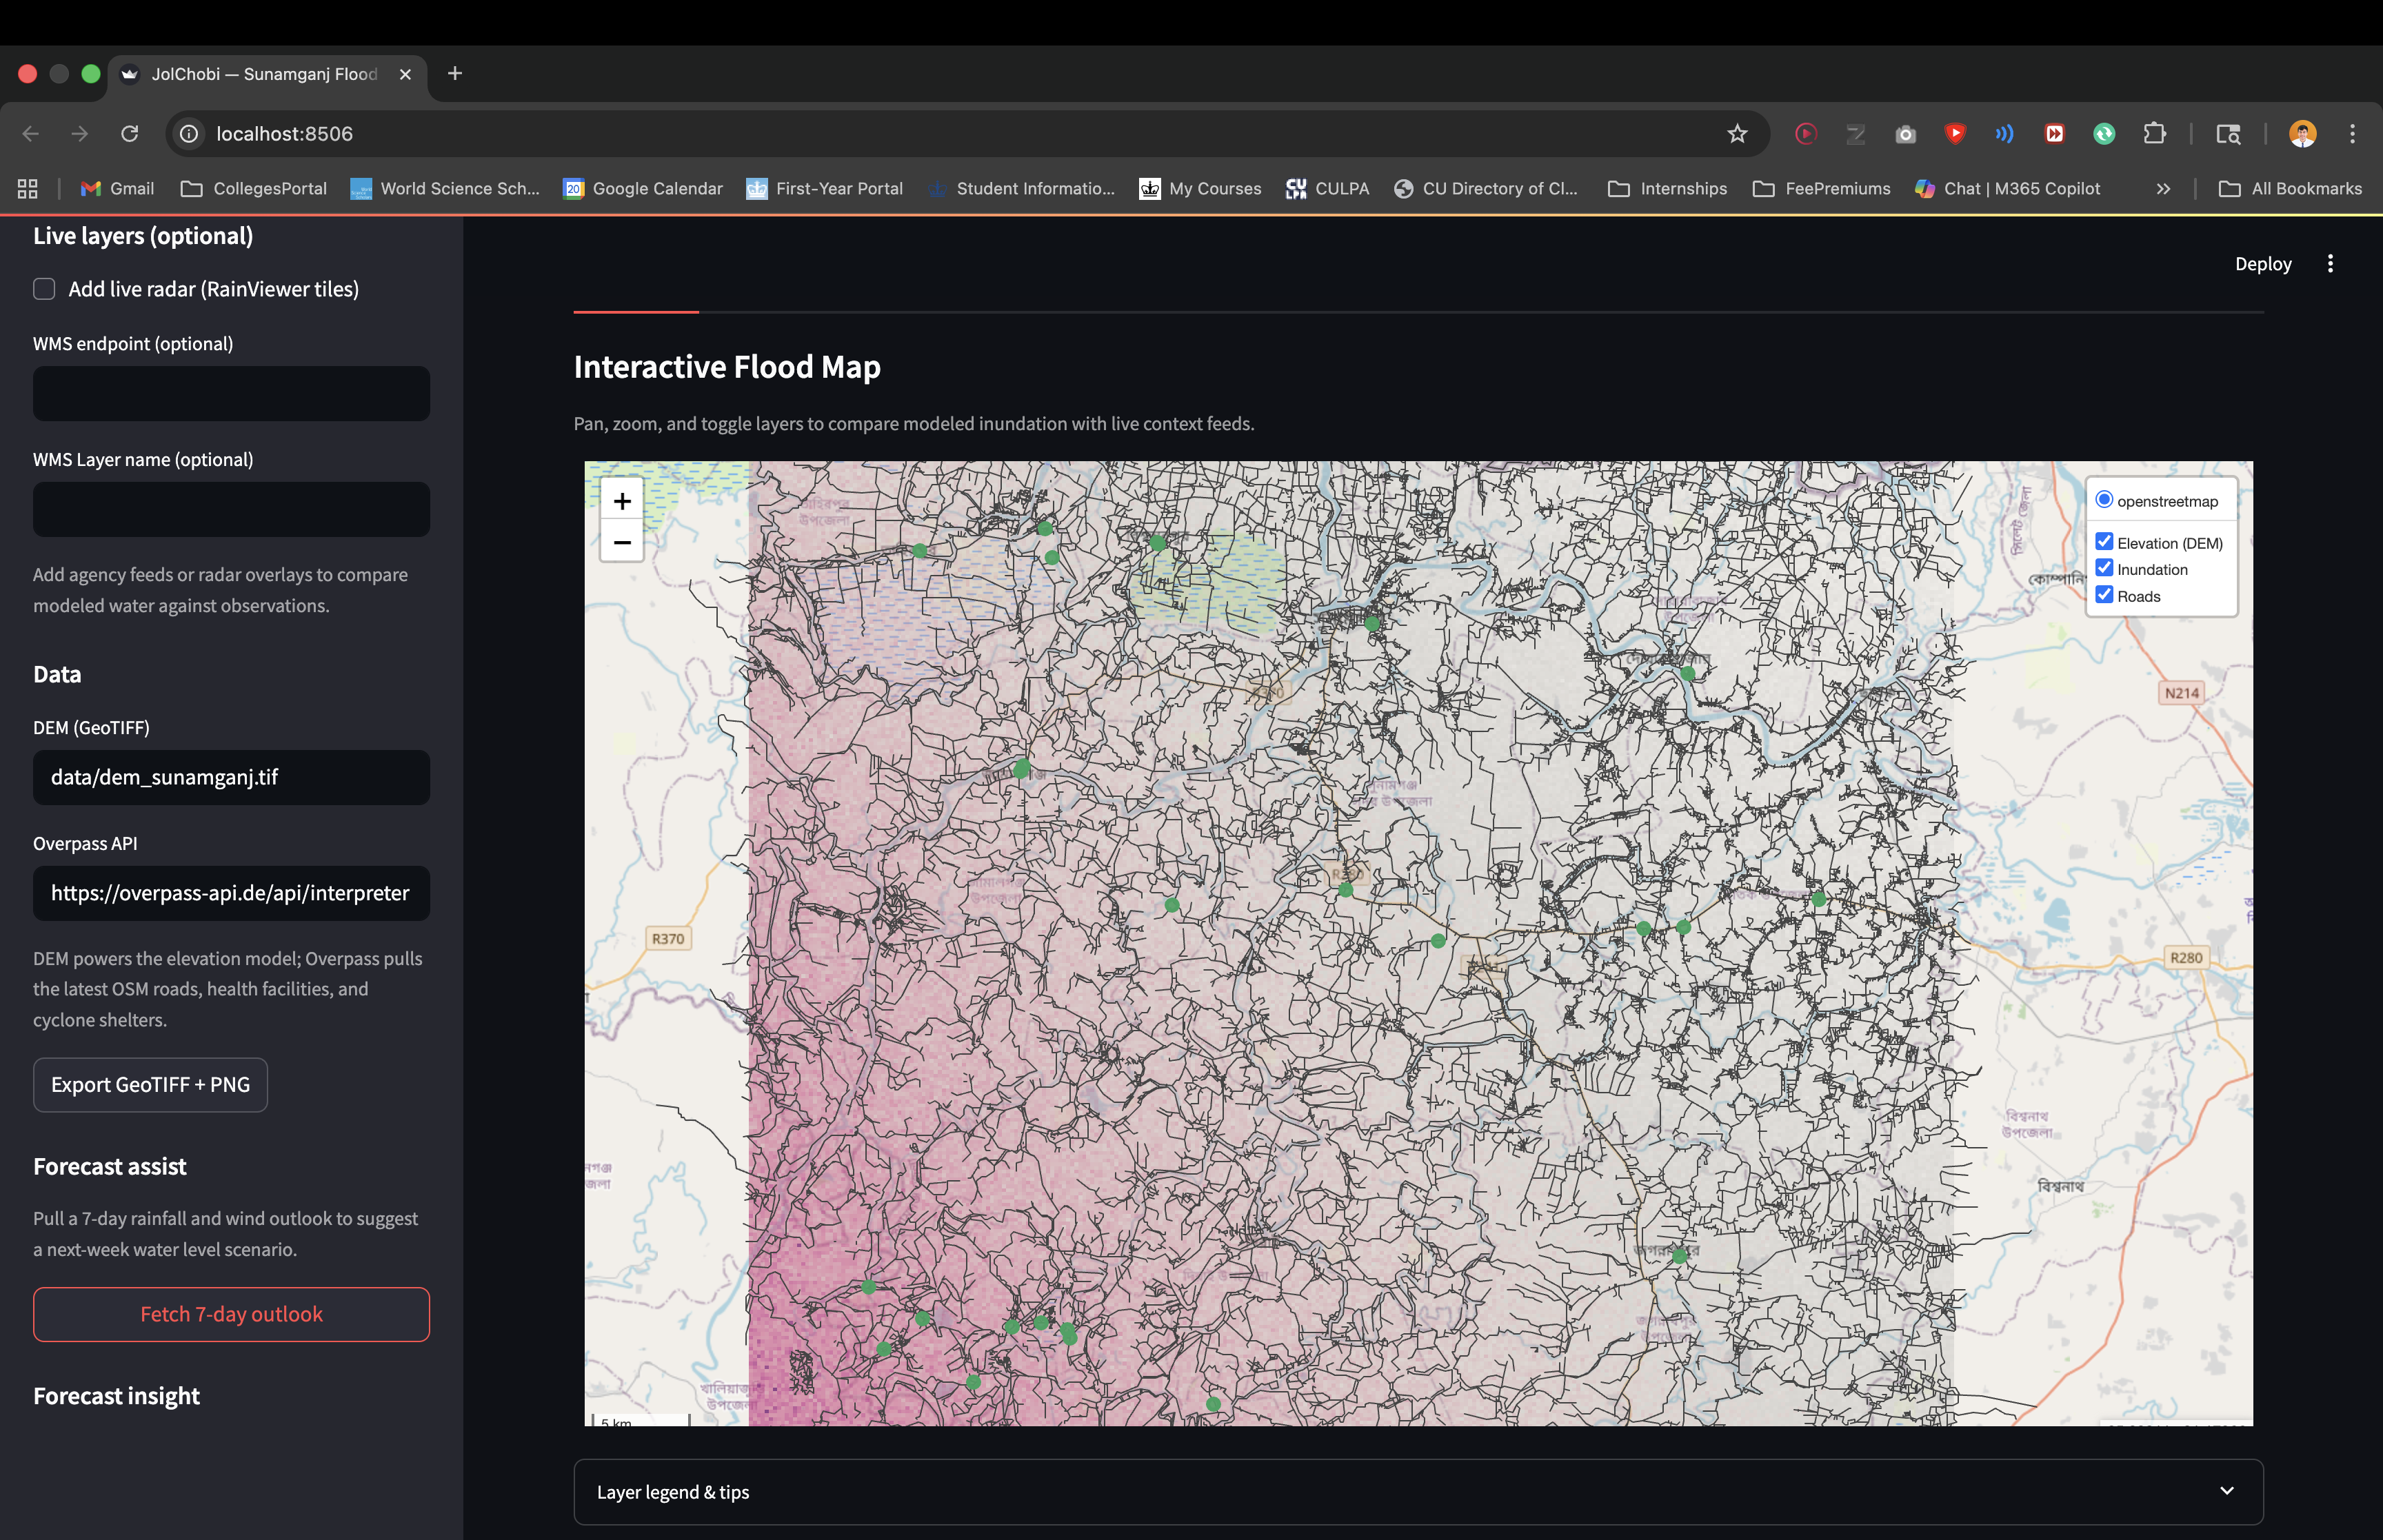
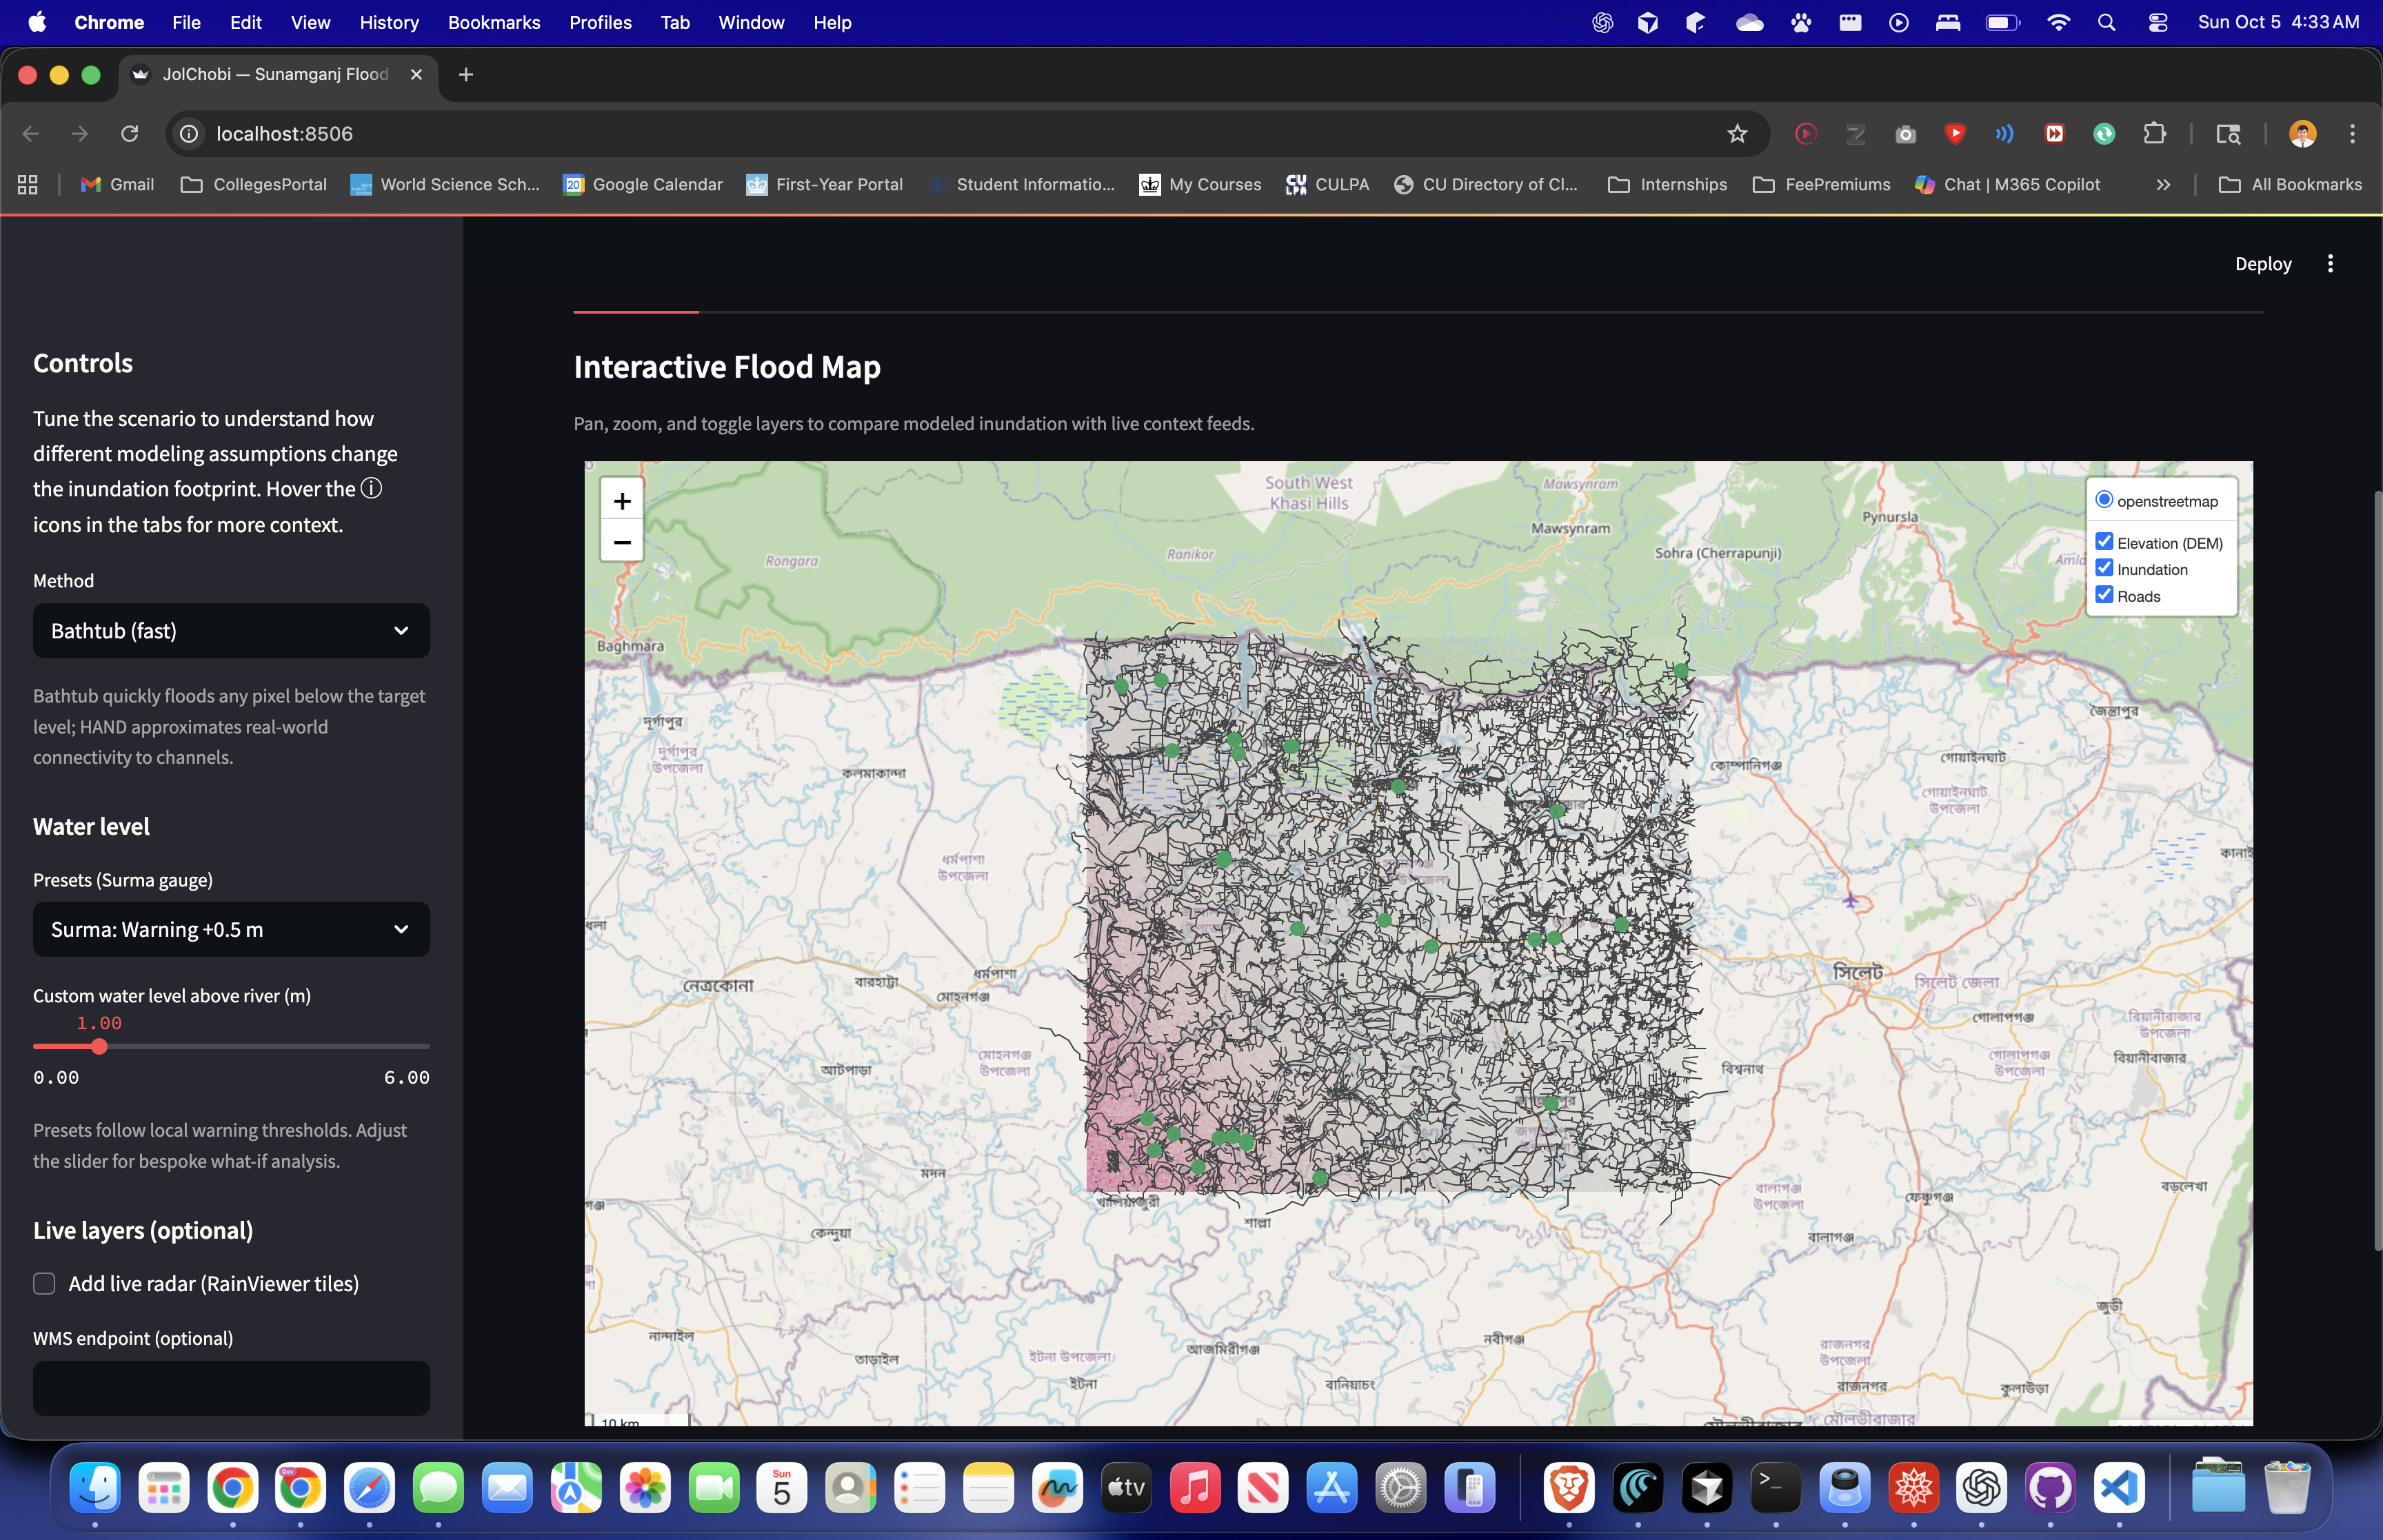
JolChobi paints a living picture of water: • It shows which areas will flood when the Surma river rises. • It highlights which roads vanish, which health posts drown, and whether cyclone shelters are still safe. • It lets responders layer in live satellite images or flood forecasts. • It turns complex data into two things that matter: • A GeoTIFF for experts. • A simple PNG map for the mother in Sunamganj who just wants to know if the road to the shelter is still there.
How we built it
• Python + Streamlit → the app interface.
• Folium/Leaflet → the map engine.
• DEM (Digital Elevation Models) → to know which land is low and which is high.
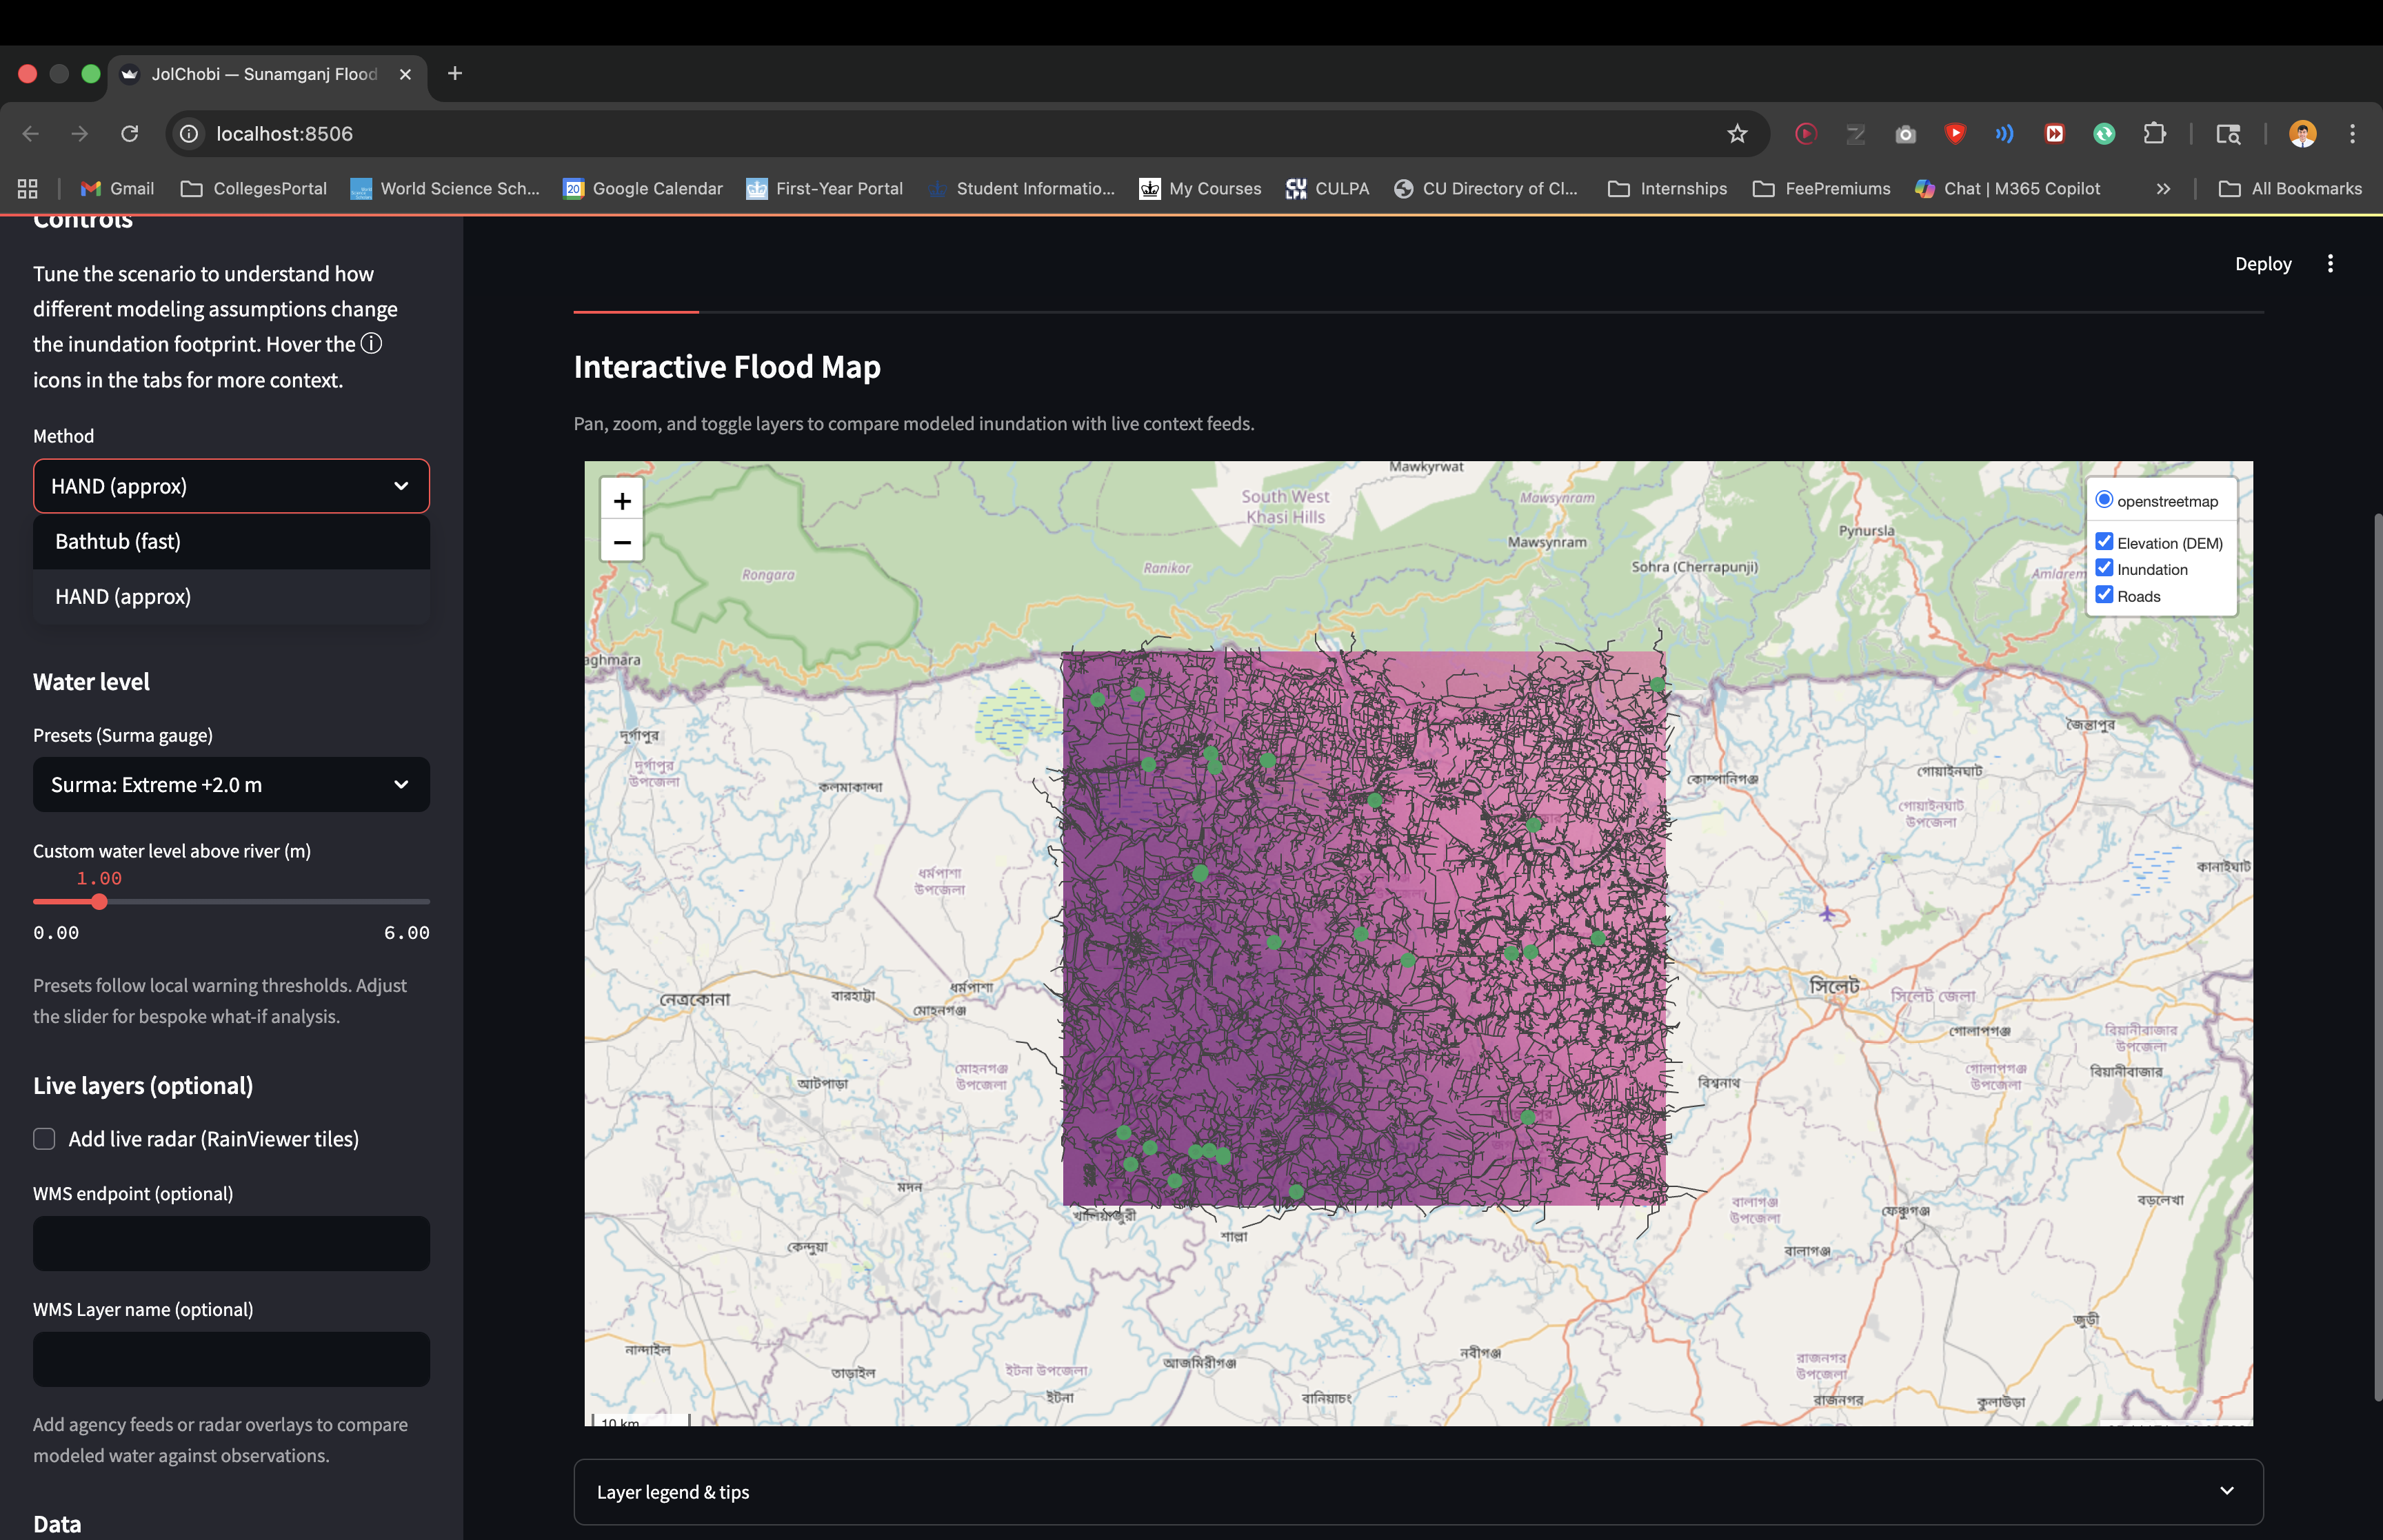
• Flood models:
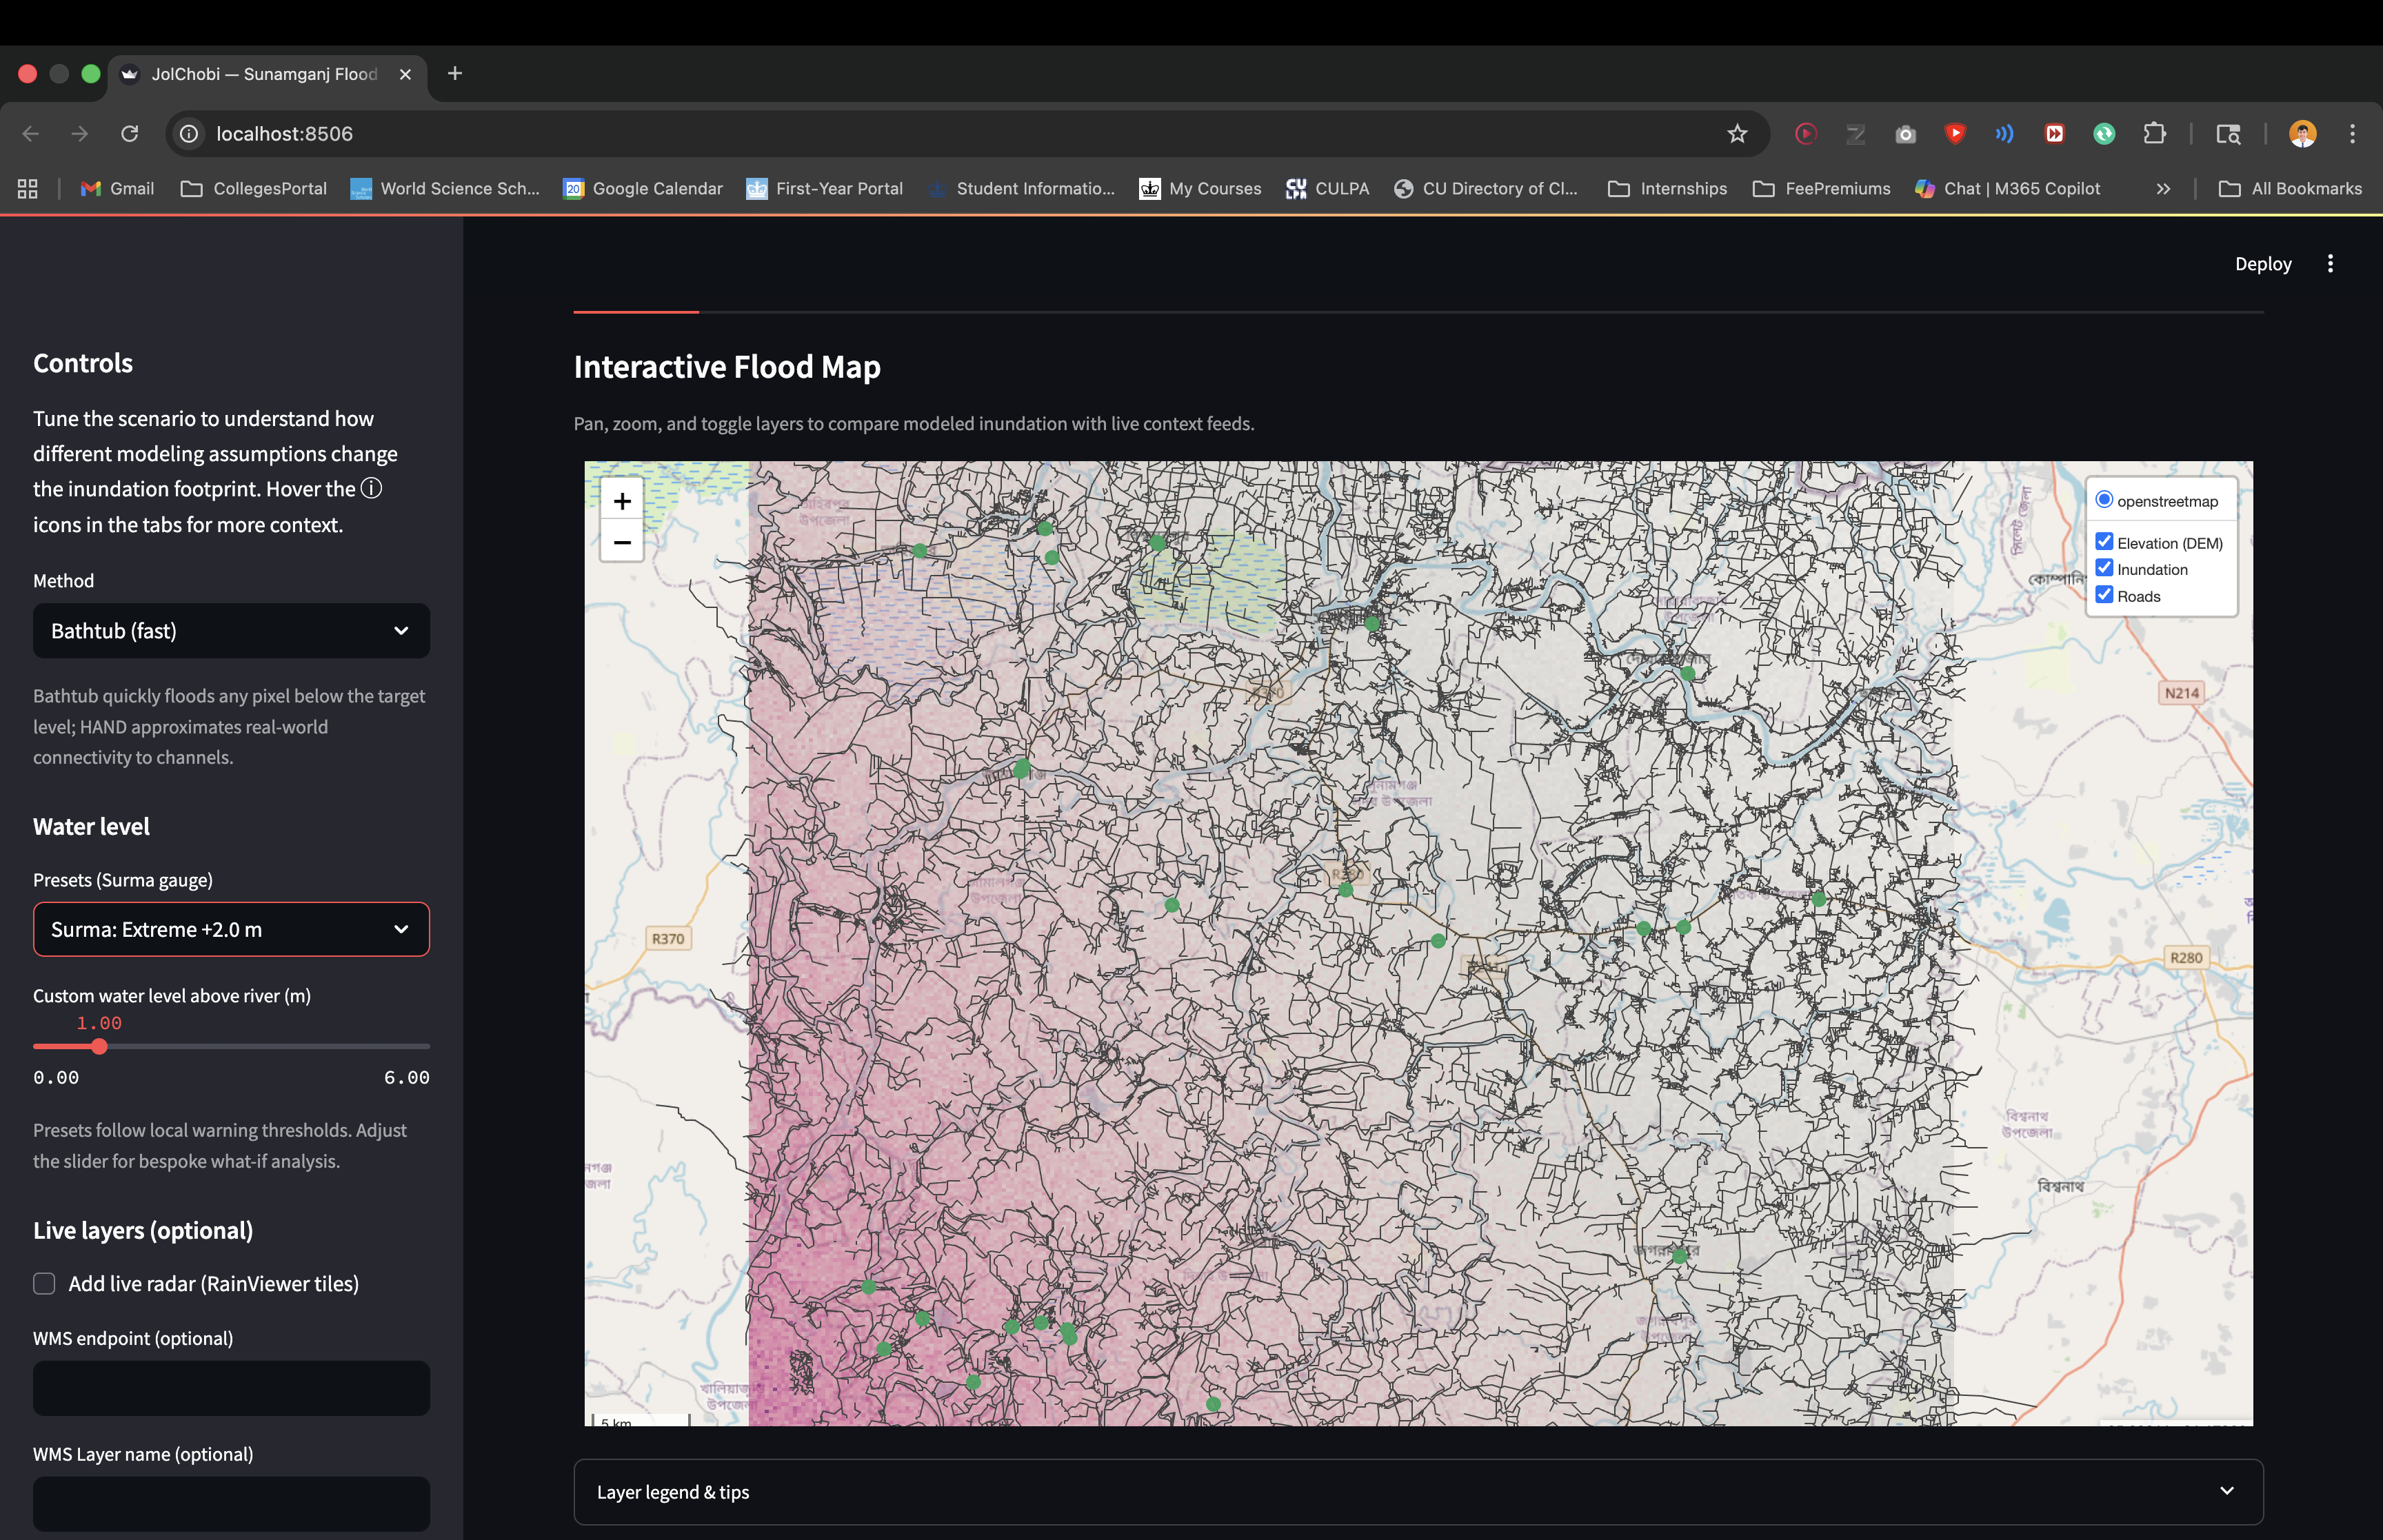
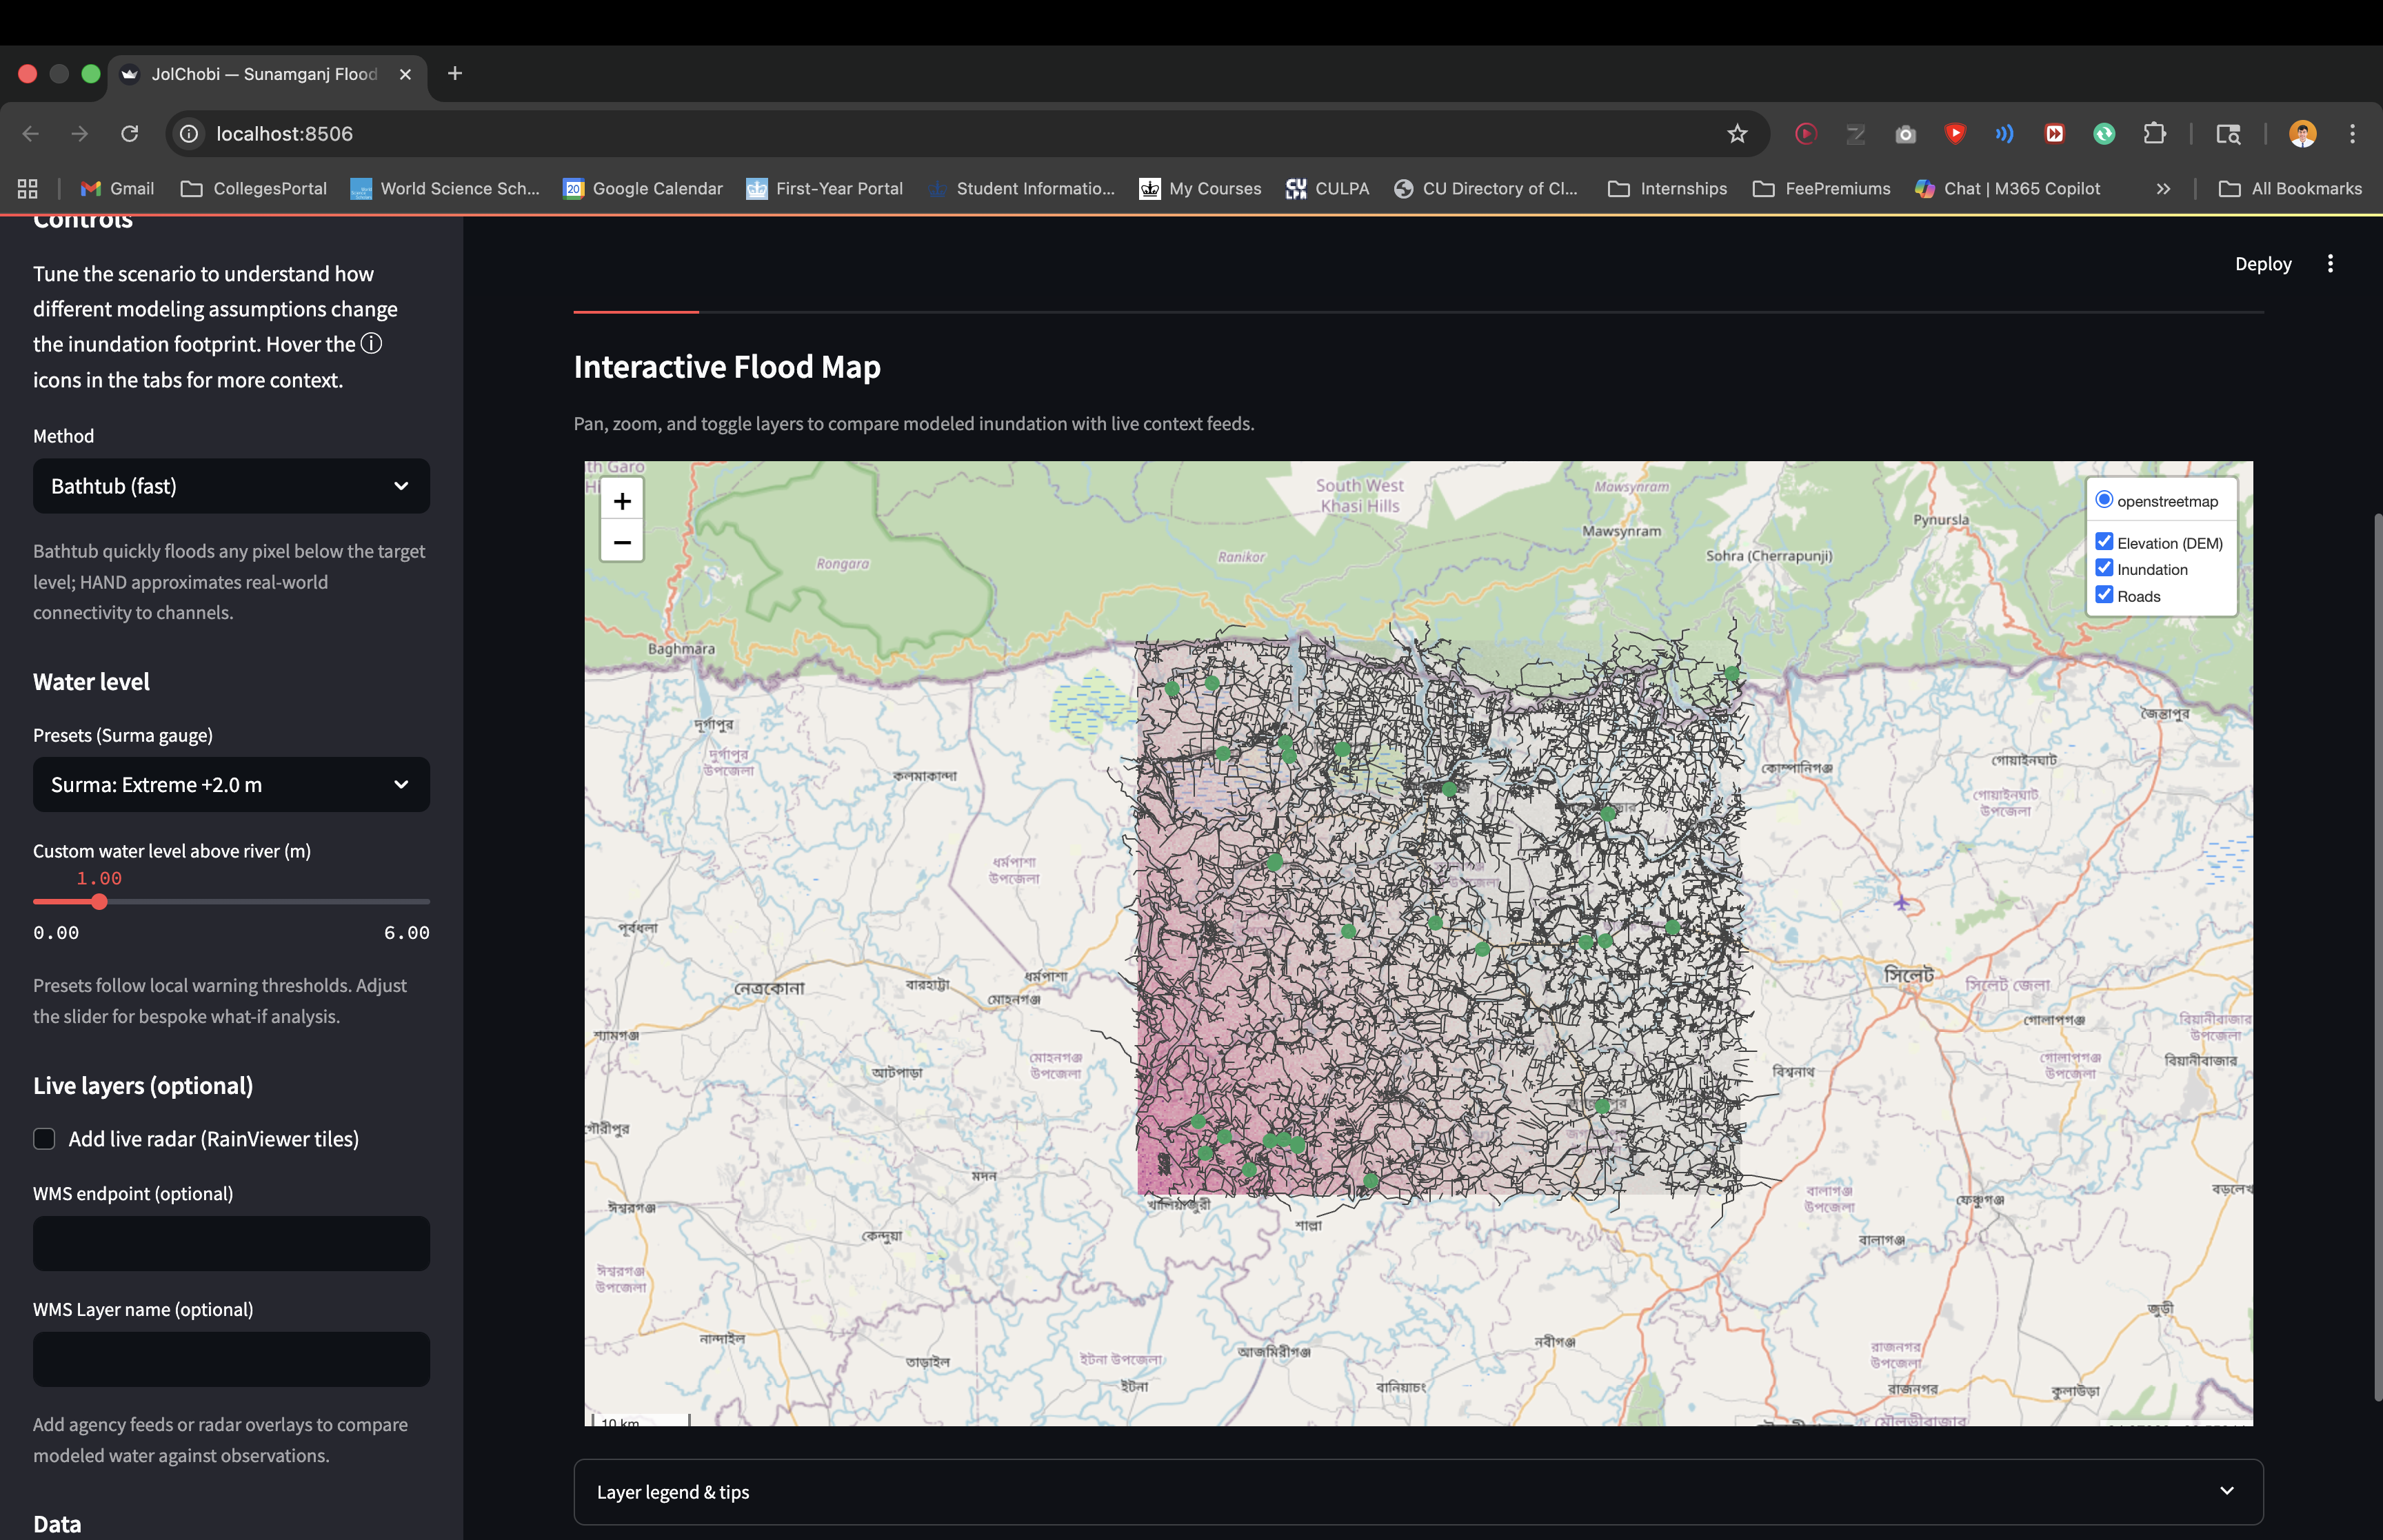
• Bathtub → fill low land like water in a bowl.
• HAND → see how high land is above rivers.
• OpenStreetMap (Overpass API) → live roads, health posts, shelters.
• WMS endpoints → NASA satellite images and flood forecasts.
• Exports → GeoTIFFs for analysts, PNGs for people.
Mathematically, the flood model is simple:
$$ Flood(x,y) = \begin{cases} 1 & \text{if } h(x,y) \leq H_{river} + \Delta H \ 0 & \text{otherwise} \end{cases} $$
But its impact is not simple — it could mean life or death.
Challenges we ran into
• Data silence: Real-time river gauges aren’t public, so we had to improvise with DEMs.
• Fragile APIs: The OSM Overpass API crashed under load, forcing us to build fallback logic.
• Hackathon clock: 24 hours is too short for hydrology, but we pushed for something that works now.
• Emotional weight: It is hard to build a “demo” knowing that outside this hackathon, real people are suffering the same disaster again.
Accomplishments that we're proud of
• Built a working prototype in under 24 hours that anyone can use.
• Integrated live data (OSM, satellite, forecasts) into a usable app.
• Bridged a gap: experts get GeoTIFFs, locals get shareable maps.
• Rooted the project in Bangla identity — JolChobi is for the people it aims to help.
What we learned
• Built a working prototype in under 24 hours that anyone can use.
• Integrated live data (OSM, satellite, forecasts) into a usable app.
• Bridged a gap: experts get GeoTIFFs, locals get shareable maps.
• Rooted the project in Bangla identity — JolChobi is for the people it aims to help.
What's next for JolChobi
Floods will come back next year, and the year after, unless tools like JolChobi are deployed. We plan to: • Connect to real-time Surma river gauges. • Add SMS/USSD alerts for people without smartphones. • Build offline bundles so union councils can use it in the field. • Let locals send photos of water levels to improve accuracy. • Scale JolChobi to every flood-prone district of Bangladesh.
Built With
- copernicusglofaswms
- folium
- geopandas
- nasagibswms
- numpy
- openstreetmap
- python
- rasterio
- shapely
- srtm
- streamlit


Log in or sign up for Devpost to join the conversation.