-
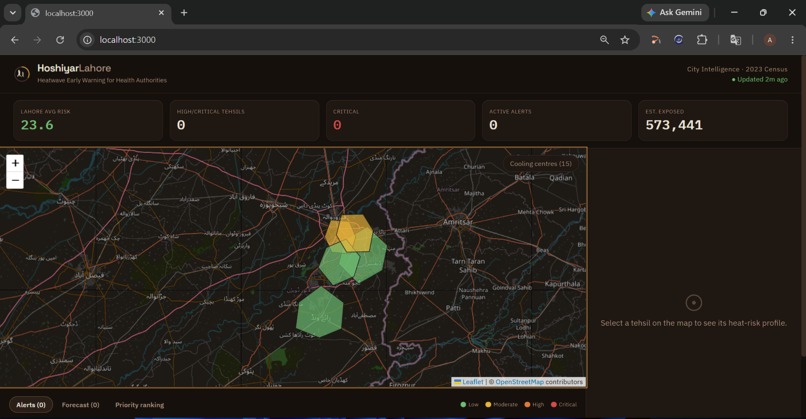
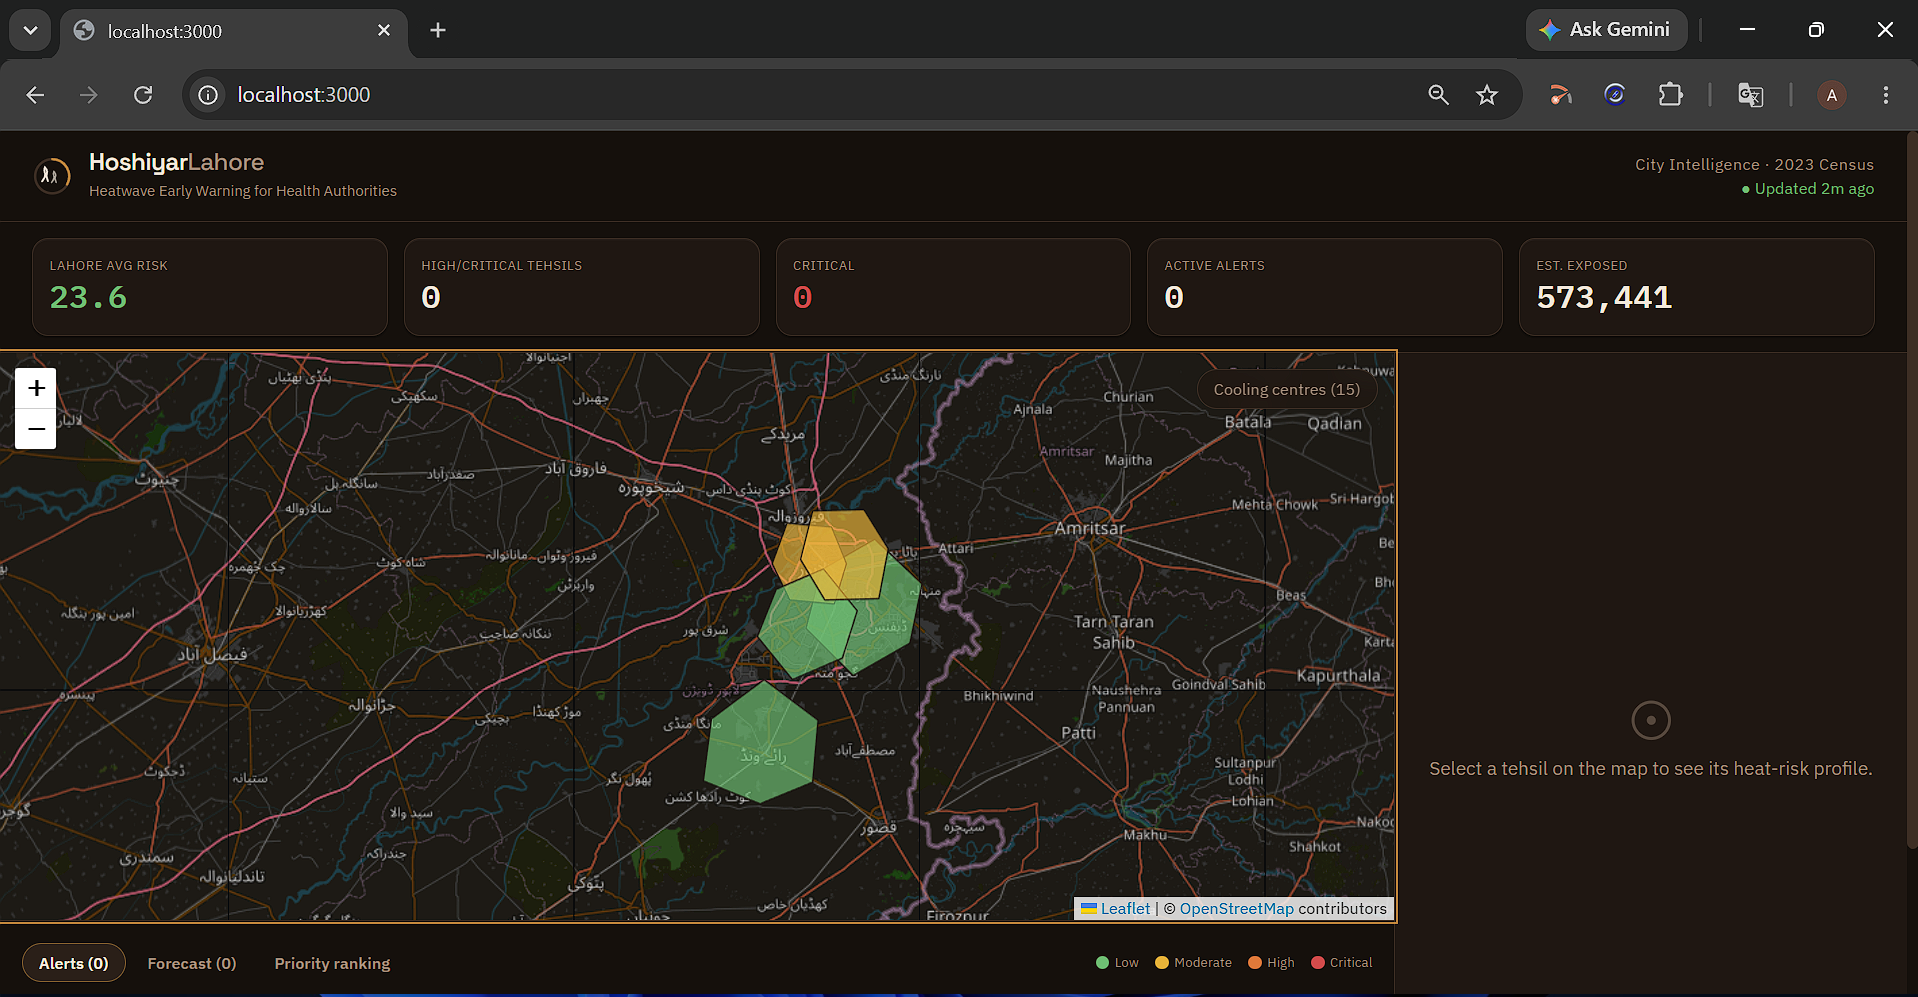
main interface
-
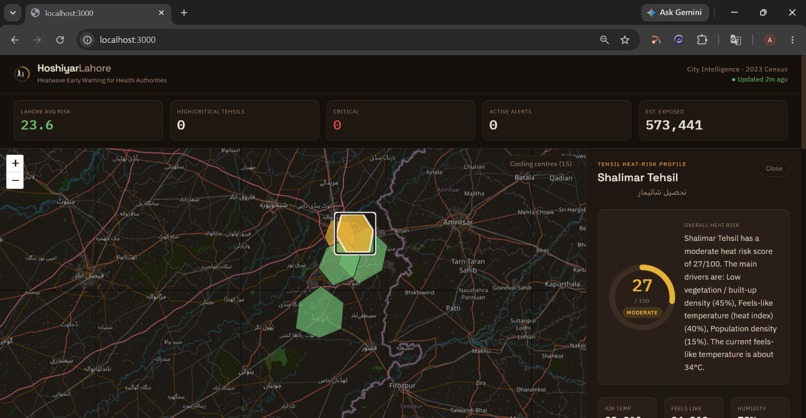
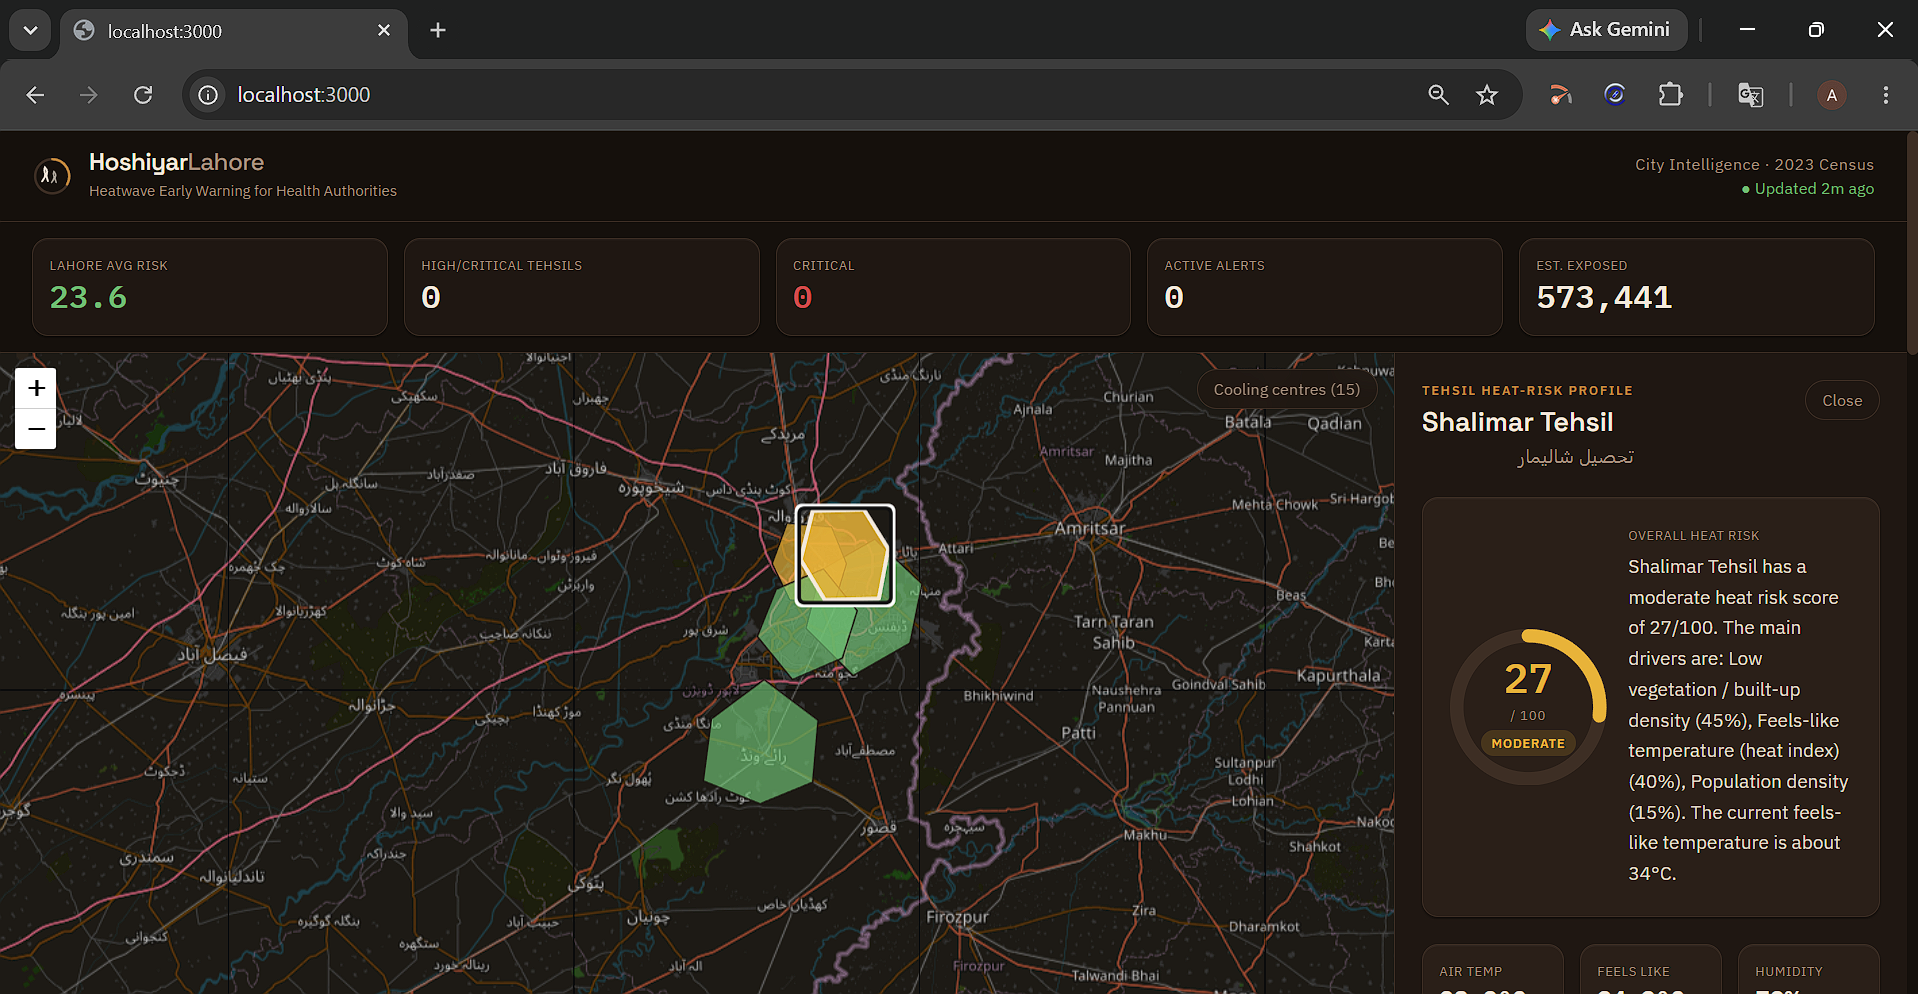
main interface with one tehsil selected
-
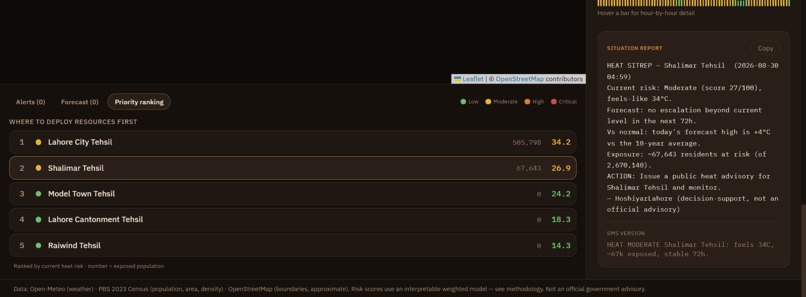
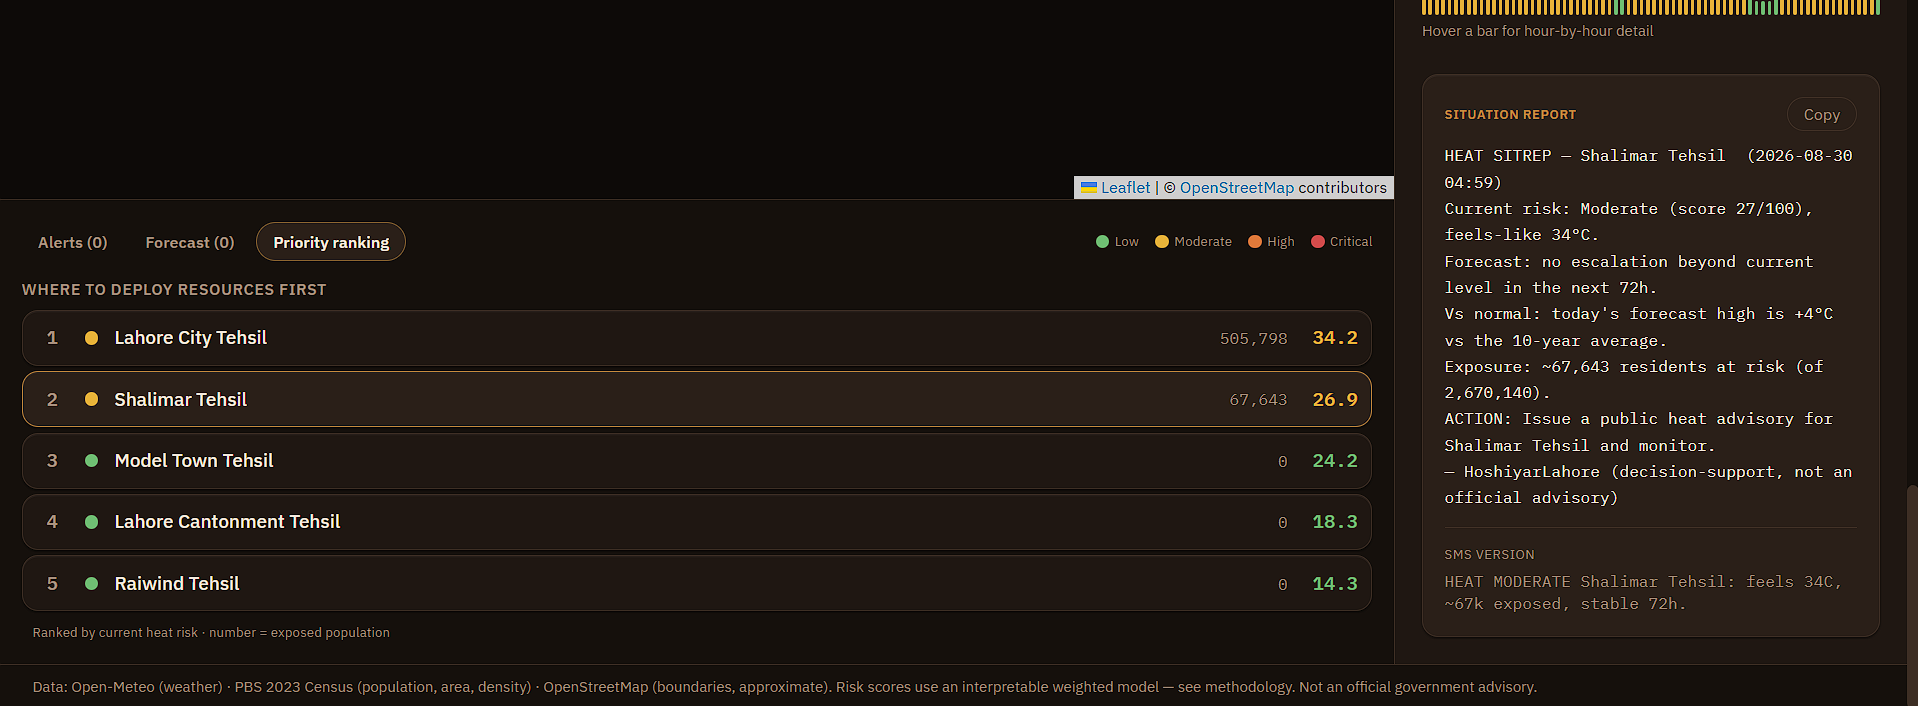
priority ranking of tehsils
-
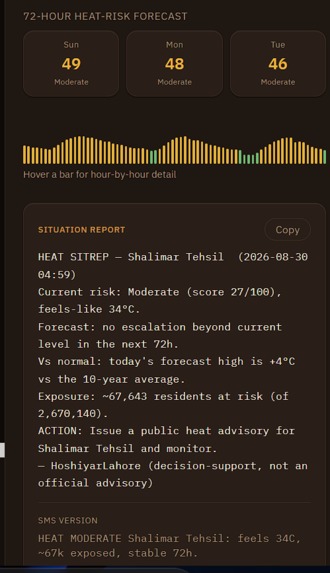
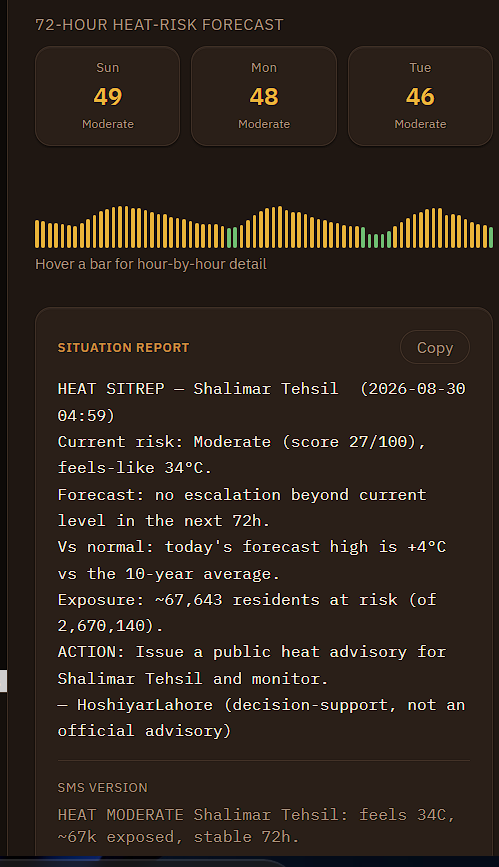
situation report of selected tehsil
-
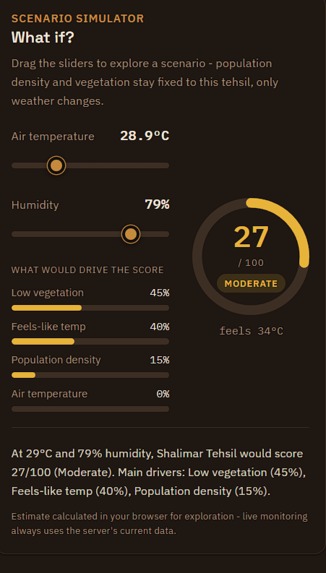
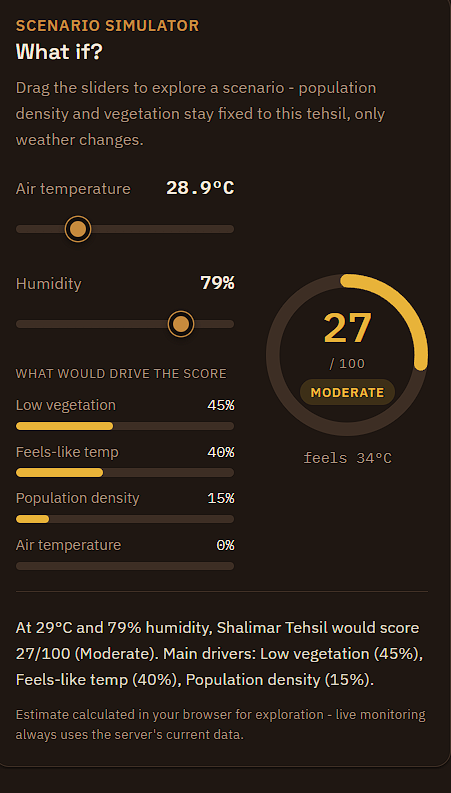
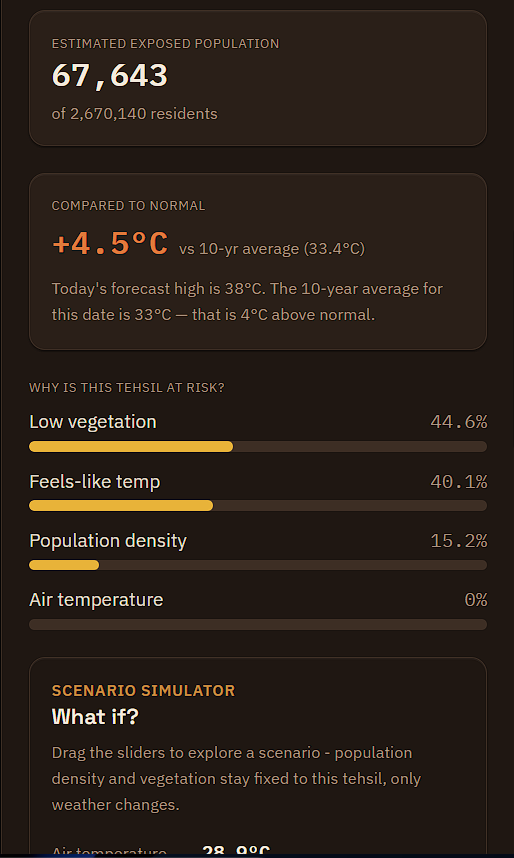
what if ? situation simulator of selected tehsil
-
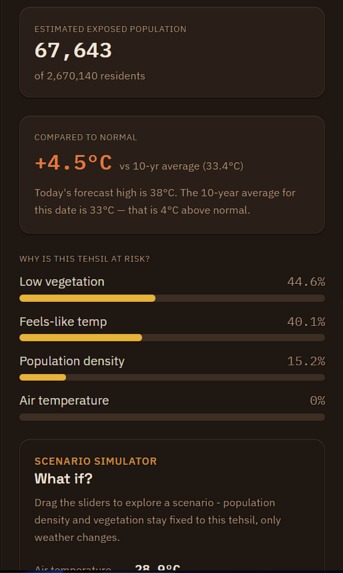
temperature analysis of selected tehsil
-
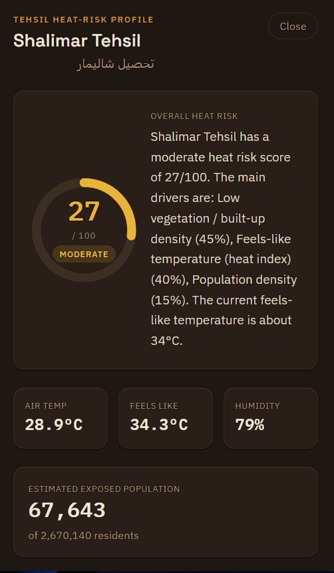
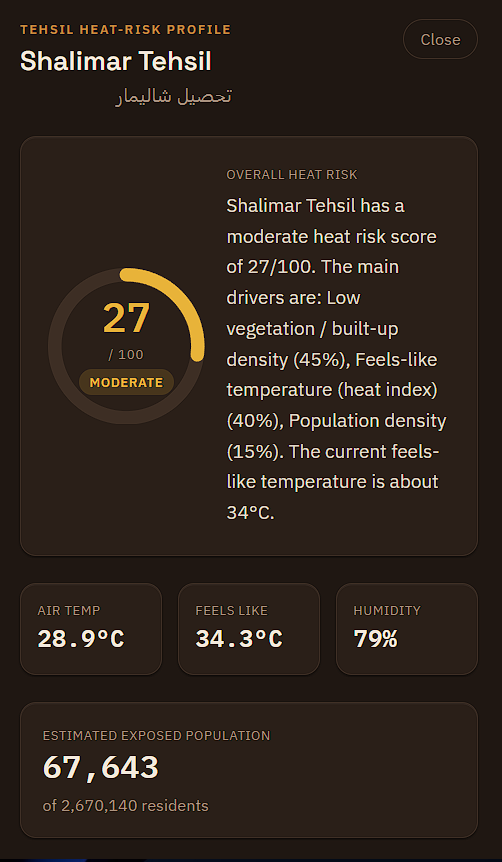
main information basic info about selected tehsil
Inspiration
Every summer, Lahore endures extreme heatwaves that push feels-like temperatures past 50°C. The people who suffer most are predictable but under-protected: the elderly, outdoor workers, and residents of dense, low-vegetation neighbourhoods where concrete and crowding trap heat.
Yet the Punjab Health Department's response today is reactive and city-wide — a general advisory goes out once temperatures spike, and cooling centres and outreach teams get deployed only after hospital admissions climb. There was no tool telling officials, in advance, which specific neighbourhoods would be hit hardest, how many vulnerable people lived there, or why — the exact information a resource-allocation decision actually needs. That gap, under this year's "City Intelligence" theme, is what HoshiyarLahore (ہوشیار — Urdu for "alert, watchful, prepared") set out to close.
What it does
HoshiyarLahore is a heatwave early-warning dashboard for health authorities. It scores heat risk for each of Lahore's five administrative tehsils (2023 census: Lahore City, Model Town, Shalimar, Lahore Cantonment, Raiwind), 72 hours ahead, and explains exactly why each area is at risk — so officials can act before the heat arrives, not after.
Concretely, it:
- Fuses live weather, official 2023 census population/density, and land-cover data into a 0–100 heat-risk score per tehsil, fully decomposed into each factor's contribution (e.g. "48% feels-like temperature, 24% air temperature, 22% low vegetation").
- Forecasts that same risk score 72 hours ahead, hour by hour, and issues predictive lead-time alerts — "Lahore City Tehsil expected to reach Critical heat risk in ~13 hours."
- Compares today's forecast high against each tehsil's 10-year historical normal for that calendar date.
- Generates an ordered priority-deployment ranking across all five tehsils, so limited resources go where they're needed first.
- Produces a copy-paste situation report and ≤160-character SMS brief per tehsil — current risk, forecast escalation, historical context, exposed population, and a concrete recommended action — ready to forward to a field team.
- Shows a toggleable map layer of candidate cooling-centre locations (hospitals, parks, large venues).
- Lets a user drag temperature/humidity sliders in a what-if simulator and watch the risk score, gauge, and attribution update live.
- Auto-refreshes itself — a background scheduler keeps live weather (hourly) and historical baselines (daily) current with no manual script-running, and honestly reports its own data freshness via
/api/status.
How we built it
- Backend: FastAPI (Python) + SQLite. SQLite was a deliberate choice — with only five spatial units, PostgreSQL/PostGIS complexity wasn't justified. Endpoints cover towns, town detail, forecast, situation reports, alerts, predictive alerts, priority ranking, cooling centres, status, and a manual refresh trigger.
- Risk engine: a pure-Python, interpretable weighted composite — not a black-box ML model — combining the NWS Rothfusz heat-index regression, air temperature, population density, and vegetation deficit. The final score is:
$$ \text{score} = 0.40 \cdot n(\text{heat_index}) + 0.25 \cdot n(\text{temperature}) + 0.20 \cdot n(\text{population_density}) + 0.15 \cdot n(\text{vegetation_deficit}) $$
where each \( n(\cdot) \) normalises a raw input to a 0–100 sub-score against documented anchor points (e.g. heat index: 27°C → 0, 54°C → 100). Every score decomposes into exact per-factor point contributions and percentages.
- Data: live weather and 72-hour forecasts from Open-Meteo (no API key needed); official Pakistan Bureau of Statistics 2023 Census Table 1 figures for population, area, and density; administrative boundaries and cooling-centre candidates from OpenStreetMap/Overpass. All five tehsils' figures are internally consistent (density = population ÷ area, exactly) and sum to Lahore District's official 2023 total of 13,004,135:
| Tehsil | Area (km²) | Population (2023) | Density (/km²) |
| Lahore City | 214 | 4,123,354 | 19,268 |
| Model Town | 353 | 3,244,906 | 9,192 |
| Shalimar | 272 | 2,670,140 | 9,817 |
| Lahore Cantonment | 466 | 1,885,098 | 4,045 |
| Raiwind | 467 | 1,080,637 | 2,314 |
- Scheduling: an in-process APScheduler background job refreshes weather hourly and historical baselines daily inside the same backend process — no external cron needed — and self-heals if the historical table is ever found empty (e.g. after a free-tier host's ephemeral filesystem wipe).
- Frontend: Next.js + Tailwind CSS + Leaflet, built around an "instrument panel" visual identity — Space Grotesk (display), IBM Plex Sans (body), IBM Plex Mono (all numbers), a bronze/ember accent palette, and a signature radial
RiskGaugedial. Fonts load via a plain<link>tag rather thannext/font/google, so the production build has zero network dependency. - What-if simulator:
frontend/src/lib/riskEngine.jsis a careful JavaScript port of the Python risk engine, so client-side slider interactions match server-computed scores. - Zero-setup fallback:
preview.html, a single static file with a snapshot of mock data, so a judge can see the full dashboard without running any backend at all. - Testing/verification: 25 passing automated unit tests across the risk engine, forecast logic, historical comparison, and situation-report generation, plus a verified
next buildproduction build.
Challenges we ran into
- Floating-point rounding mismatch between Python and JavaScript. Python's
round()uses round-half-to-even on a float's exact binary value; naive JavaScript rounding doesn't match. We traced this to a specific failing case (round(15.250000000000002, 1)), found the root cause was too loose an epsilon mistaking genuine floating-point noise for a true tie, and fixed it with a tight, principled epsilon — verified against 200 randomised inputs (≈80% exact match, worst case 0.1/100 off, risk band never wrong). - A silently-defaulted input broke the what-if slider.
/api/towns/{id}echoedpopulation_densitybut nevervegetation_deficit, so the new simulator silently defaulted it to 0 — producing a score of 46 instead of 59 for otherwise-identical inputs. Fixed by adding the missing field to the shared risk-response helper. - Auto-refresh had to survive a real hosting constraint. We deploy the backend on Render's free tier, and Render spins the process down after 15 minutes with no incoming traffic — while it's asleep, the process doesn't exist, so the in-process auto-refresh scheduler isn't running either. Free-tier Render also has an ephemeral filesystem: every spin-down/restart wipes local files, including the SQLite database. Left unhandled, that meant the app could wake up to an empty database and historical baselines could sit missing for up to 24 hours (they normally only rebuild once a day, since fetching 10 years of archive data isn't cheap). We fixed this by making the backend self-heal on every cold start: the moment the process wakes up, it immediately re-seeds the towns table and re-fetches current weather, and separately checks whether the historical-baseline table is empty and, if so, rebuilds it immediately too — instead of waiting for the next scheduled cycle. So even though the backend can't stay "always on" for free, every time it does spin up it automatically pulls the latest temperatures right away, rather than serving stale or missing data. We also built an optional keep-alive GitHub Actions workflow (
keep-alive.yml) that would ping the backend every 10 minutes to stop it from sleeping at all — but it isn't reliably working in our GitHub setup yet, so for now we're not relying on it and are shipping with the self-healing cold-start behaviour as the honest, working safety net. - An external service changed its policy mid-build. The map's original dark tile provider (CARTO) began requiring an API key and stamped an "API KEY REQUIRED" watermark on unauthenticated requests — not a bug in our code, but an upstream policy change. We switched to plain OpenStreetMap tiles (which have never required a key) and faked the dark theme with a scoped CSS filter that leaves the actual risk-band colours untouched.
- A build-time network dependency almost broke deployability. The initial font setup used
next/font/google, which downloads fonts during the build itself — meaning the whole build would fail if the build machine couldn't reach Google Fonts (which happened in our own sandboxed dev environment). We switched to a plain<link>tag so the build has zero network dependency and gracefully falls back to system fonts if needed. - Proving the model actually differentiates neighbourhoods, not just temperature. We ran a controlled test holding weather identical (44°C, 30% RH) across all five tehsils and still saw scores spread ~17 points — Lahore City reaching Critical (76) while Raiwind stayed at High (60) — driven purely by population density and vegetation deficit. That confirmed the weighting captures real neighbourhood vulnerability rather than just reporting a thermometer reading.
Accomplishments that we're proud of
- A fully interpretable risk model: no score is ever a mystery — every point is traceable to a named factor and percentage, which matters when a health official has to act on it.
- Every population and density figure is an official, sourced 2023 census number, cross-validated for internal consistency (density = population ÷ area exactly) for all five tehsils — not an estimate, and clearly labelled
verified: true. - A working closed loop from insight to action: risk score → forecast → priority ranking → cooling-centre placement → copy-paste SITREP/SMS a field team can actually use, not just a dashboard number.
- 25/25 passing automated tests and a verified, network-independent production build.
- A background scheduler that keeps the whole system current with zero manual intervention, and is honest about its own freshness and failures rather than silently going stale.
- A zero-setup
preview.htmlso anyone can see the full product with no install step at all.
Known limitations (stated honestly)
- Vegetation deficit is currently a reasoned per-tehsil proxy estimate (old dense city ≈ 0.88, greener planned areas ≈ 0.55, peri-urban ≈ 0.45), not yet derived from satellite NDVI.
- Weather is fetched at each tehsil's centroid and applied tehsil-wide — a reasonable simplification for five large units, not a fine-grained grid.
- The 40/25/20/15 weights are a reasoned, documented starting point, not empirically fitted to Lahore heat-outcome data (which isn't openly available at tehsil level).
- We validated the weights differentiate real vulnerability, not just temperature: holding weather identical (44°C, 30% RH) across all five tehsils, scores still spread ~17 points — Lahore City reaching Critical (76) while Raiwind stayed at High (60) — driven purely by density and vegetation deficit.
What we learned
- Explainability is a feature, not a compromise. For a civic, public-health resource-allocation tool, being able to show why a score is what it is — rather than chasing marginal accuracy from a black-box model — is what actually makes it trustworthy and usable by an official.
- Data honesty has to be engineered in, not just claimed. Flagging mock vs. live data, verified vs. unverified populations, and candidate vs. official cooling centres throughout the API and UI (not just in documentation) turned out to require real design discipline at every layer.
- Free-tier and third-party infrastructure will change under you. Both the tile-provider policy change and the ephemeral-filesystem behaviour on free hosting were things we only discovered by building and testing against real deployment conditions, not by reading documentation in advance.
- Cross-language ports need explicit verification, not assumption. Porting the risk engine to JavaScript for the client-side what-if simulator surfaced a subtle floating-point rounding discrepancy that would have been invisible without deliberately testing hundreds of randomised inputs against the Python original.
What's next for HoshiyarLahore
- Real OSM-traced tehsil boundaries in place of the current defensible approximate polygons.
- Satellite NDVI to replace the current vegetation-deficit proxy estimate, without changing the model's structure.
- More tehsils and cities — the architecture is data-driven, not hardcoded, so extending to Karachi, Multan, or any city with population and weather data is a configuration change, not a rebuild.
- More hazards — the same interpretable-scoring pattern extends naturally to flood risk, air-quality/heat compounding (PM2.5 overlay), or water stress.
- Direct integration into existing government workflows — the situation-report and SMS features are already designed to plug into the WhatsApp/SMS-based field communication health departments use today, rather than requiring a new channel.
- Getting the keep-alive workflow working so the Render backend never has to sleep at all, and/or moving to a paid Render instance (no spin-down, persistent disk) once the project moves past the hackathon stage.
Built With
- apscheduler
- fastapi
- geojson
- github
- javascript
- leaflet.js
- nextjs
- open-meteo
- openstreetmap
- overpass-api
- pakistan-bureau-of-statistics
- python
- react
- react-leaflet
- render
- rest-api
- shapely
- sqlite
- tailwindcss
- uvicorn
- vercel

Log in or sign up for Devpost to join the conversation.