Inspiration
Extreme heat is becoming a serious urban safety challenge, especially for older adults, children, people with chronic conditions, outdoor workers, and anyone who must move through cities during high-temperature periods.
Most navigation systems optimize only for time and distance. They do not consider how exposed a pedestrian may be to direct sunlight, high apparent temperature, limited shade, or the absence of nearby cooling resources.
HeatShield AI was inspired by a simple question:
What if a city route could be evaluated not only by how fast it is, but also by how safe it is under extreme heat?
Our goal was to build a practical, explainable platform that combines live weather, urban map data, heat-aware routing, and personalized risk assessment in one system.
What it does
HeatShield AI is an AI-powered urban heat-safety platform that helps users understand and reduce their exposure to dangerous heat conditions.
The platform provides:
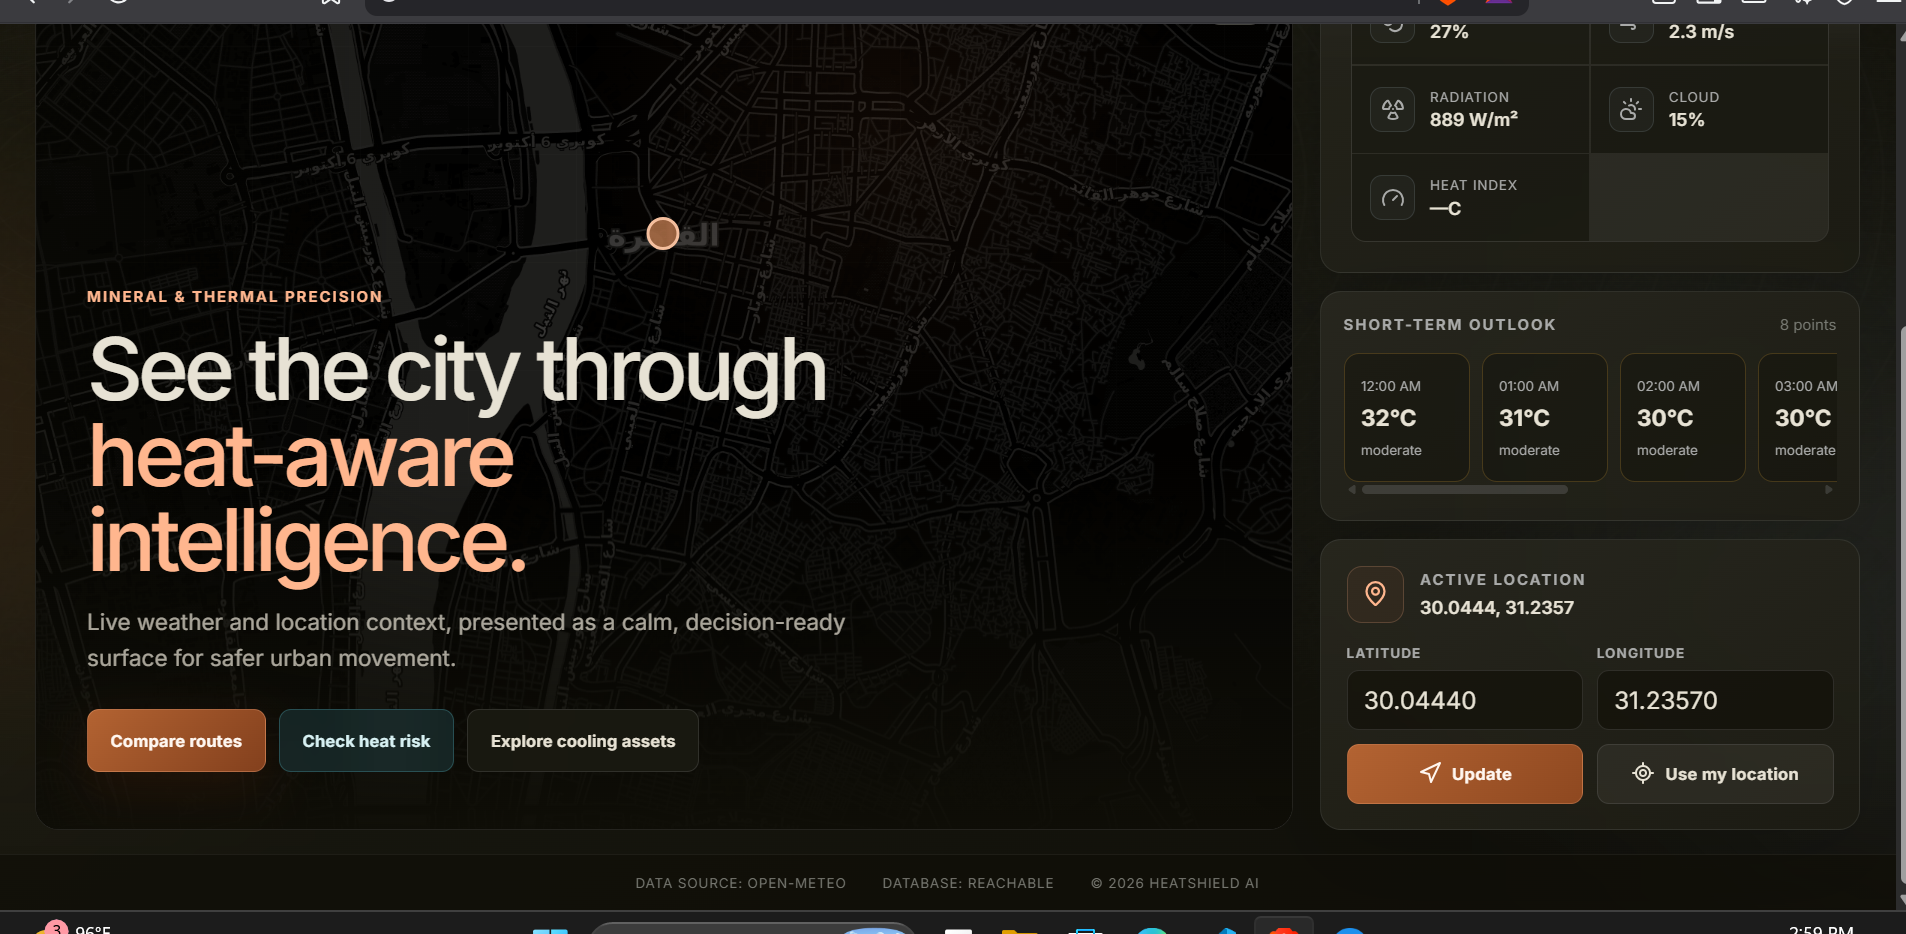
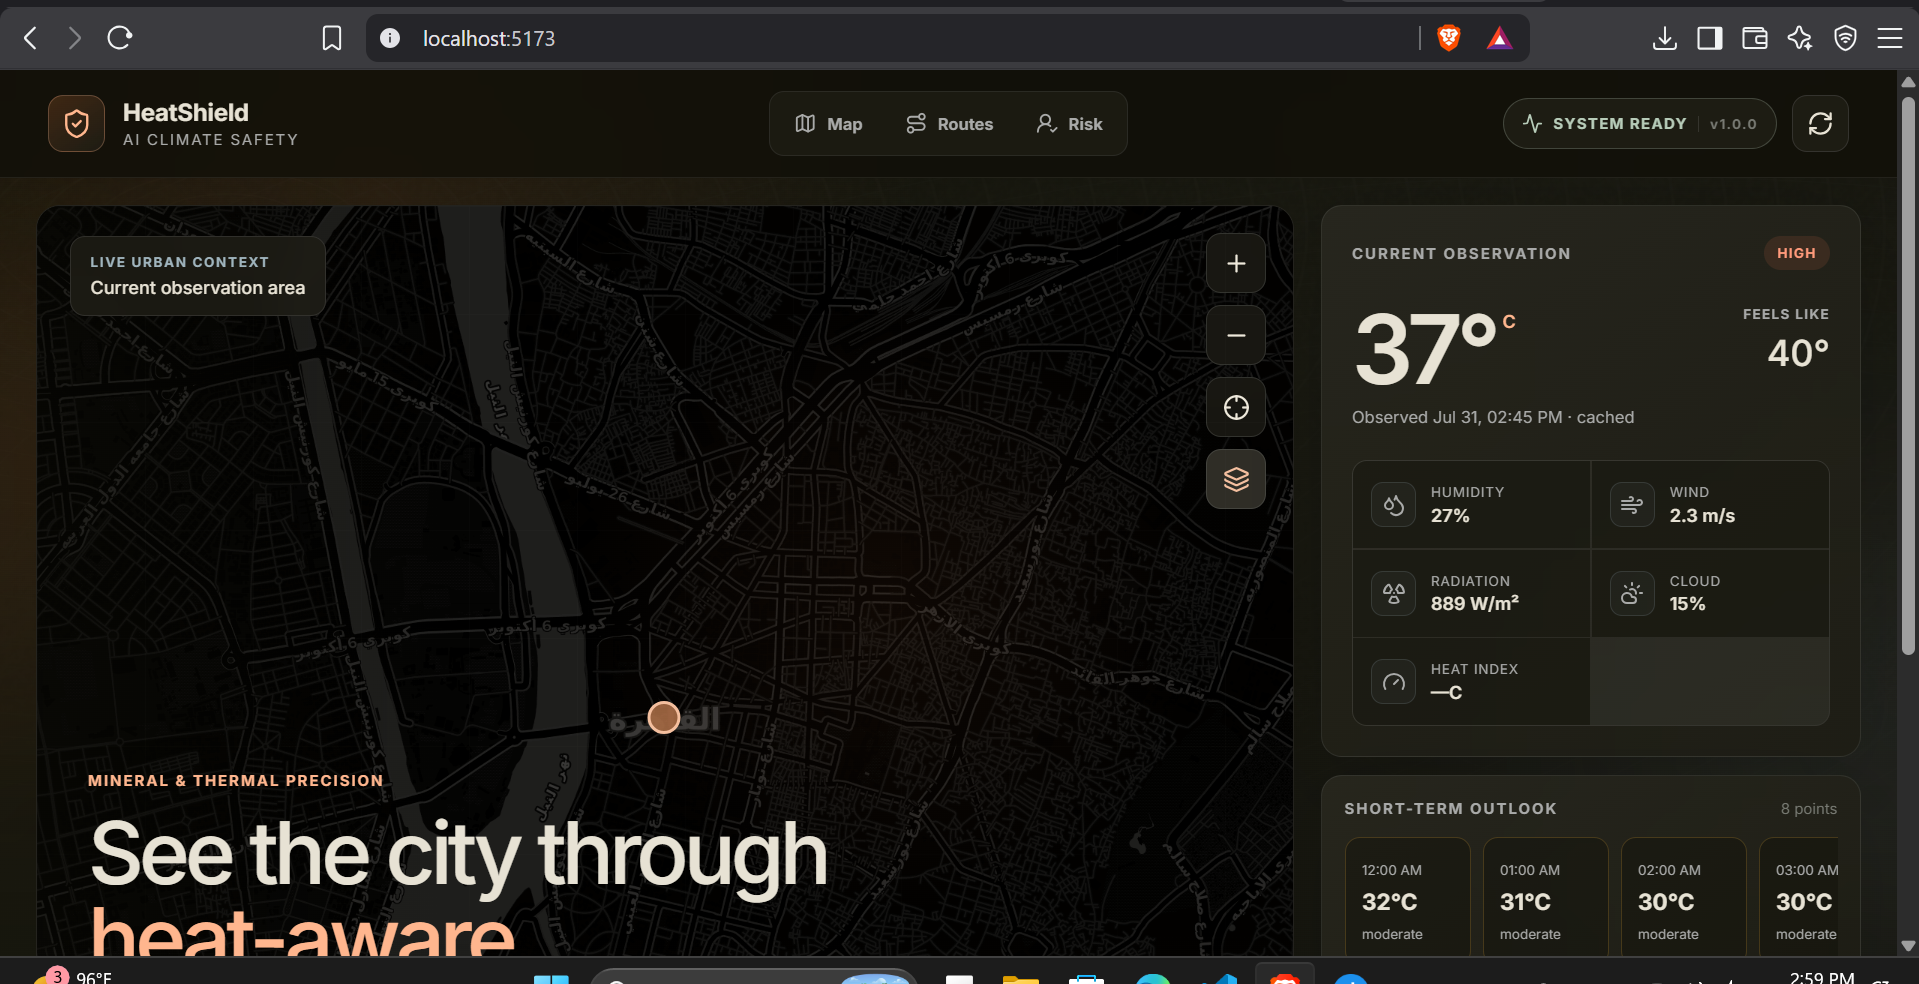
- Live weather conditions, including temperature, apparent temperature, humidity, wind, cloud cover, radiation, and thermal stress level.
- Short-term weather forecasts for the selected location.
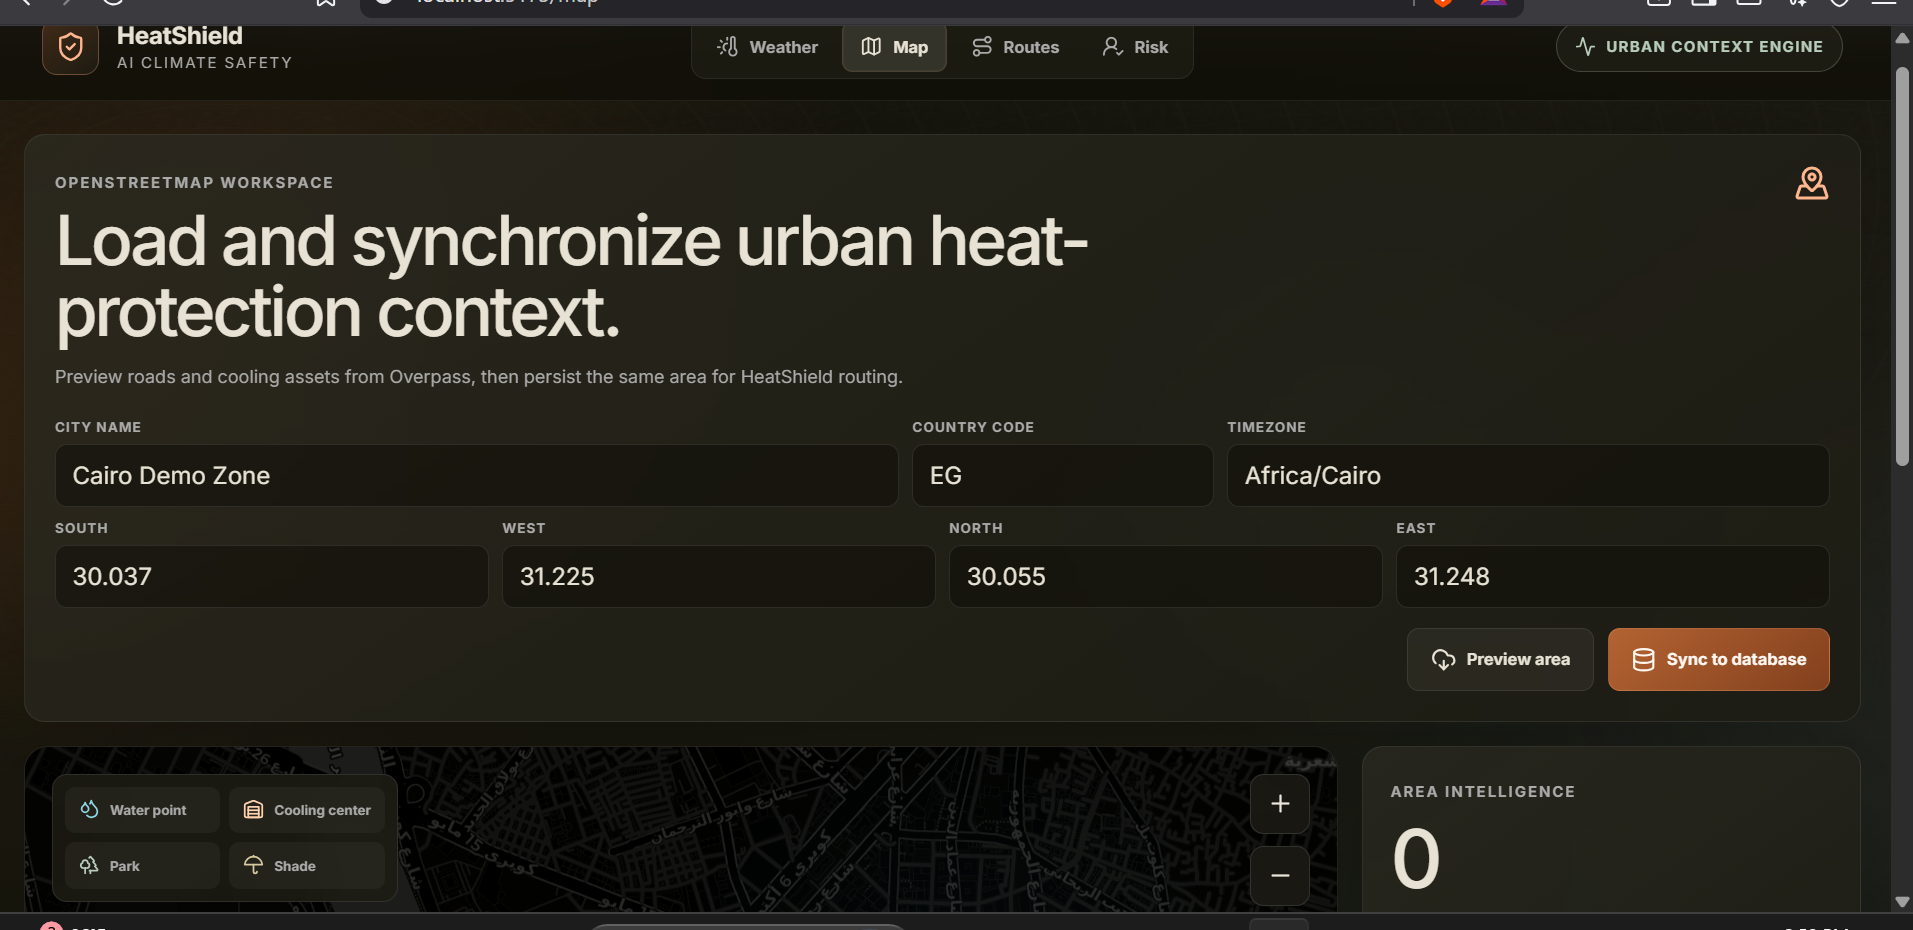
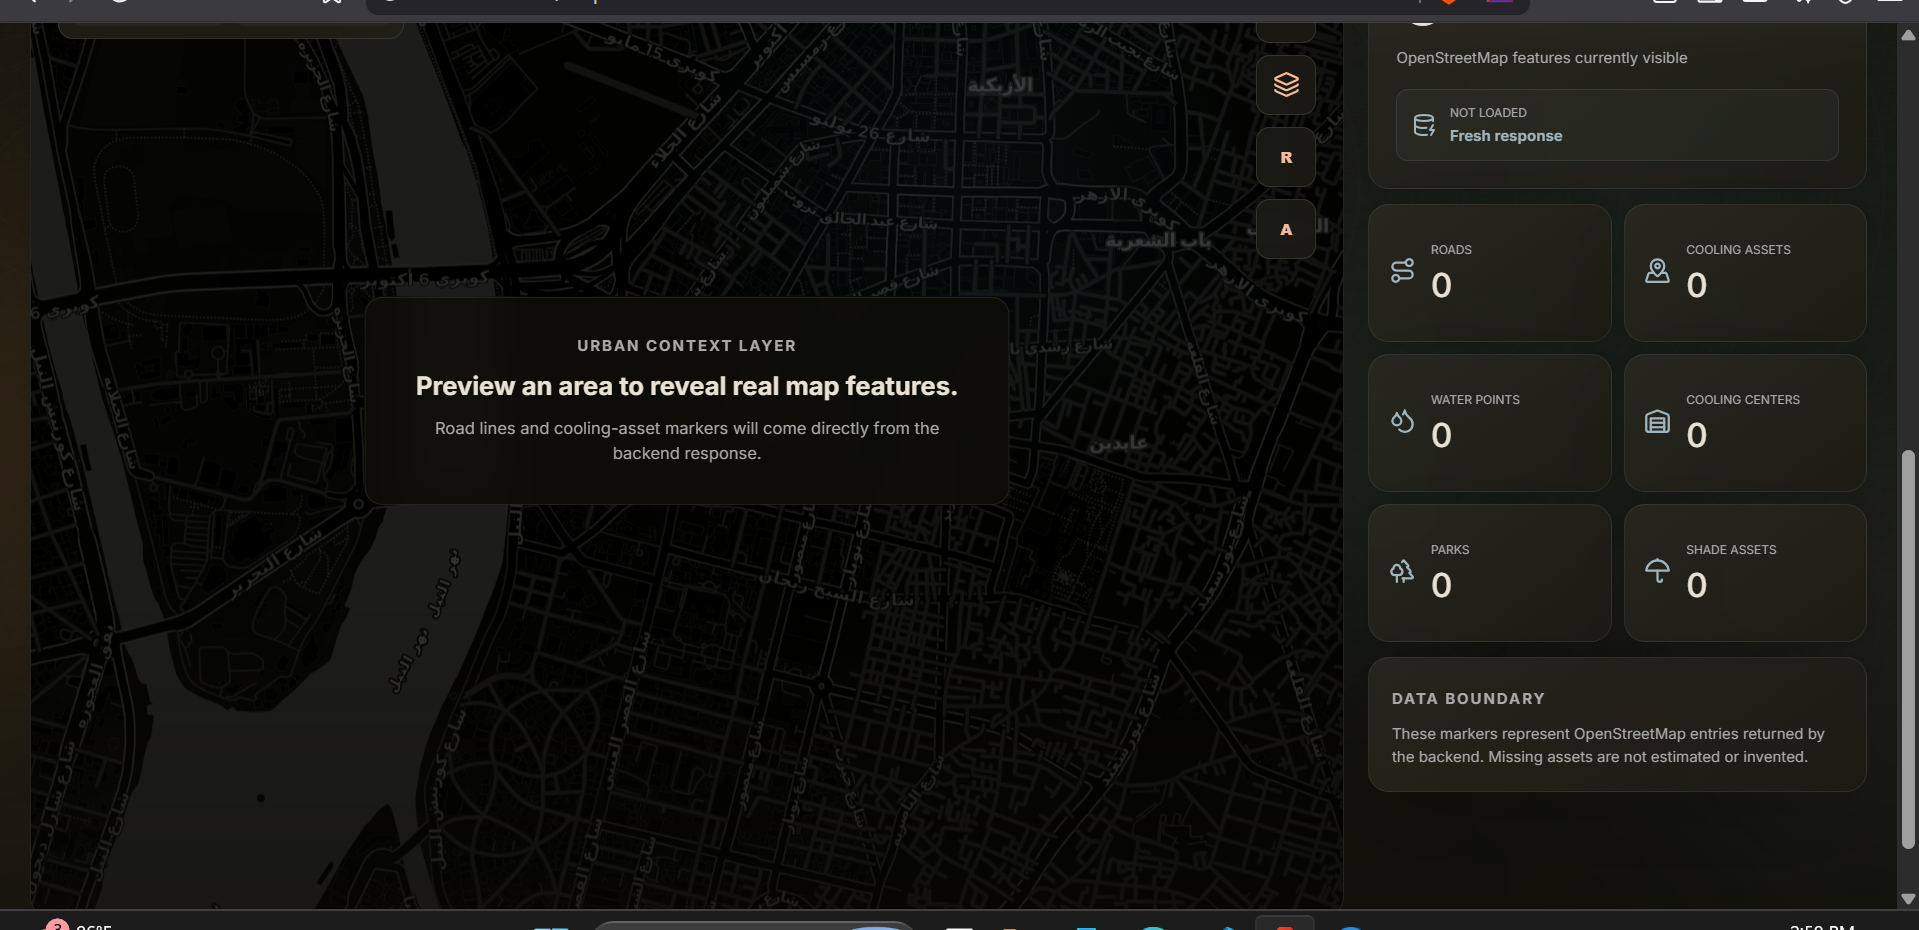
- An interactive map that displays real roads and heat-protection assets collected from OpenStreetMap.
- Cooling asset visualization, including water points, parks, shelters, cooling centers, and shade-related locations.
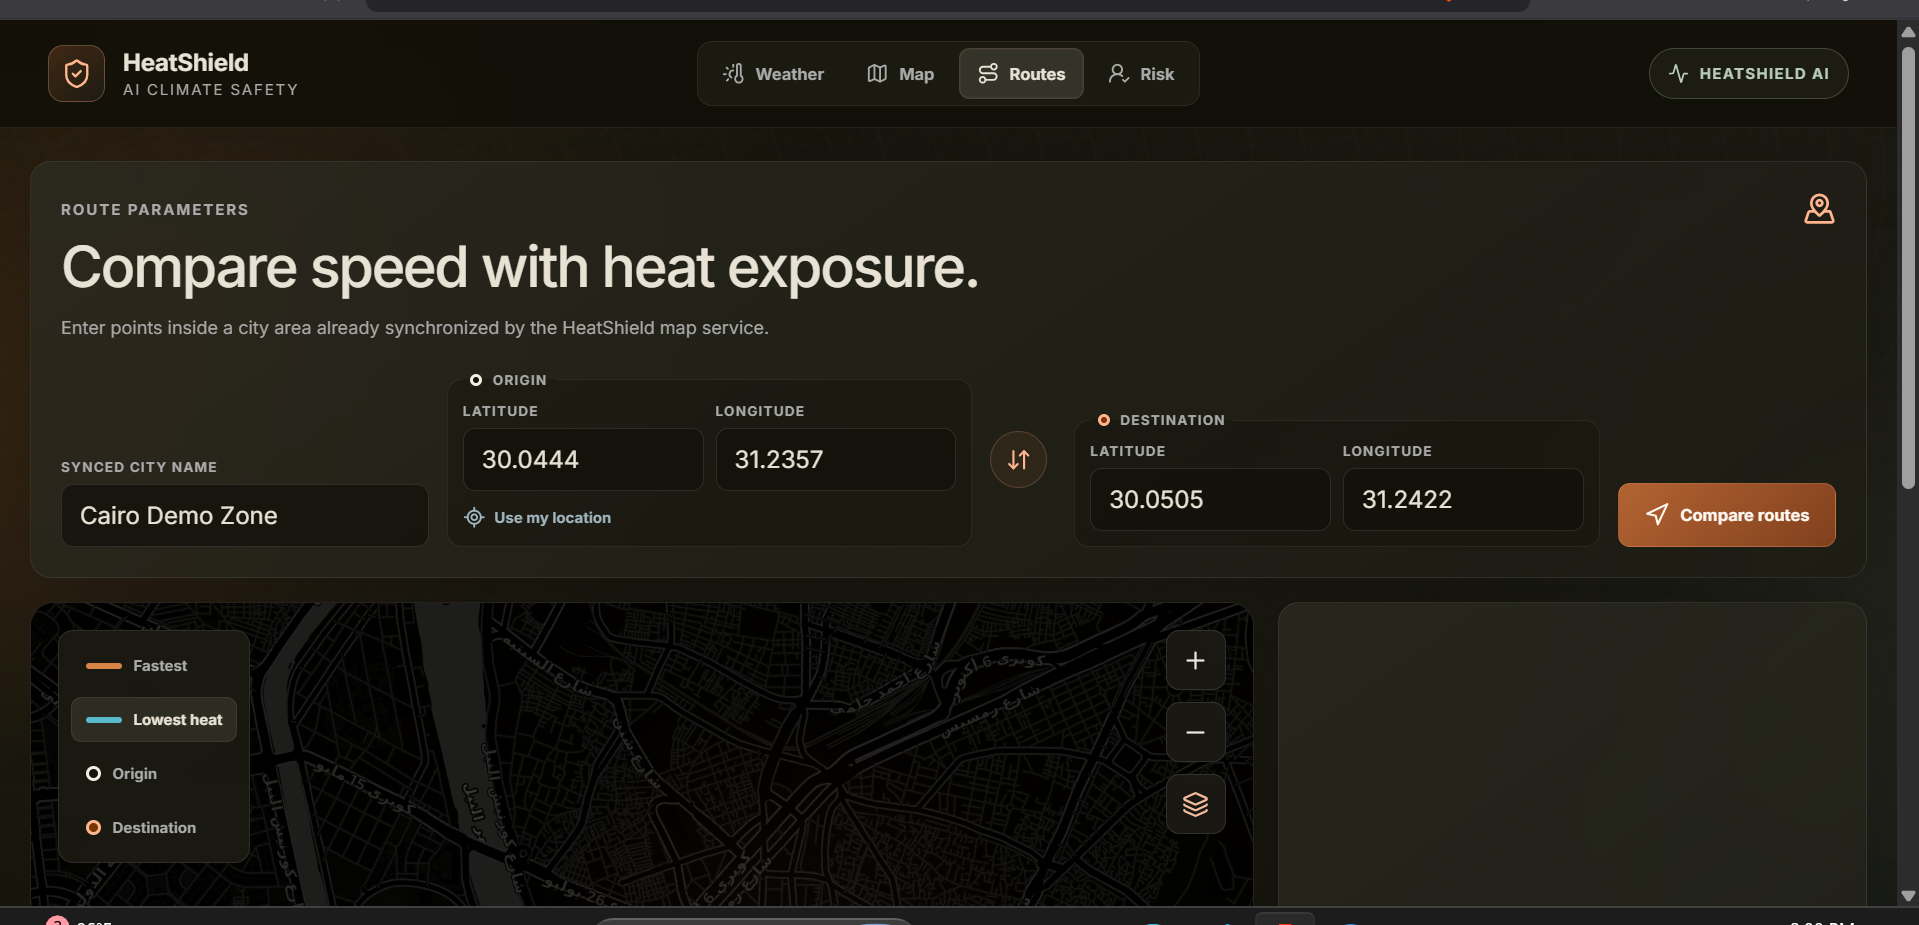
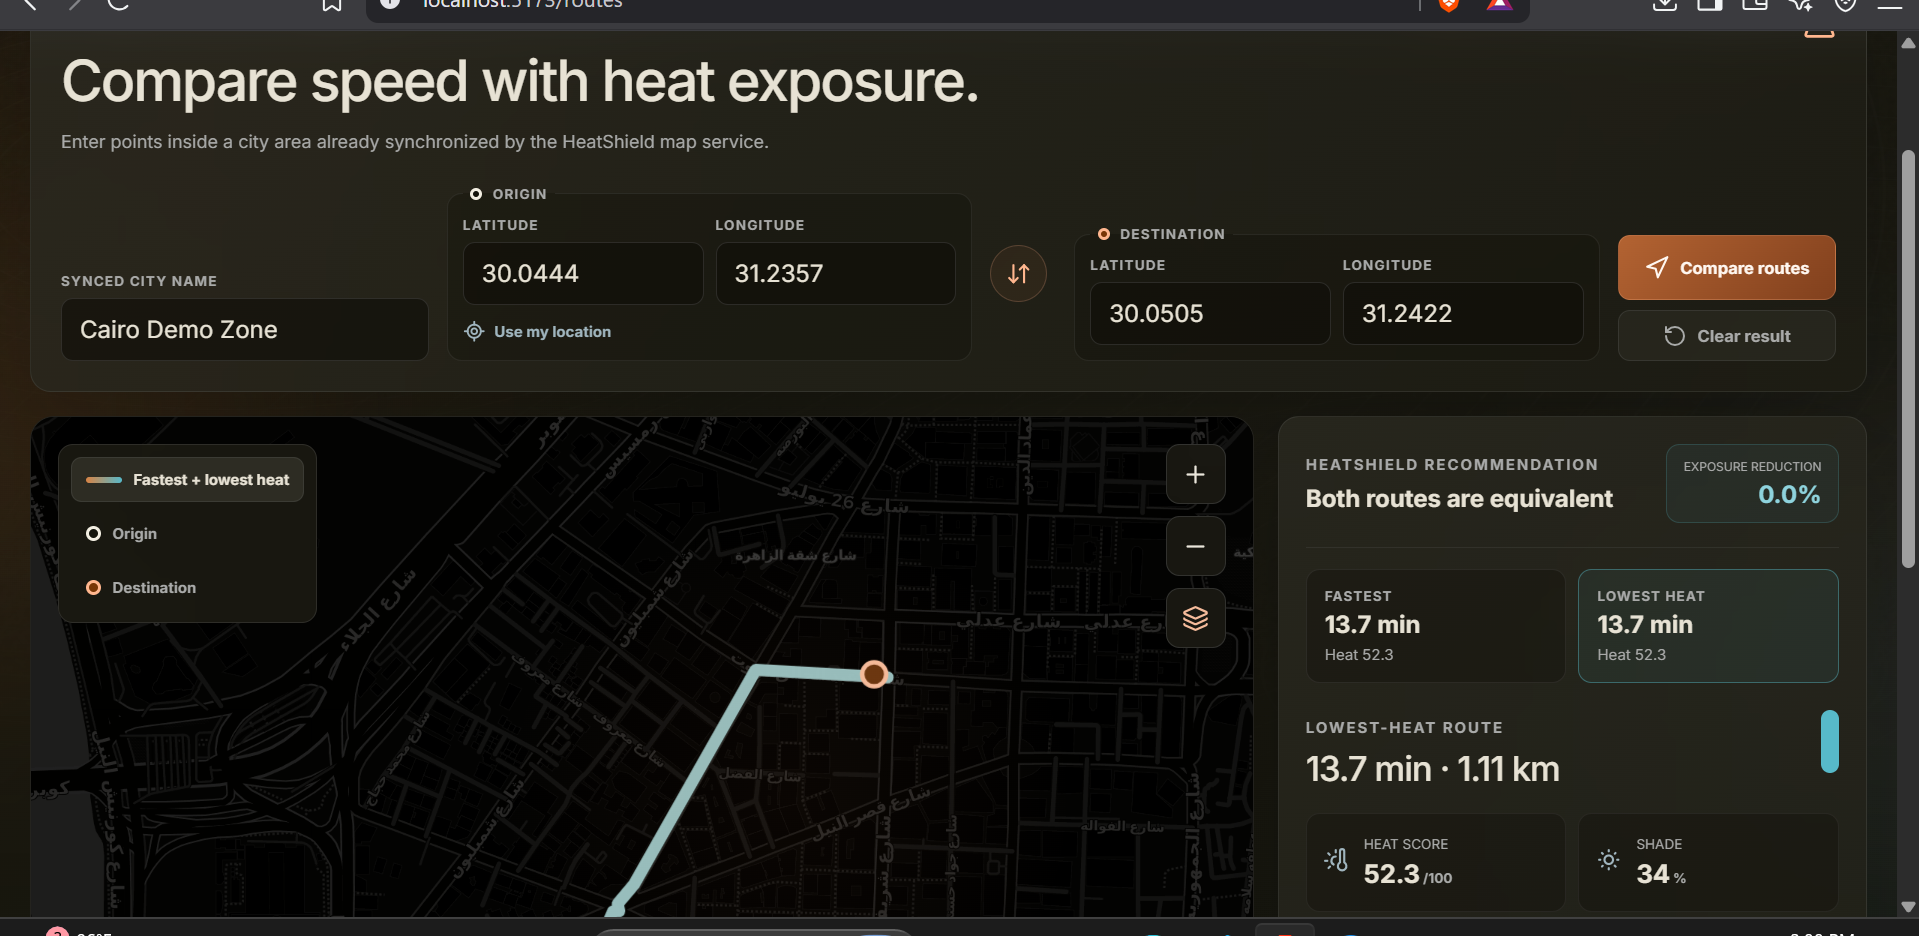
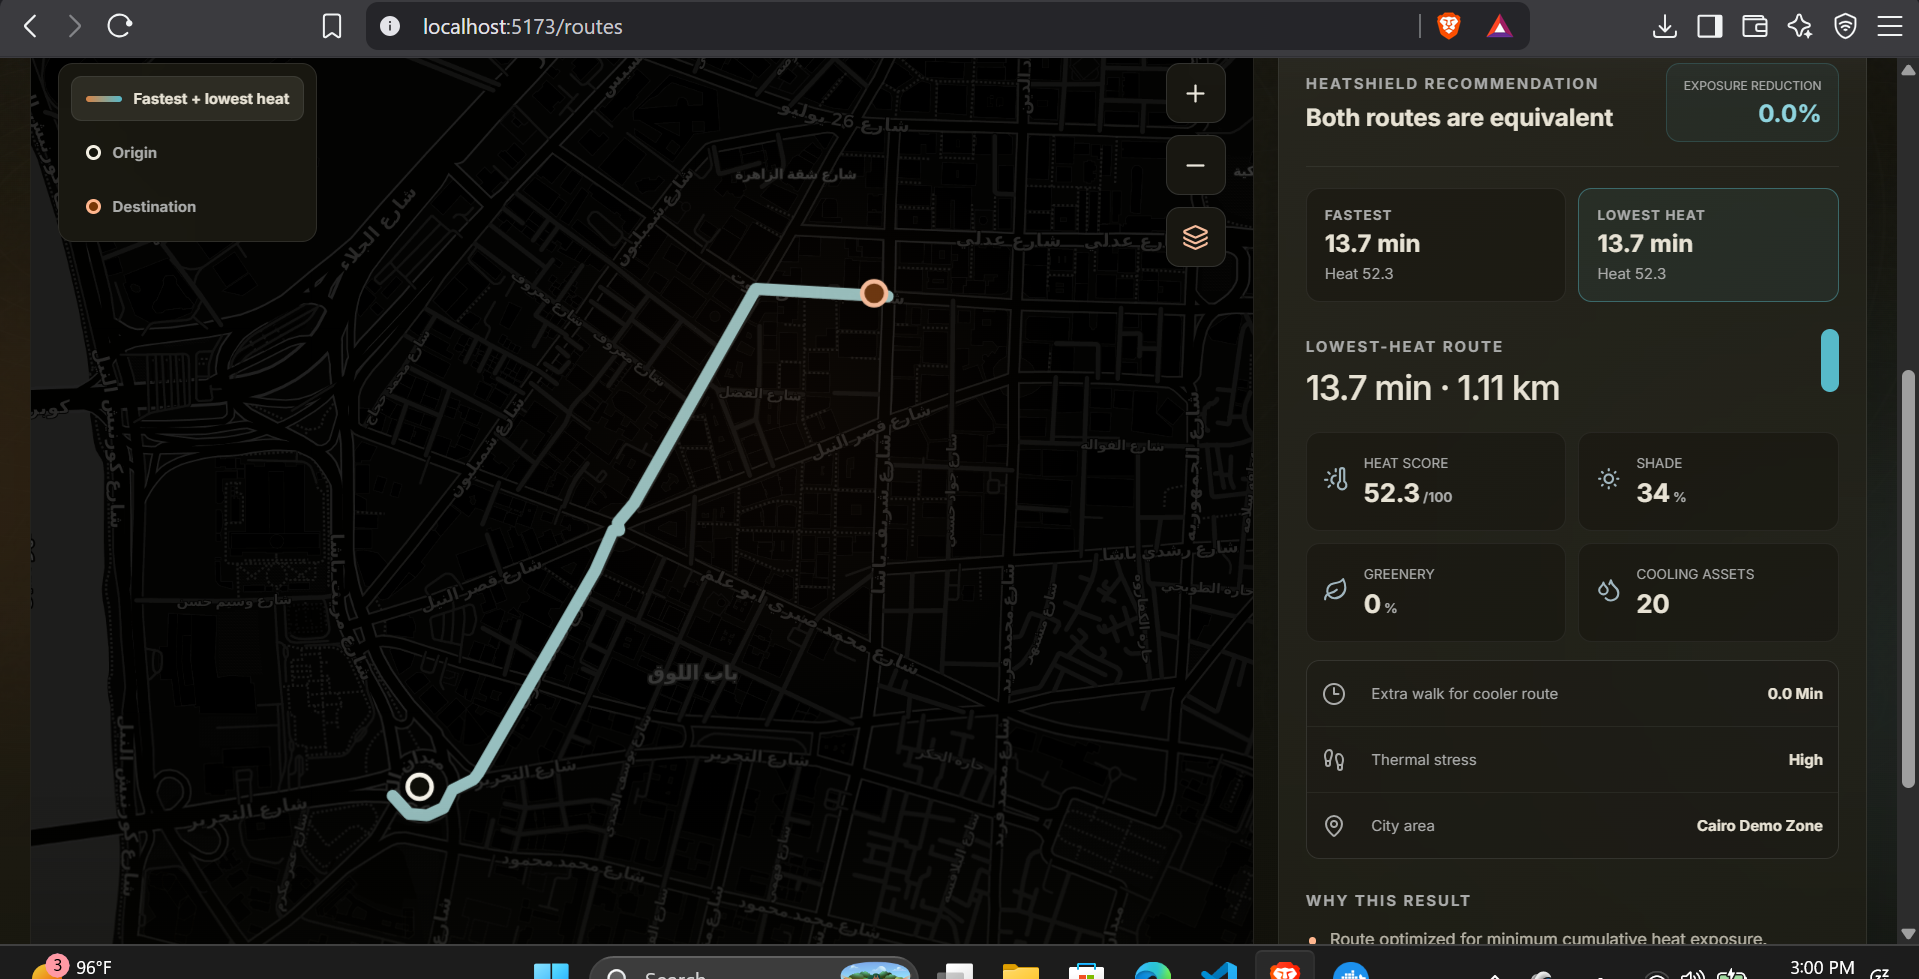
- A route comparison system that compares:
- The fastest walking route.
- The route with the lowest estimated heat exposure.
- Route metrics such as walking time, distance, shade score, greenery score, heat exposure score, and nearby cooling assets.
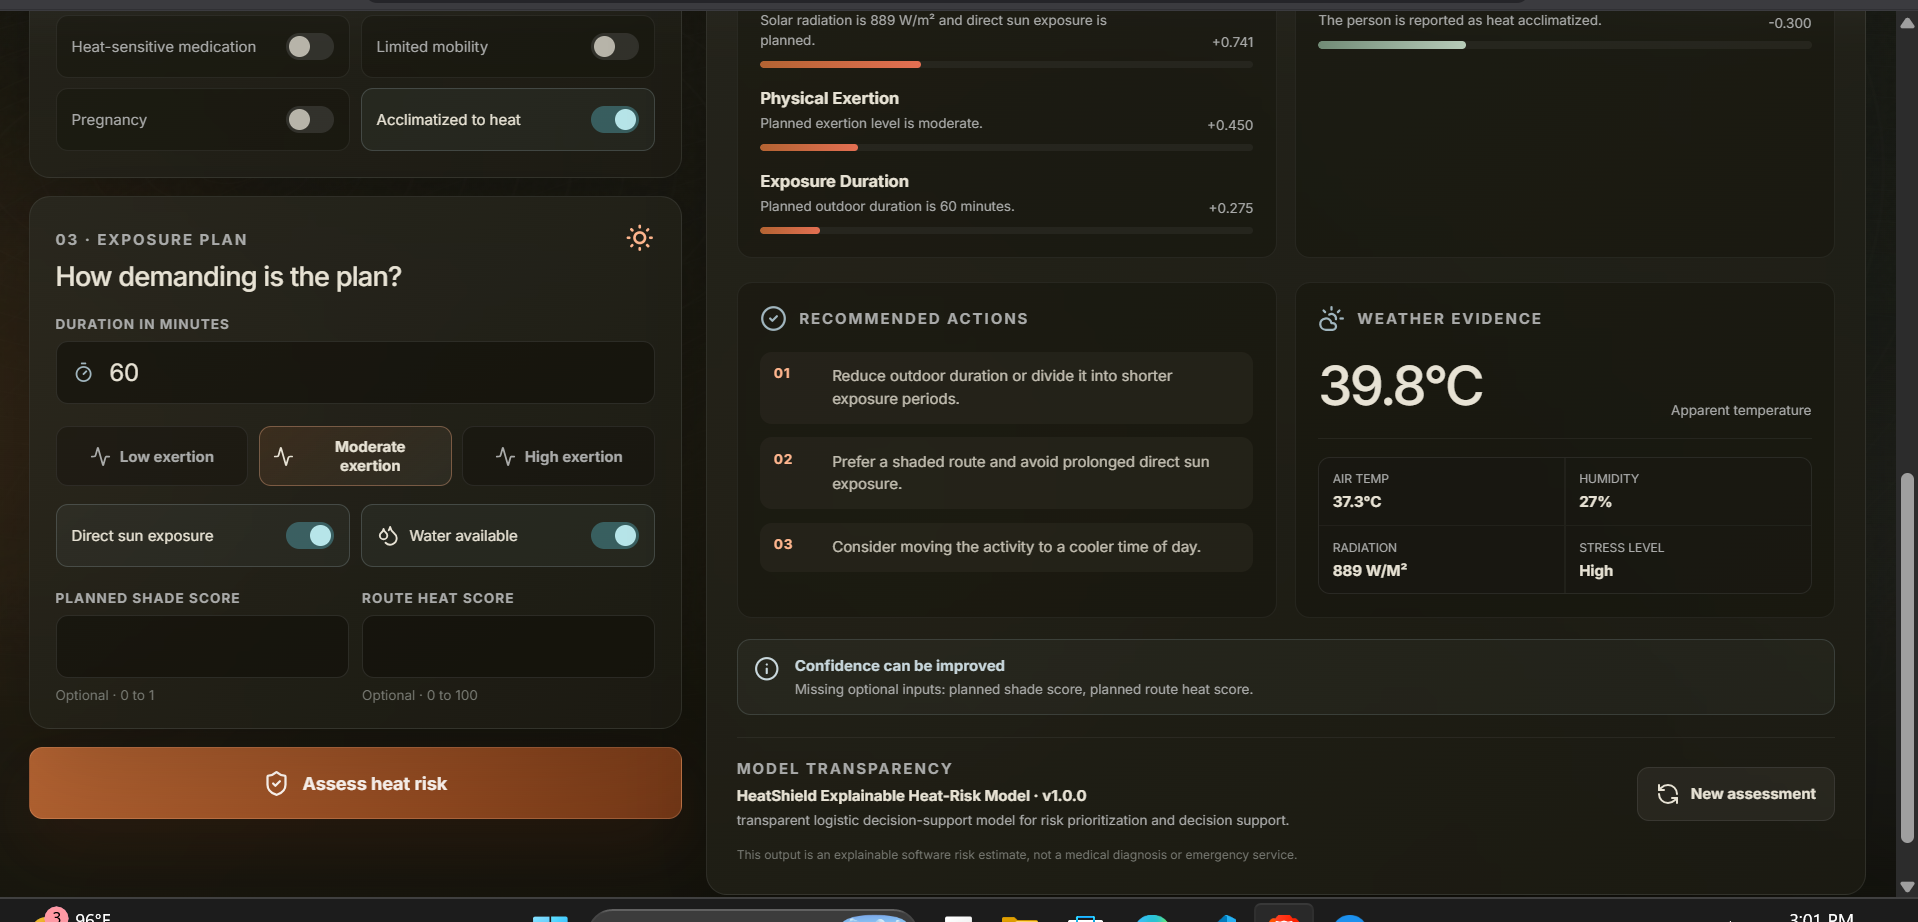
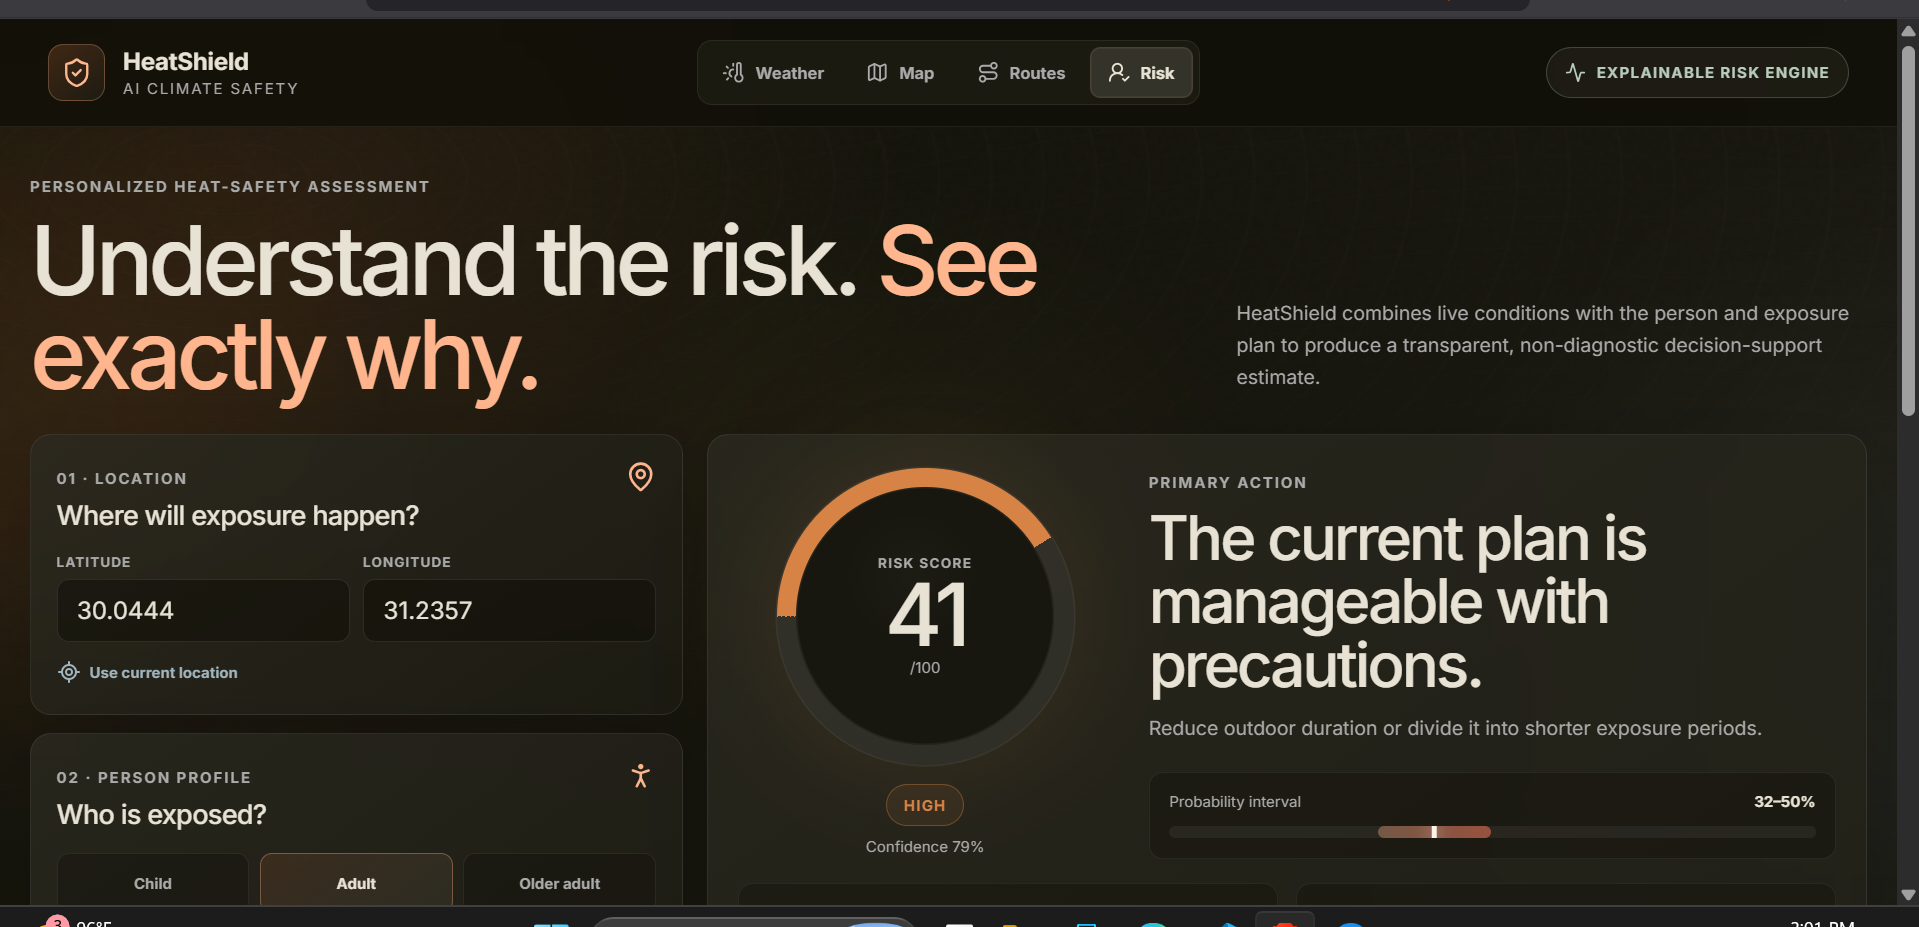
- A personalized heat-risk assessment based on:
- Age group.
- Chronic conditions.
- Heat-sensitive medications.
- Mobility limitations.
- Pregnancy.
- Heat acclimatization.
- Exposure duration.
- Physical exertion.
- Direct sunlight.
- Water availability.
- Planned shade and route heat scores.
- Explainable results showing the main risk contributors, protective factors, confidence interval, weather evidence, and recommended actions.
The system does not present its result as a medical diagnosis. It is designed as an explainable decision-support tool for safer planning during hot weather.
How we built it
We built HeatShield AI as a modular full-stack system.
Backend
The backend was developed using FastAPI and Python.
It provides REST API endpoints for:
- System health and readiness.
- Live weather observations.
- Weather forecasts.
- OpenStreetMap feature collection.
- City map synchronization.
- Heat-aware route comparison.
- Personalized heat-risk assessment.
We used Pydantic for strict input validation and clear API schemas.
Urban road and cooling-asset data is collected through the OpenStreetMap Overpass API. The map service processes road geometries, parks, drinking-water points, shelters, community centers, and shade-related assets.
Spatial data is stored using PostgreSQL, PostGIS, SQLAlchemy, and GeoAlchemy2.
The routing system evaluates connected road segments using multiple factors instead of distance alone. These include walking time, heat exposure, shade, greenery, and nearby cooling resources.
The personalized risk engine produces an explainable score instead of returning only a final label. It exposes risk contributors, protective factors, uncertainty, confidence, recommendations, and weather evidence.
Frontend
The frontend was developed using:
- React
- TypeScript
- Vite
- React Router
- Leaflet
- React Leaflet
The interface follows a custom visual system called Mineral and Thermal Precision, using dark mineral surfaces, copper heat accents, mist-blue cooling indicators, topographic textures, and subtle thermal animations.
The frontend includes four connected experiences:
- Live weather dashboard.
- Urban map and cooling-asset explorer.
- Heat-aware route comparison.
- Personalized heat-risk assessment.
Every functional value shown in the interface is connected to a real backend response. Decorative elements such as thermal waves, map atmosphere, topographic textures, and animated gauges are used only for visual communication and do not represent fabricated data.
Challenges we ran into
One of the main challenges was connecting different data sources into one reliable pipeline.
Weather data, map geometry, spatial databases, routing logic, and personalized risk factors all have different formats and validation requirements. We had to create clear schemas and service boundaries so each component could communicate safely with the others.
Another challenge was creating a meaningful heat-aware route comparison. A route cannot simply be labeled safe or unsafe based on temperature alone. The system had to balance:
- Walking duration.
- Distance.
- Apparent temperature.
- Radiation.
- Shade.
- Greenery.
- Cooling resources.
We also had to avoid displaying unsupported or fabricated information. For example, when the backend returns only the number of cooling assets near a route, the frontend displays the real count instead of inventing asset locations.
Designing the interface was another important challenge. We wanted the platform to feel advanced and visually impressive while remaining clear, accessible, and useful during stressful heat conditions.
Accomplishments that we're proud of
We are proud that HeatShield AI became a complete working platform rather than only a visual prototype.
Our main accomplishments include:
- Building a modular backend with validated API contracts.
- Integrating live weather and short-term forecasts.
- Collecting real road and cooling-asset data from OpenStreetMap.
- Storing and processing spatial data with PostGIS.
- Comparing the fastest and lowest-heat walking routes.
- Building an explainable personalized heat-risk engine.
- Showing uncertainty and confidence instead of presenting AI results as absolute.
- Creating a fully responsive frontend with real interactive maps.
- Maintaining a strict separation between decorative visuals and real data.
- Writing automated backend tests for the main services and endpoints.
What we learned
We learned that building a responsible AI system requires much more than producing a prediction.
A useful system must also explain:
- Why the result was produced.
- Which inputs increased the risk.
- Which factors reduced the risk.
- How confident the system is.
- What the user can do next.
We also learned how spatial data, weather APIs, routing algorithms, databases, and frontend visualization can be combined into one product.
Most importantly, we learned that good AI products should communicate uncertainty honestly and avoid presenting estimates as guaranteed outcomes.
What's next for HeatShield AI
The next stage is to expand HeatShield AI from a hackathon platform into a larger urban safety system.
Future improvements may include:
- Segment-level shade and heat estimation using satellite imagery.
- Real-time pedestrian heat alerts.
- City-scale heat-risk visualization.
- Integration with public-health and emergency-response systems.
- Community reporting of water points, shade structures, and cooling centers.
- Accessibility-aware route planning.
- Wearable and sensor integration.
- Historical heat-exposure tracking.
- Support for additional cities and languages.
- Validation with public-health specialists and real users.
Our long-term vision is for HeatShield AI to become a practical tool that helps individuals, cities, and organizations make safer decisions during extreme heat.
Built With
- ai
- api
- css3
- docker
- explainable
- fastapi
- geoalchemy2
- geojson
- geospatial
- html5
- leaflet.js
- learning
- machine
- openstreetmap
- overpass
- postgis
- postgresql
- pydantic
- pytest
- python
- react
- rest
- sqlalchemy
- typescript
- vite


Log in or sign up for Devpost to join the conversation.