-
-
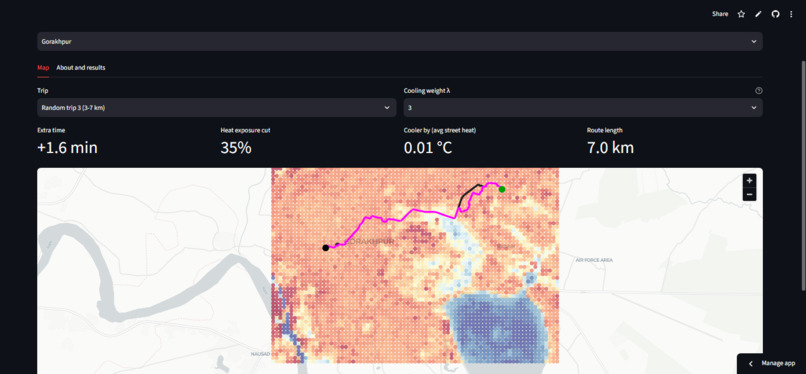
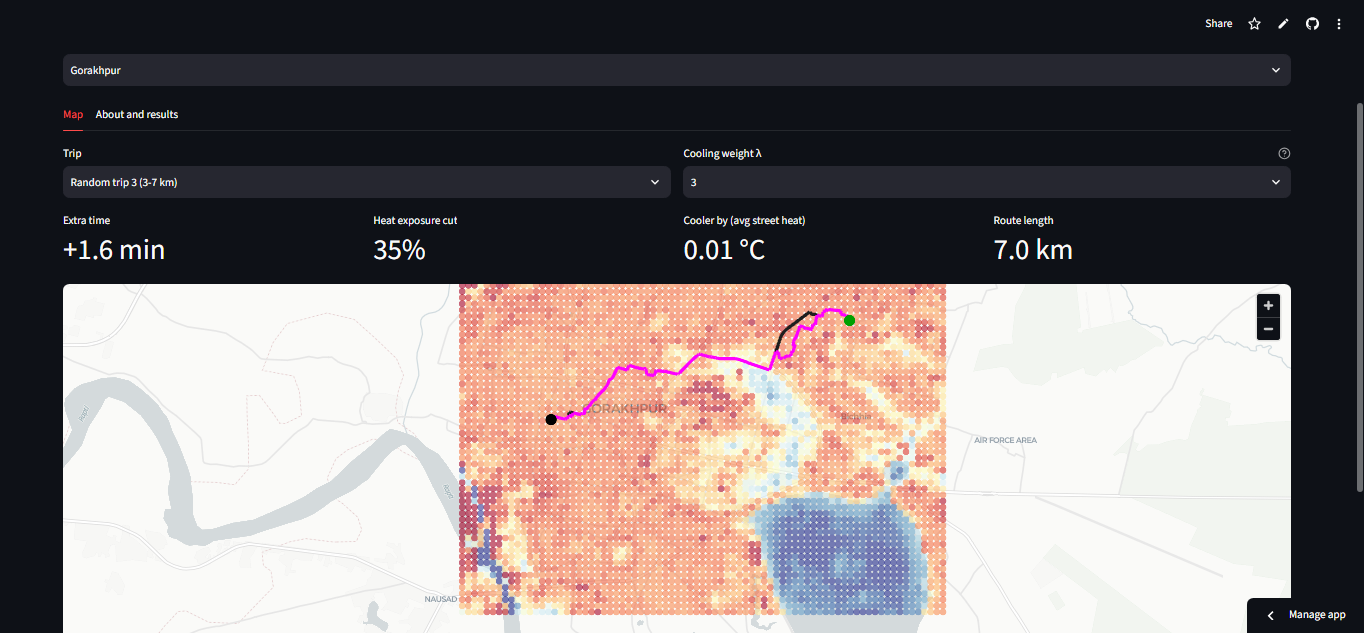
Streamlit demo
Inspiration
Heat is one of the most immediate climate impacts on city life, yet cities like Gorakhpur, Kolkata and Ahmedabad have no street-level heat data. Sensors are sparse, and raw satellite images are too coarse and cloud-limited to use directly. I wanted a heat map that works for any city with no local sensors, and that people can act on: where to meet, where to ride, where a city needs shade.
What it does
HeatPath predicts which 100 m cells of a city run hotter or cooler than the city average, using only free satellite data. It is used in two ways:
- Heat map (any city): find relatively cooler places to meet, play or wait in summer, and see where planners should add shade trees and water points.
- Cooler bike routes (Gorakhpur and Kolkata): routes that avoid the hottest streets within a 25% detour cap.
Results on cities the model never saw
- Hot and cool spots are ranked at Spearman 0.42 to 0.83 across 5 unseen cities: Bikaner 0.83, Kolkata 0.76, Gorakhpur 0.72, Raipur 0.66, Ahmedabad 0.42 to 0.46.
- Over 100 random 3 to 7 km trips per city (λ=3), the cooler route cuts heat exposure by a median 39.5% in Gorakhpur and 20.5% in Kolkata for about a minute of extra riding (+0.8 and +1.2 min median). All Gorakhpur routes stay within the detour cap.
How I built it
- Data (all free): Landsat 8/9 surface temperature, NDVI, NDBI and NDWI from Google Earth Engine, ESA WorldCover land cover (tree, built-up, water and low-vegetation cover at 100 m, plus context up to 1 km), SRTM elevation, and OpenStreetMap roads.
- Model: a LightGBM regressor trained on 9 cities (Delhi, Prayagraj, Jaipur, Lucknow, Jamshedpur, Lahore, Karachi, Dhaka, Bangkok). The target is the anomaly, a cell's temperature minus its scene's mean, which removes weather, season and time of day so one model transfers across cities. It uses 11 surface features and no weather input. A leave-one-city-out calibration factor ($K = 1.05$) keeps predictions well scaled.
- Validation: block and scene cross-validation, leave-one-city-out on the training cities, then 5 truly unseen cities scored against observed Landsat. SHAP shows the model learned physical drivers: built-up area (NDBI) pushes cells hotter, while trees and water cool them.
- Routing: each street segment gets a heat excess $s$ (predicted heat above the city median). Travel time is $t$, and route cost is
$$c = t\,(1 + \lambda s)$$
A higher $\lambda$ avoids hot streets more. Routes over a 25% detour cap fall back to the fastest route.
- App: a public Streamlit app with an interactive map (pydeck) that shows the heat layer, the fastest and cooler routes, and the metrics.
Challenges
- Early predictions were weak, and I improved them. My first model, trained on 5 cities with only local land-cover features, ranked hot and cool spots at Spearman 0.57 in Gorakhpur and 0.32 in the weakest unseen city. I added neighbourhood context features (built-up area at 300 m and 1 km, trees at 300 m, water at 500 m) and 4 more diverse cities (Lahore, Karachi, Dhaka, Bangkok), taking the training set to 9. On the same unseen cities, Gorakhpur rose to 0.72, Kolkata to 0.76, and the weakest city to 0.42 to 0.46.
- Weather swamps surface effects. SHAP shows sun elevation dominates absolute temperature. Predicting the within-scene anomaly separated surface effects from weather and made cross-city transfer possible.
- Clouds and gaps. I masked cloud, shadow and saturated pixels, kept only clear scenes and averaged up to 3 per city.
- Honest evaluation. I tested only on cities excluded from training and found accuracy varies by city (Ahmedabad is the weakest, Bikaner is strongest).
- Shipping it. Packaging heat grids and scored road graphs so the public app runs without Earth Engine or live OpenStreetMap calls.
What I learned
Weather sets how hot a day is, but surfaces decide which places are hotter within it, and that spatial pattern transfers across cities. Free, global data is enough to map heat where nothing was mapped before.
Impact and what's next
Residents and students can choose cooler places and routes, and planners get street-by-street hot spots to target shade and water points. Landsat and WorldCover cover the whole planet at no cost, so a new city is just a bounding box. Next: validate against ground sensors, add afternoon and evening passes (MODIS ~1:30 PM, ECOSTRESS for diurnal snapshots), add more cities, add feels-like using weather, add short-term forecasts, and plug the heat layer into transit, cycling and delivery apps.
Limits
- The map shows the persistent mid-morning pattern (Landsat overpass), not a forecast or feels-like temperature.
- It ranks places relative to the city average, so differences are a few °C. Read it as relatively cooler or hotter.
- Route exposure is scored on the model's own predicted heat, so the cuts are partly circular. The air-temperature gap between routes is small (median 0.21 °C Kolkata, 0.07 °C Gorakhpur); the gain is in exposure to the hottest streets.
- Tested on 5 unseen South Asian cities; other climates are untested.
Built With
- esa-worldcover
- google-earth-engine
- kaggle
- landsat
- lightgbm
- matplotlib
- networkx
- numpy
- openstreetmap
- osmnx
- pandas
- pyarrow
- pydeck
- python
- scikit-learn
- scipy
- shap
- shapely
- srtm
- streamlit

Log in or sign up for Devpost to join the conversation.