-
-
-
-
-
-
-
Feature
-
Main selling point
-
-
-
-
Web UI
-
-
-
-
Inspiration
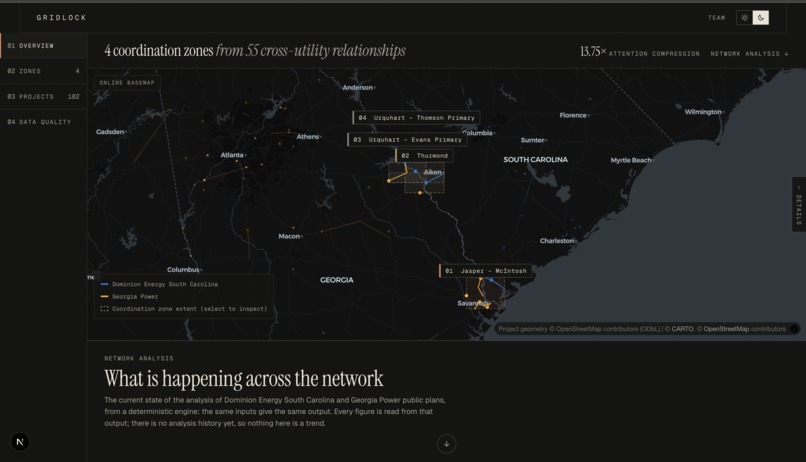
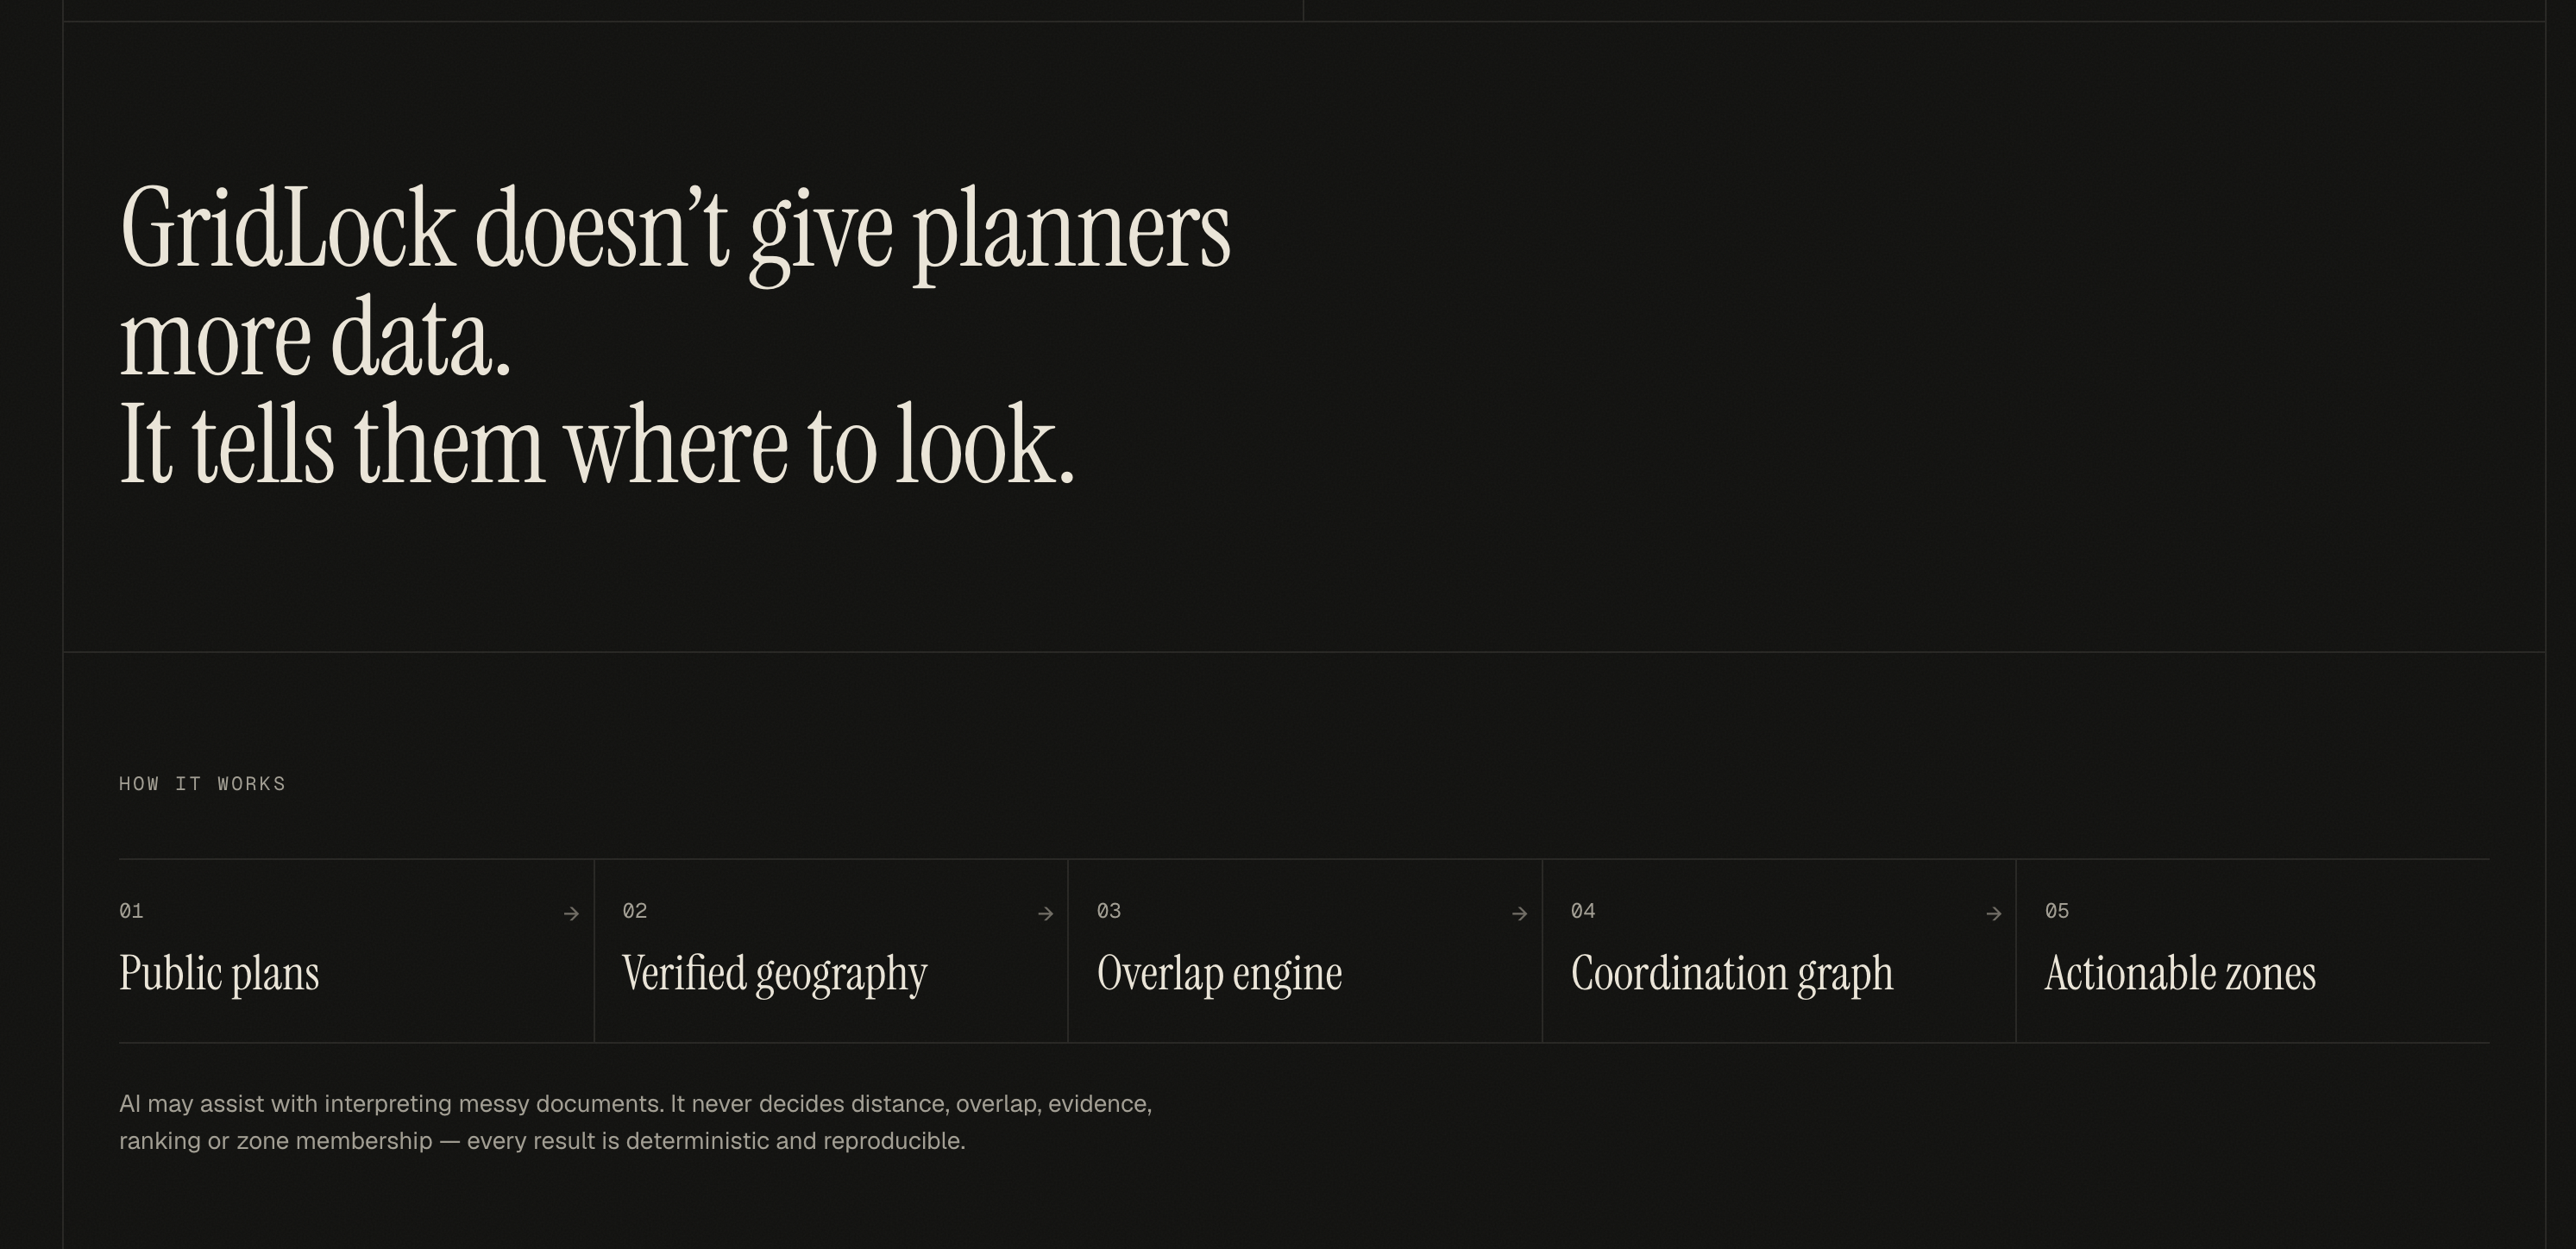
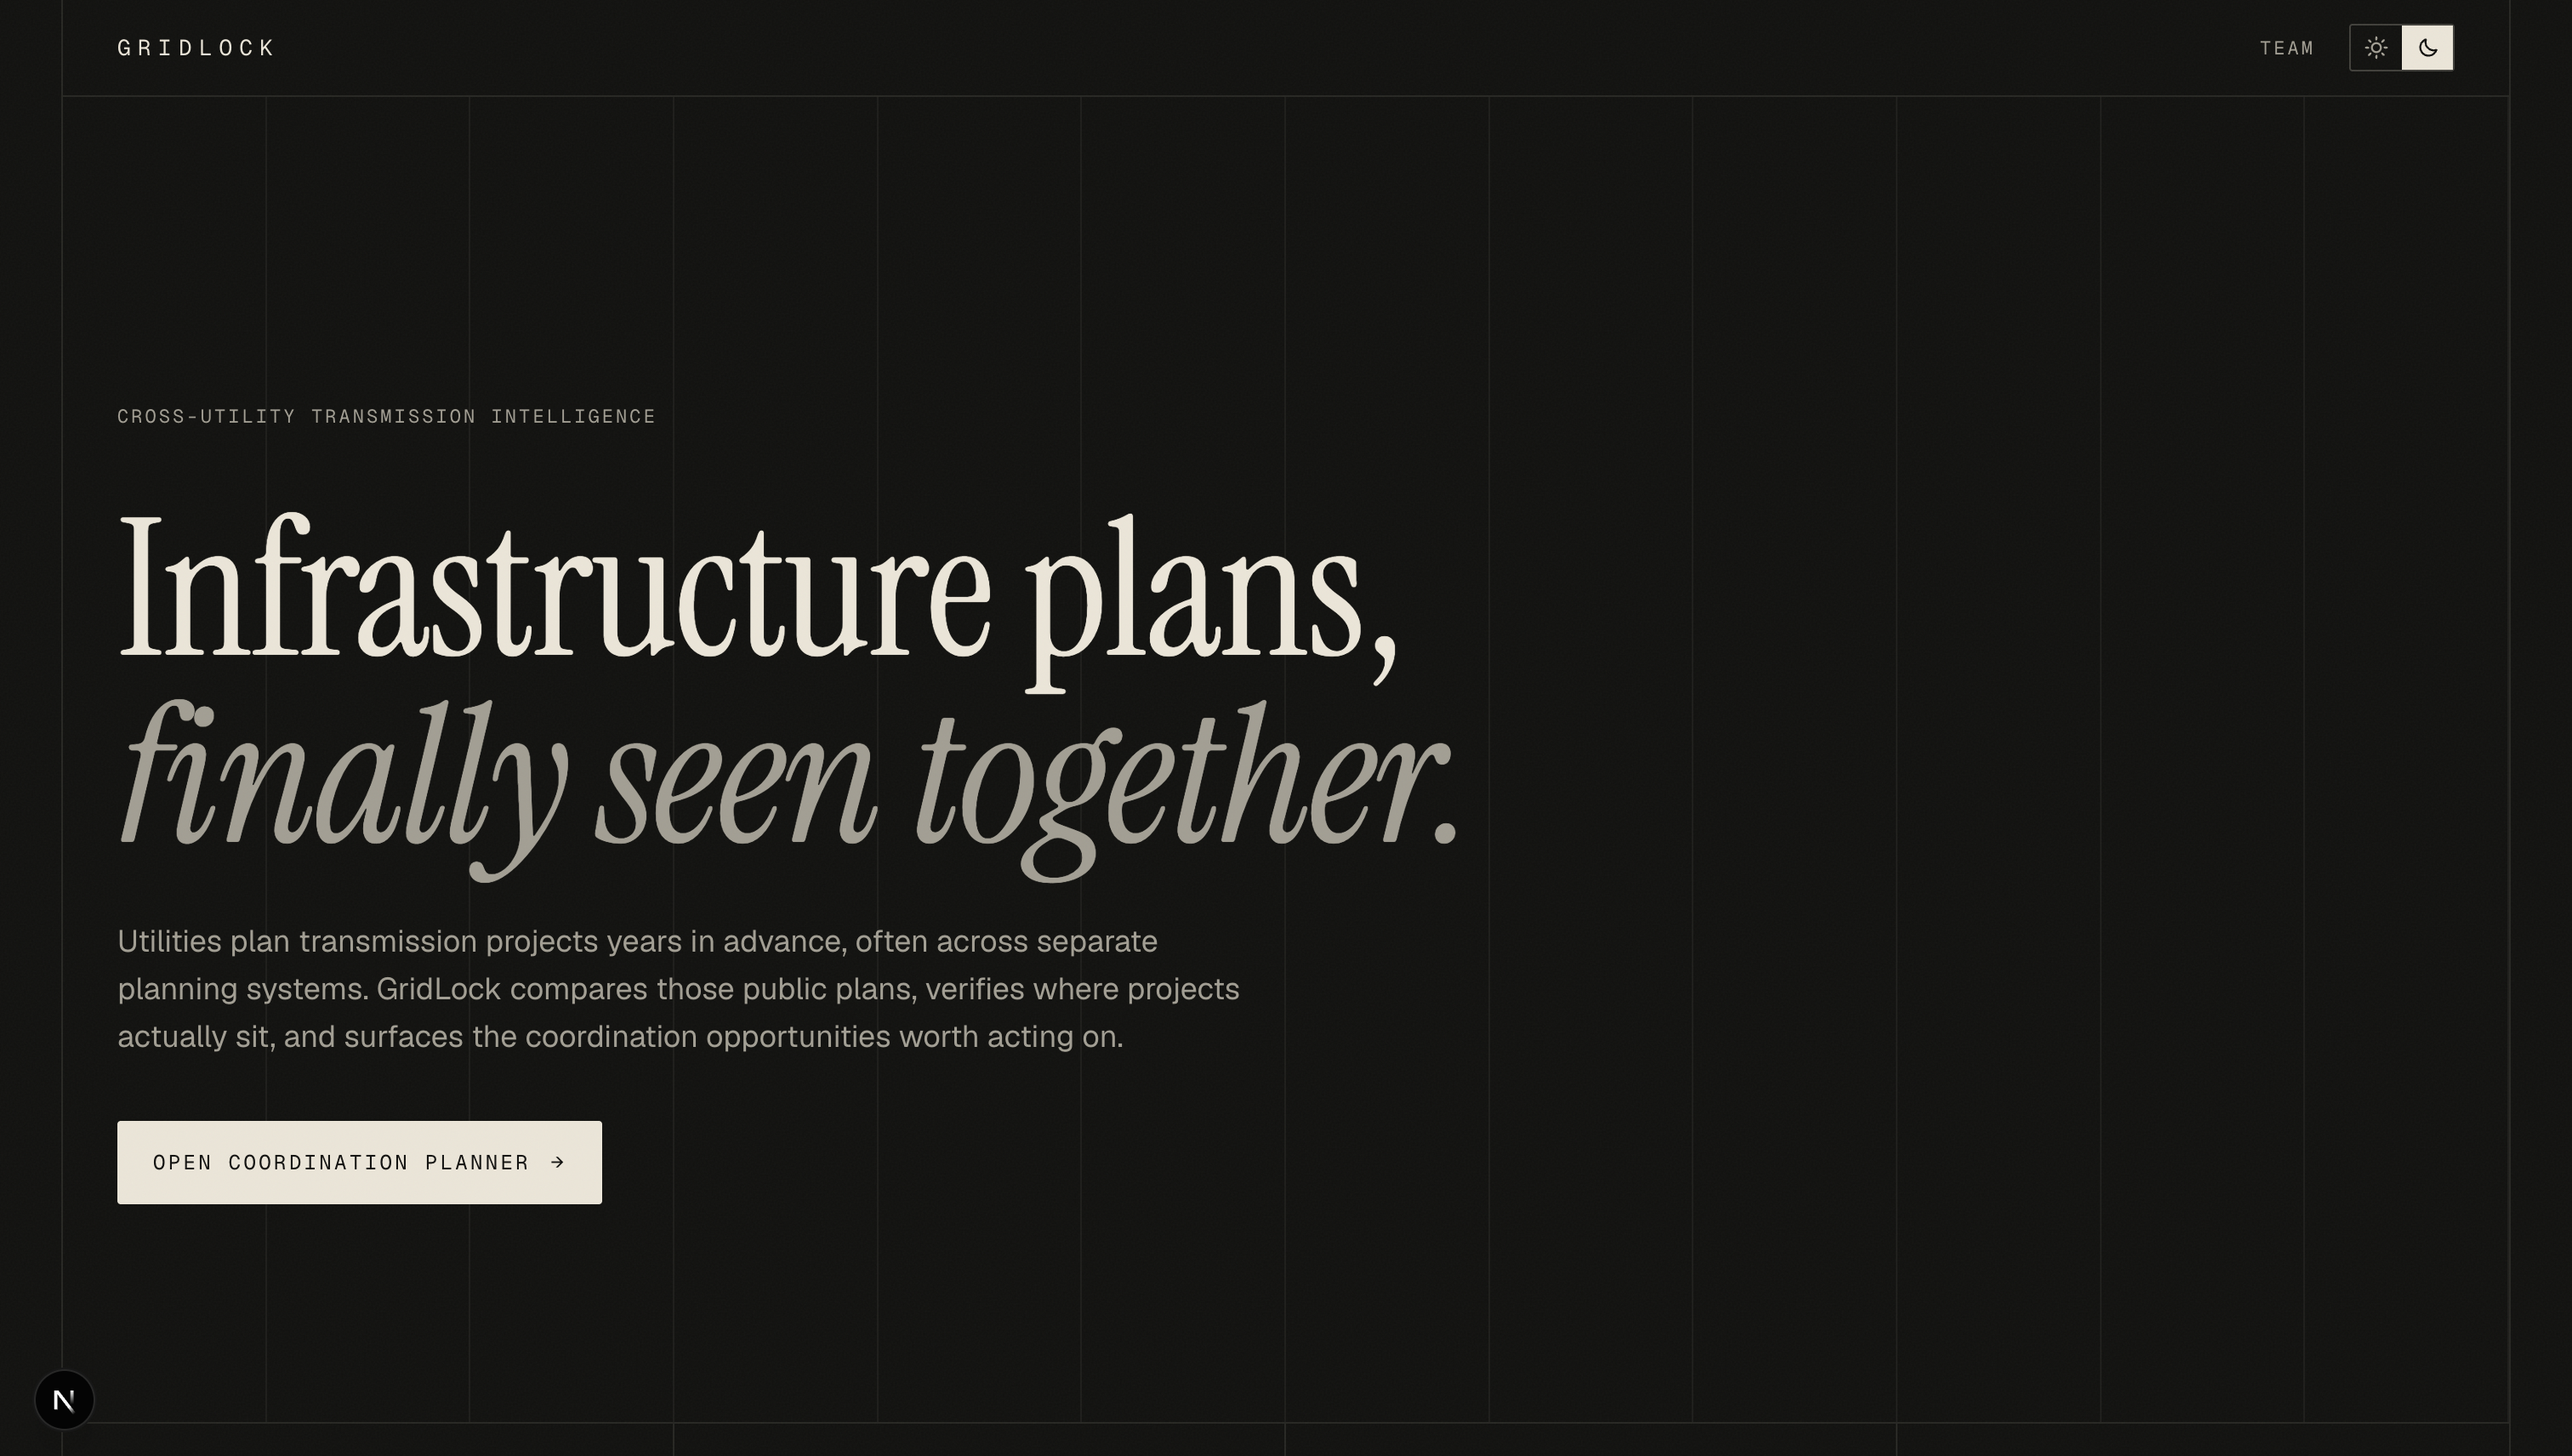
Dominion Energy South Carolina and Georgia Power sit on opposite banks of the Savannah River. Both publish their future construction plans, but in different formats and in different places, and nobody puts them side by side. FERC Order No. 1920 (2024) exists because utilities have planned alone for too long.
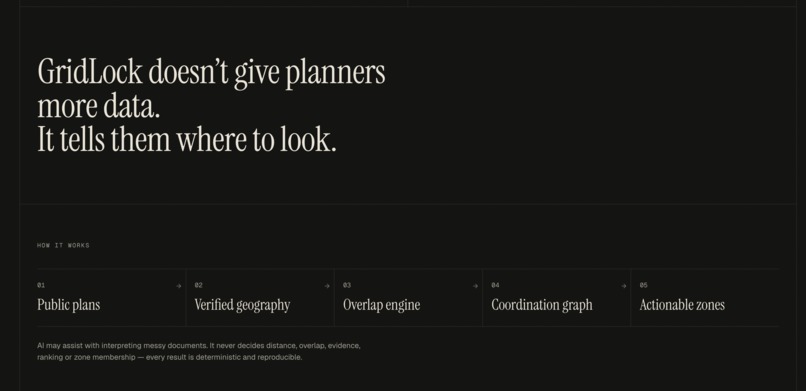
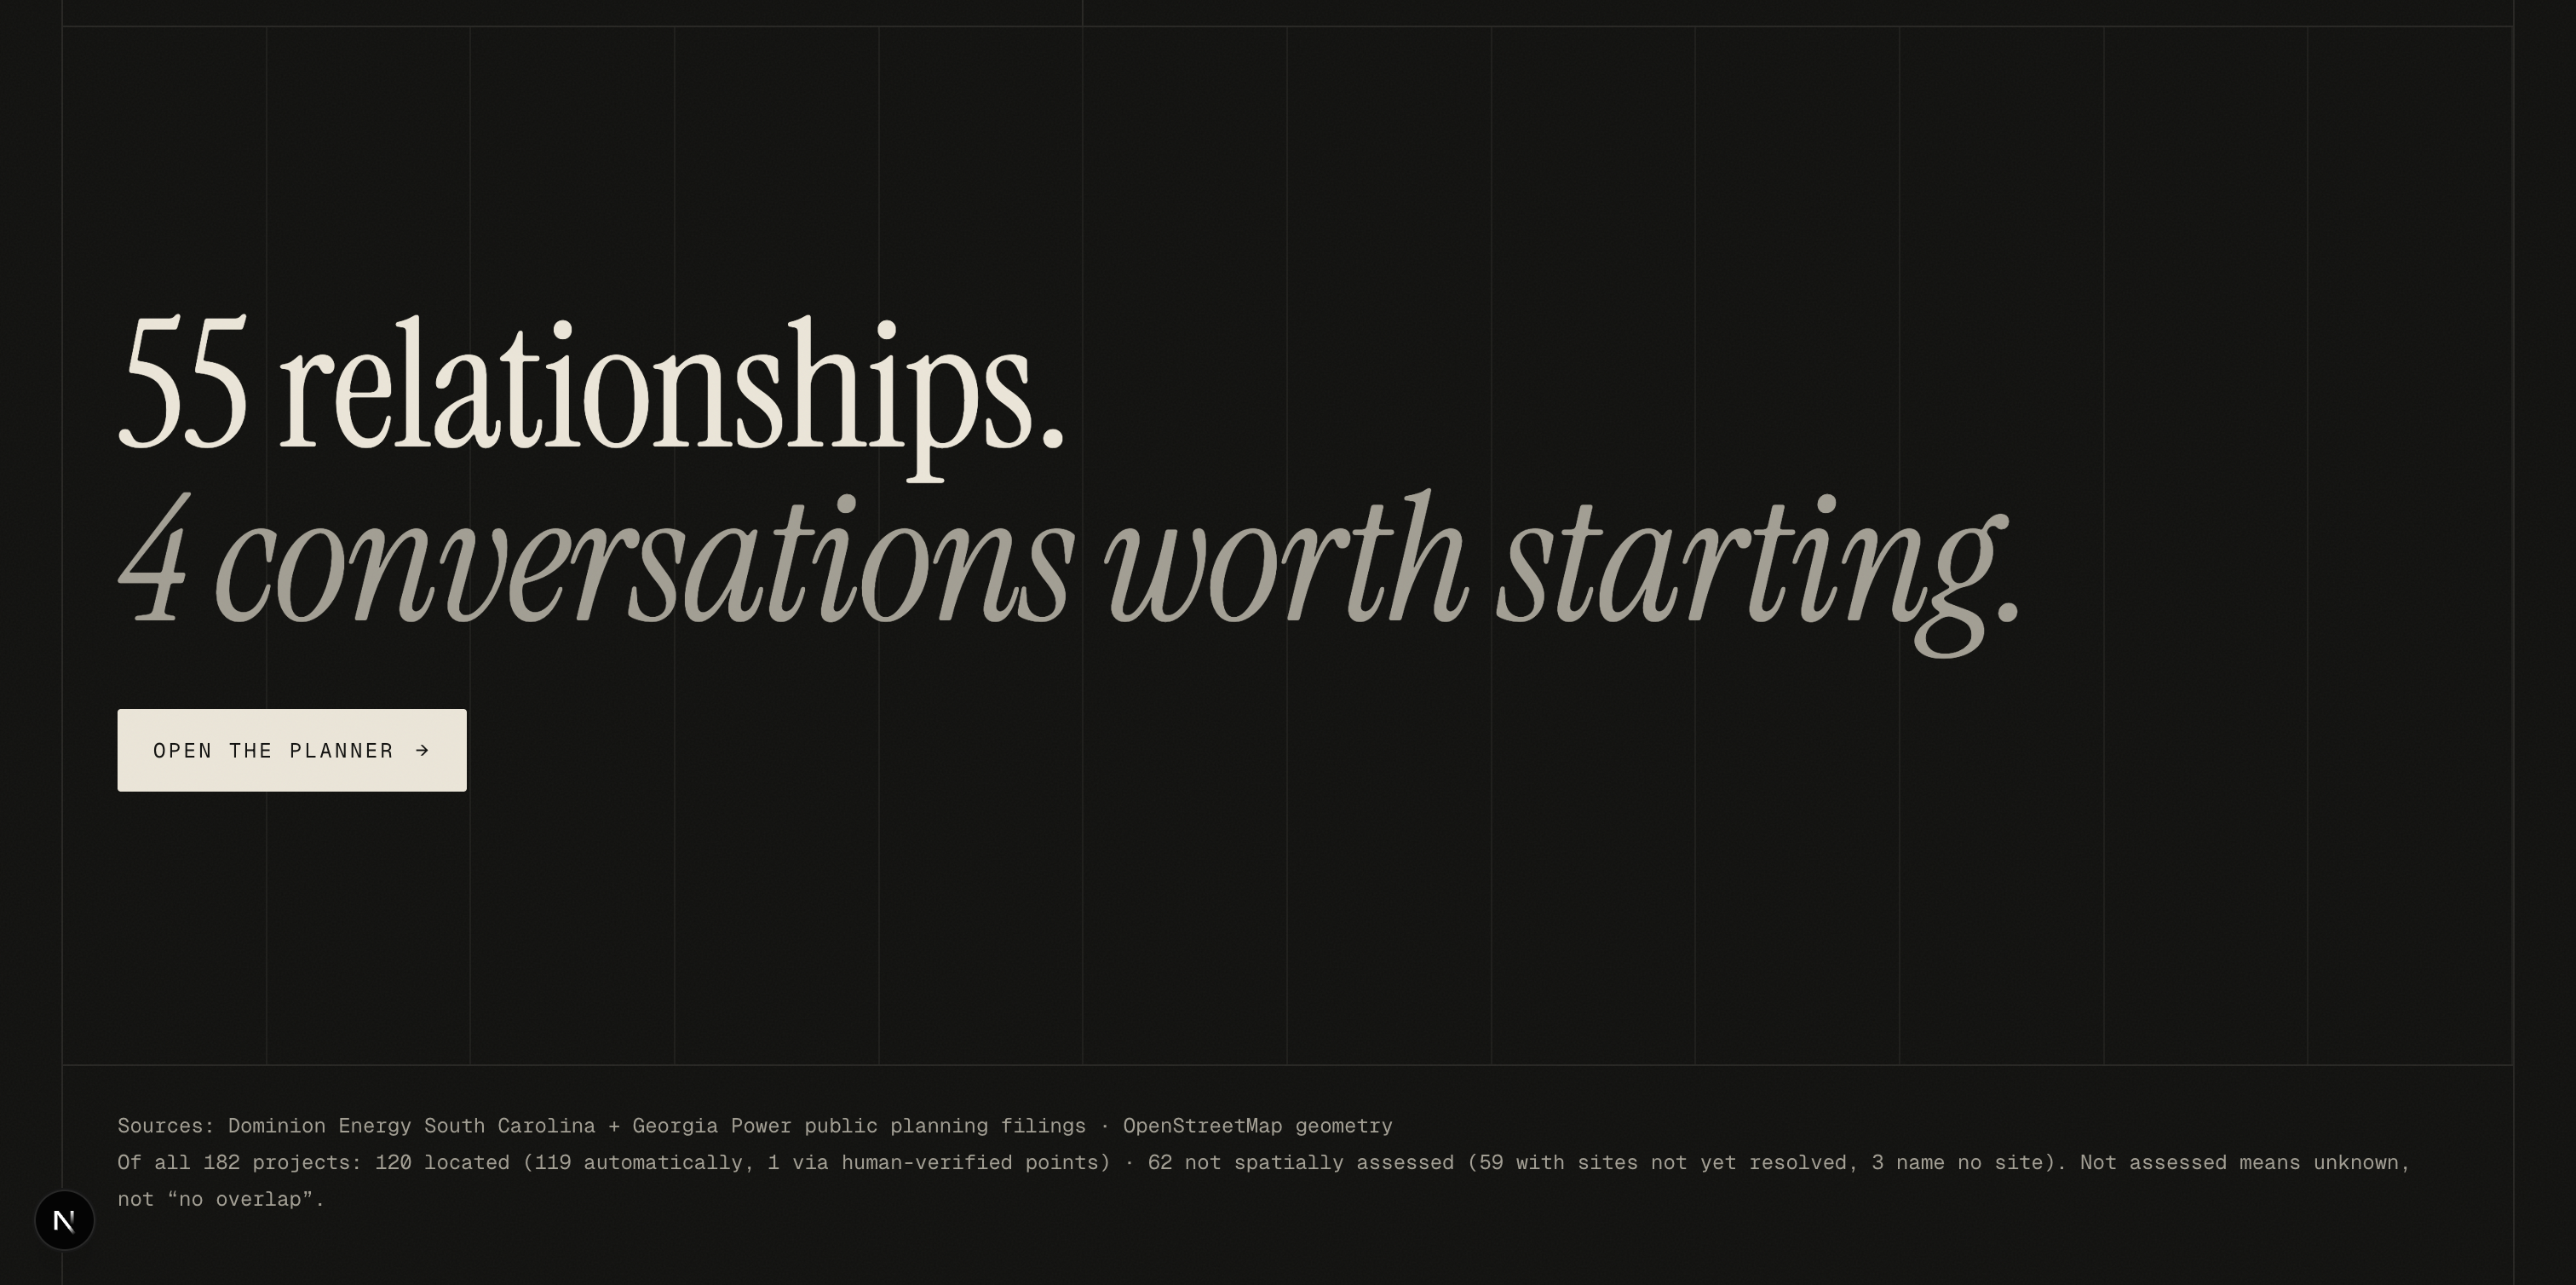
When we started, we realised the hard part isn't finding overlaps; it's finding too many. Any map will show you dots near other dots. A planner needs to know which few are worth a phone call. So we built GridLock around one idea: tell people where to look, and prove why.
What it does
GridLock reads both utilities' public filings, puts each project on a real map, and checks every Dominion project against every Georgia Power project.
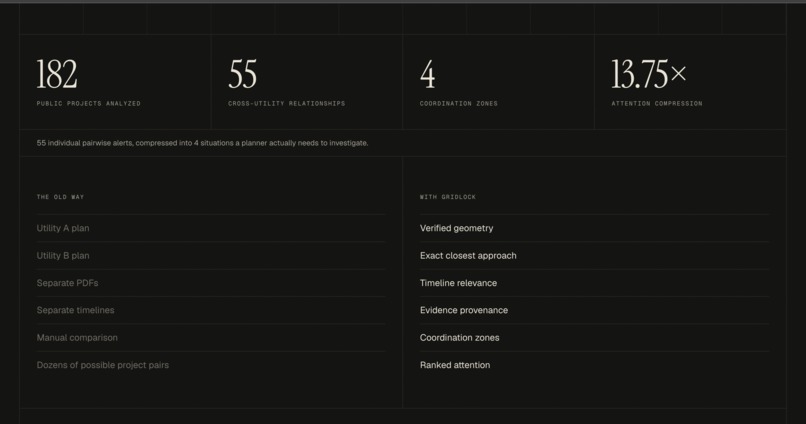
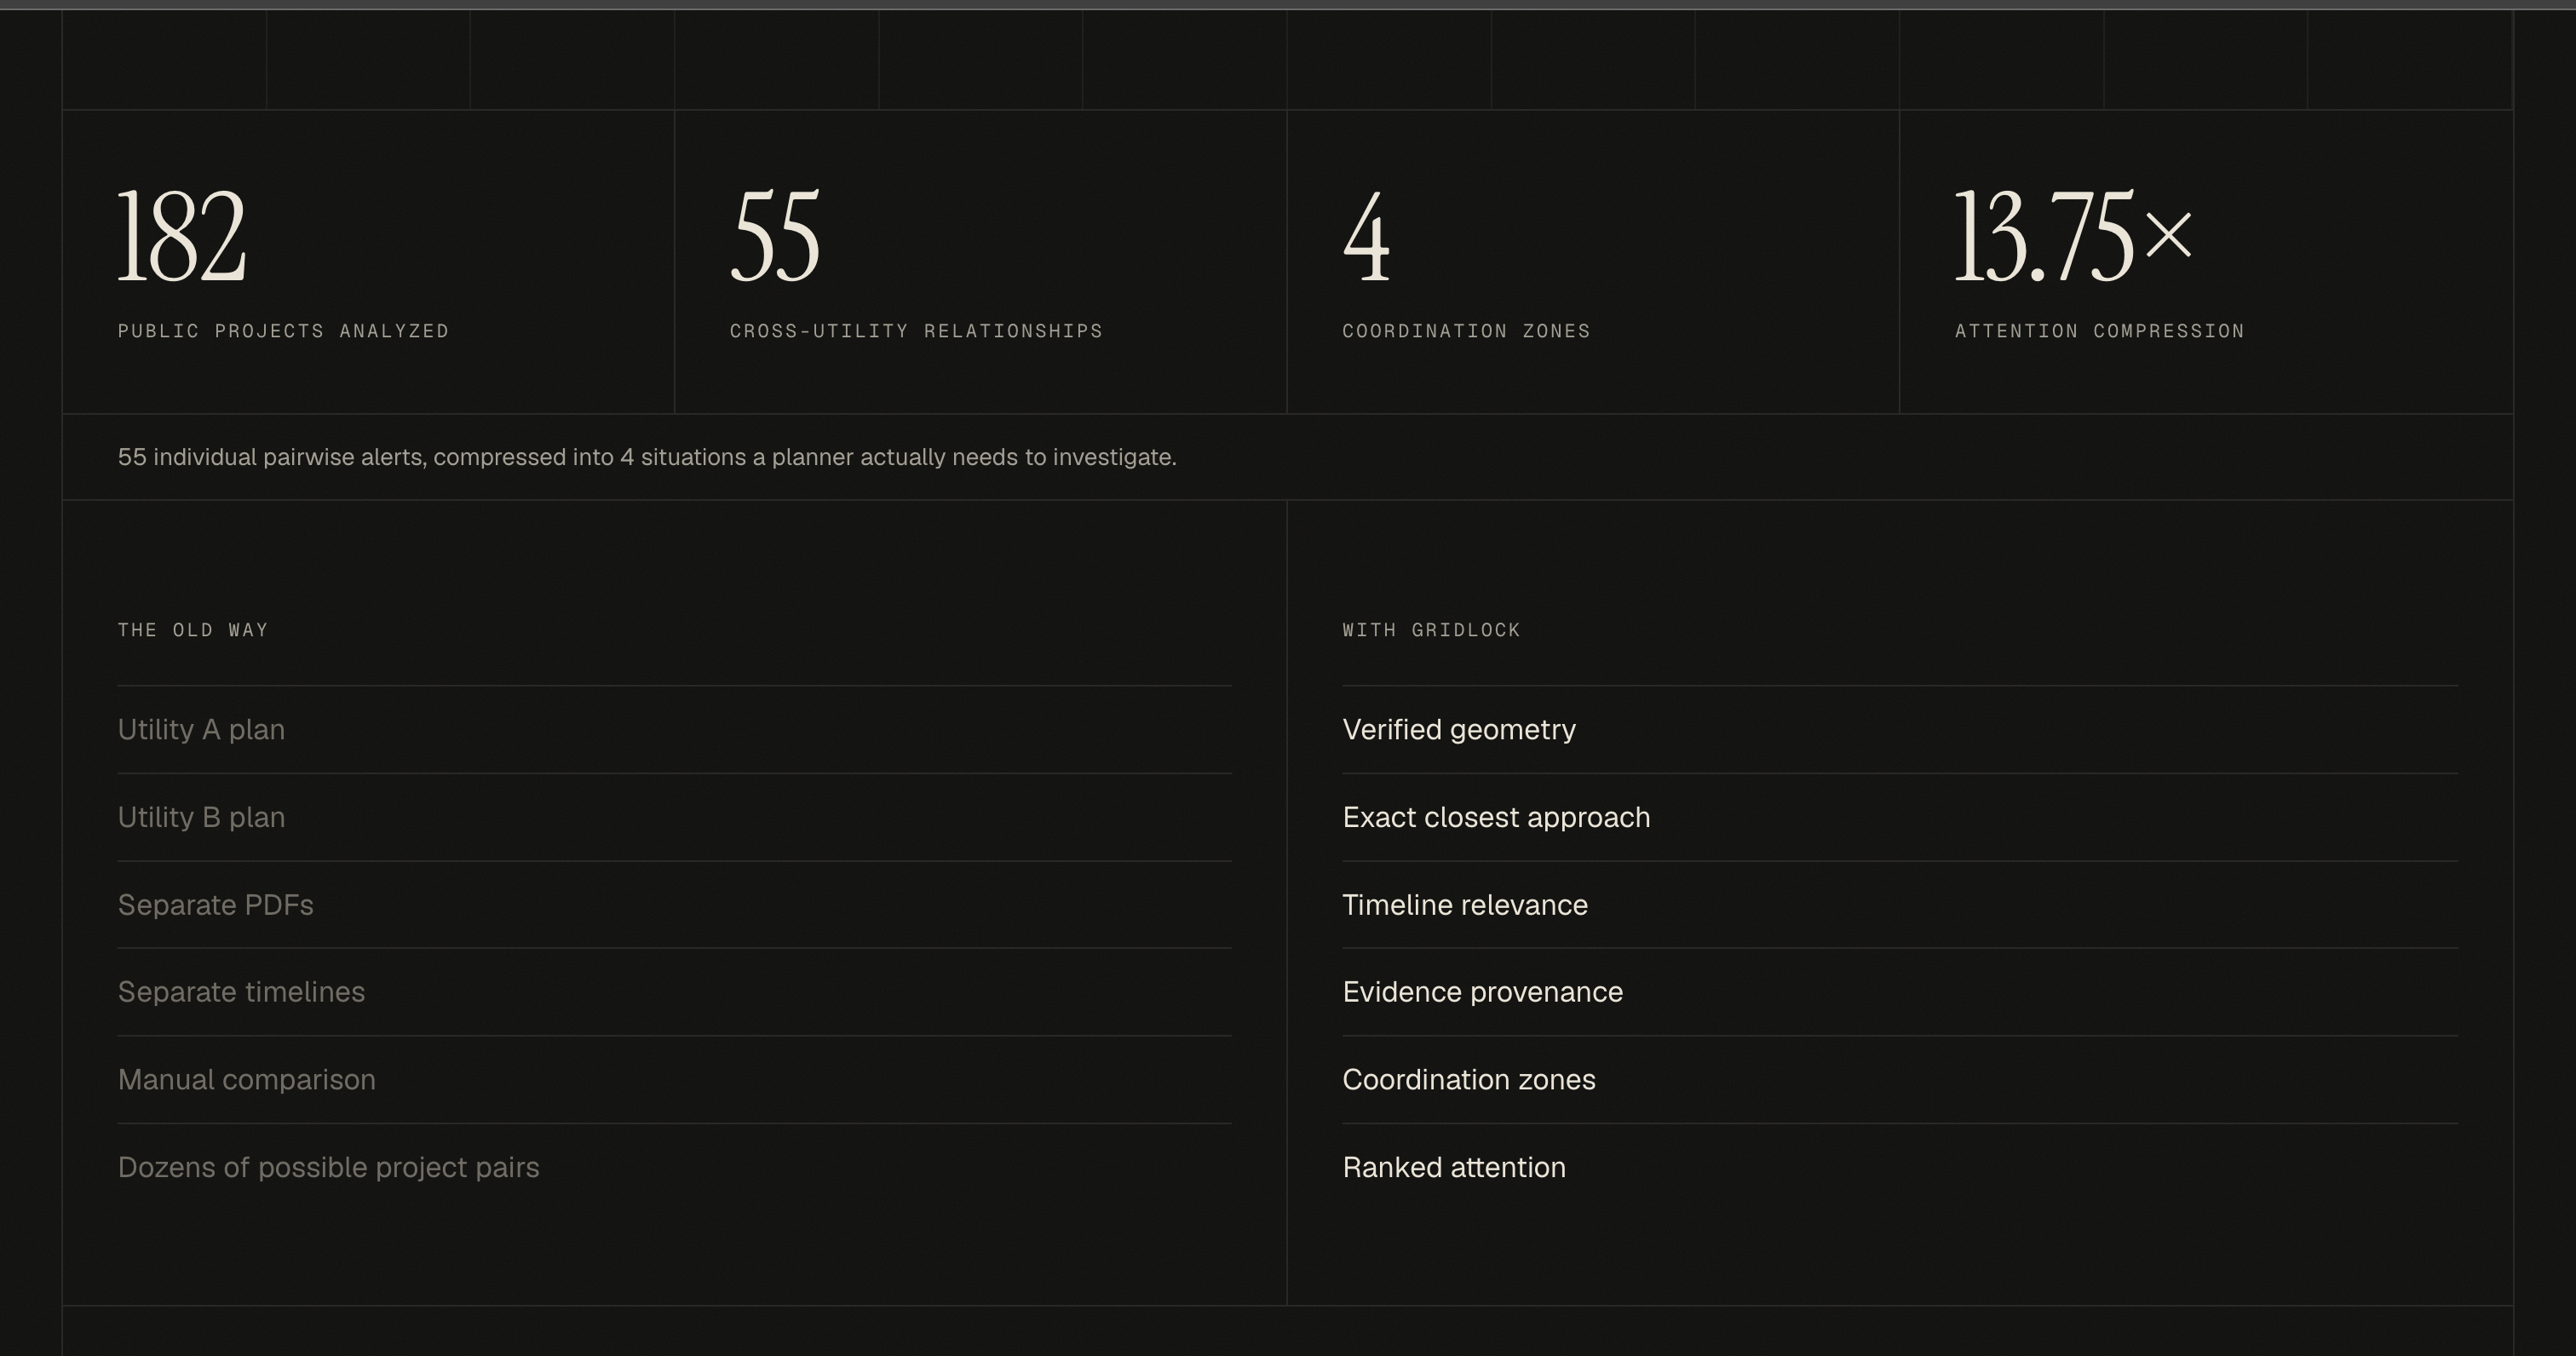
| Step | Count |
|---|---|
| Public projects read from two filings | 182 (44 Dominion, 138 Georgia Power) |
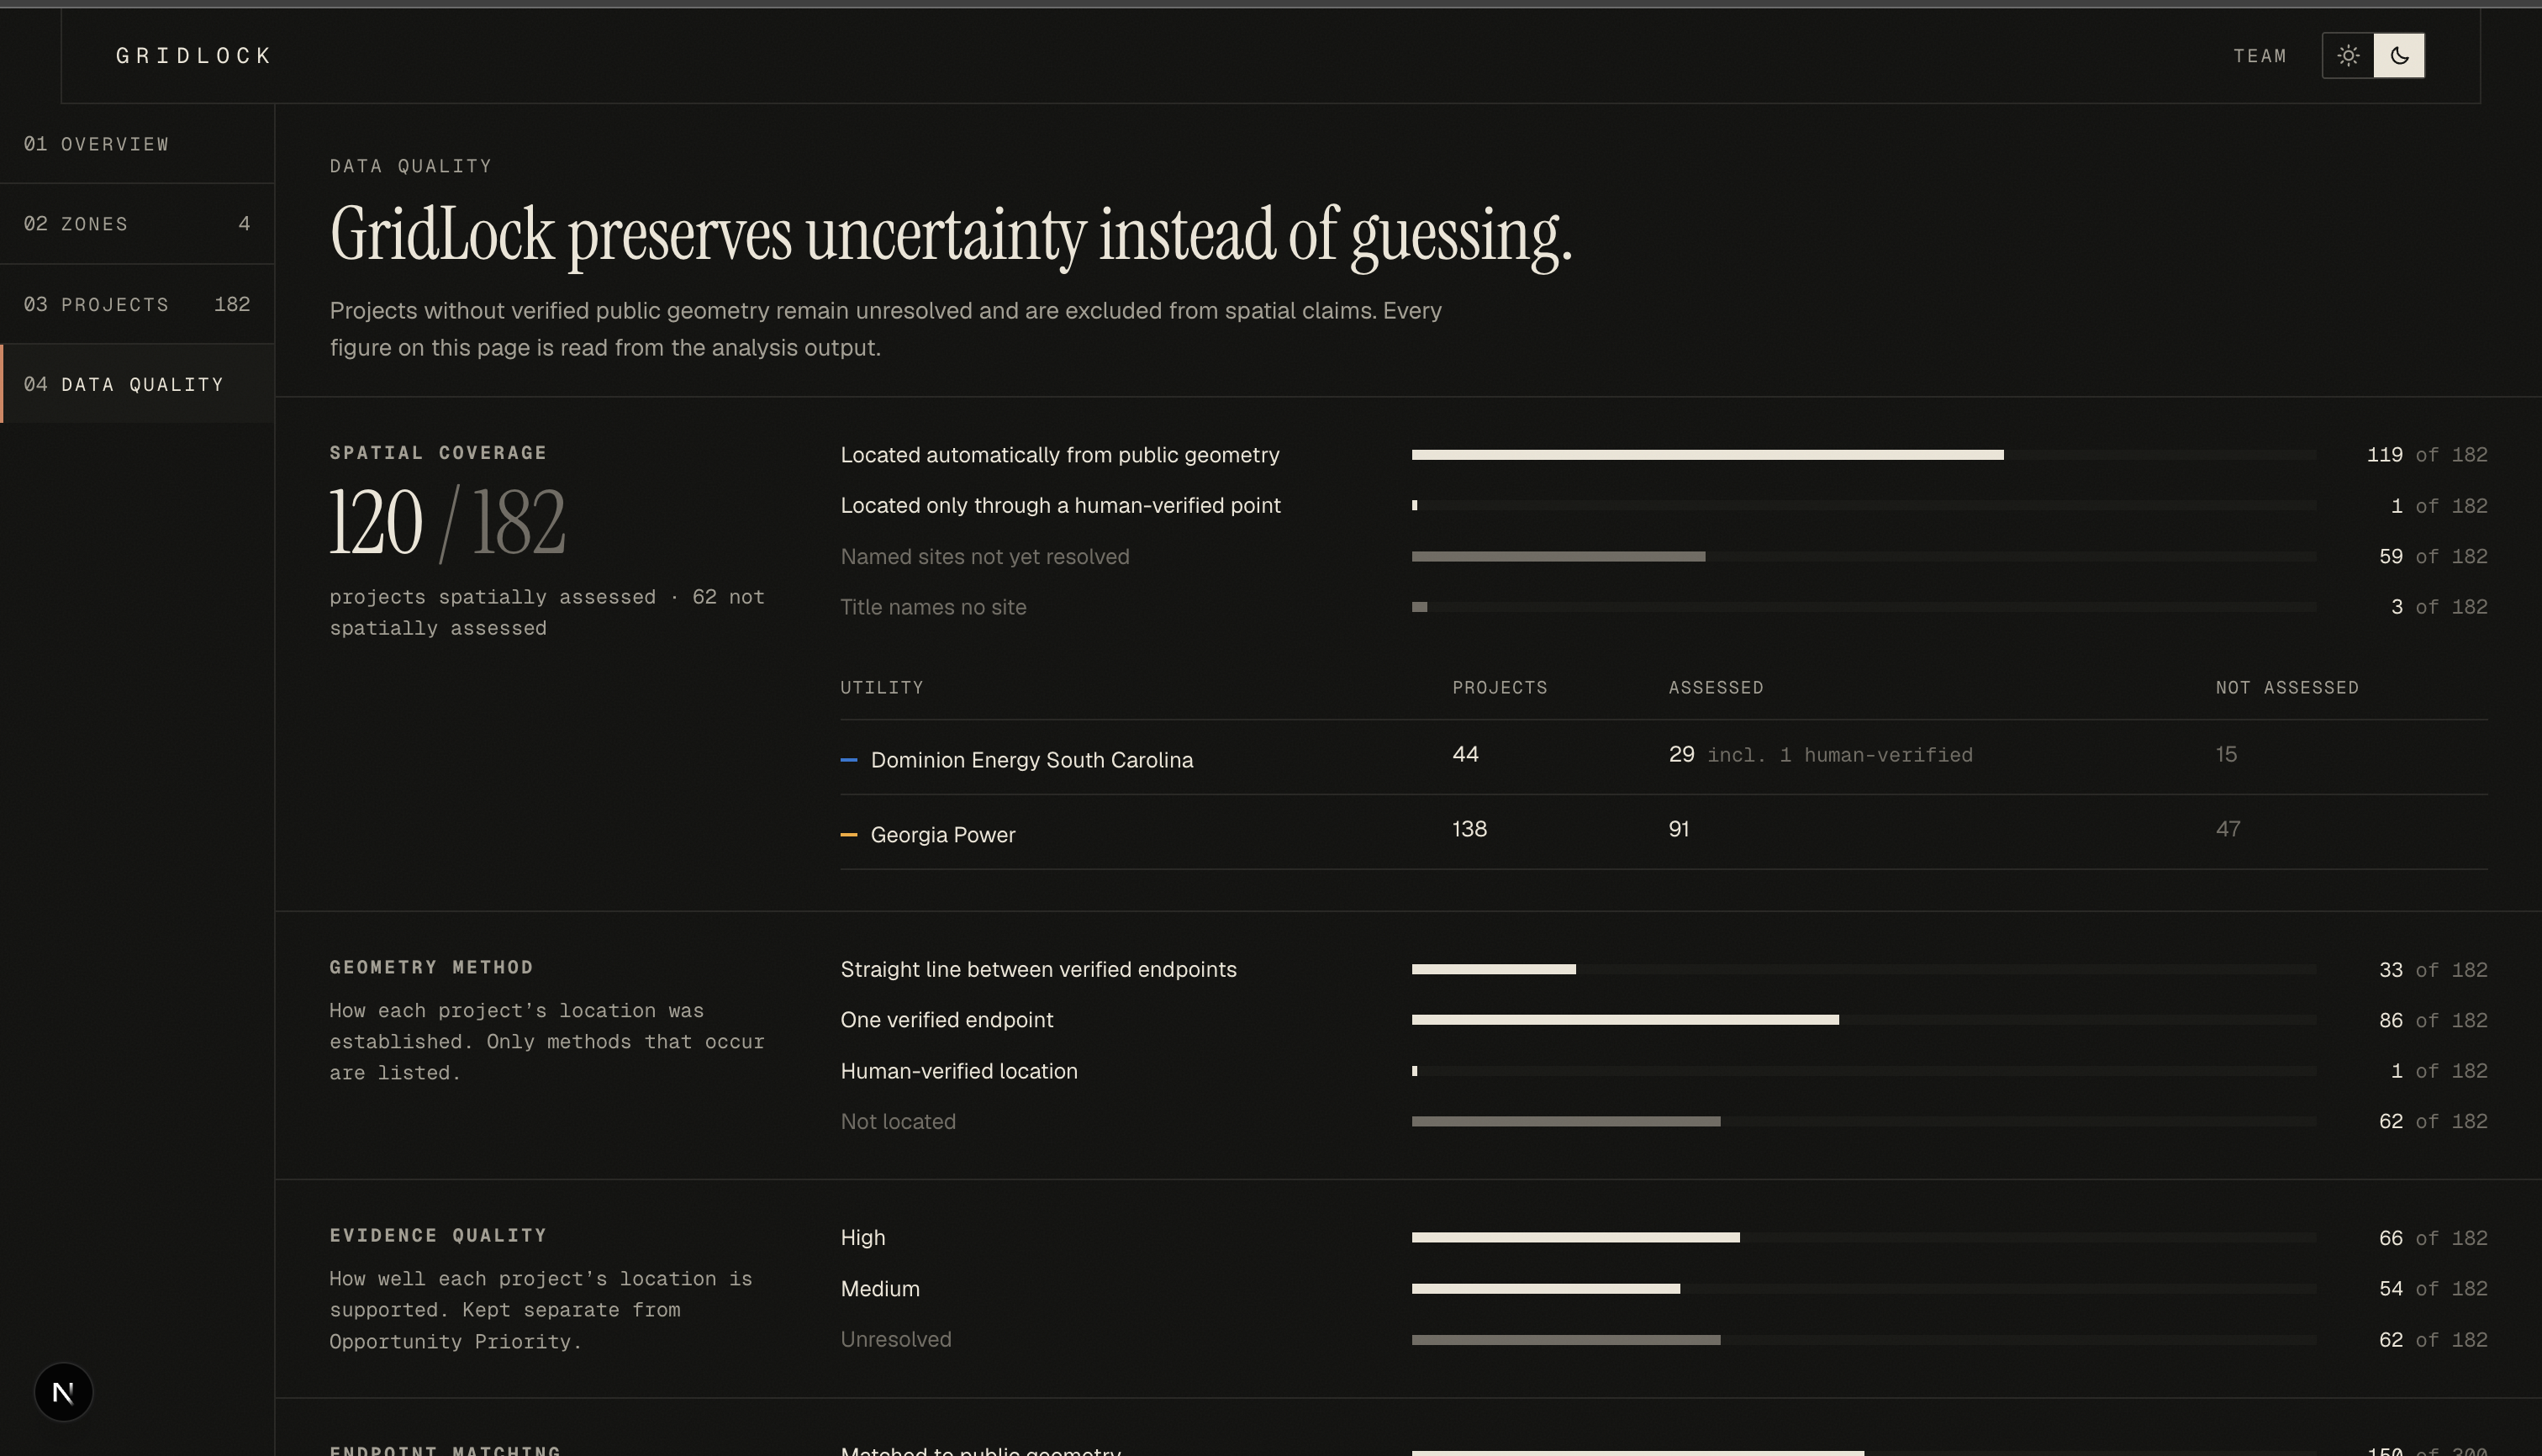
| Placed on the map using public infrastructure data | 120 of 182 |
| Cross-utility pairs checked | 2,639 |
| Pairs within the 40 km limit | 55 |
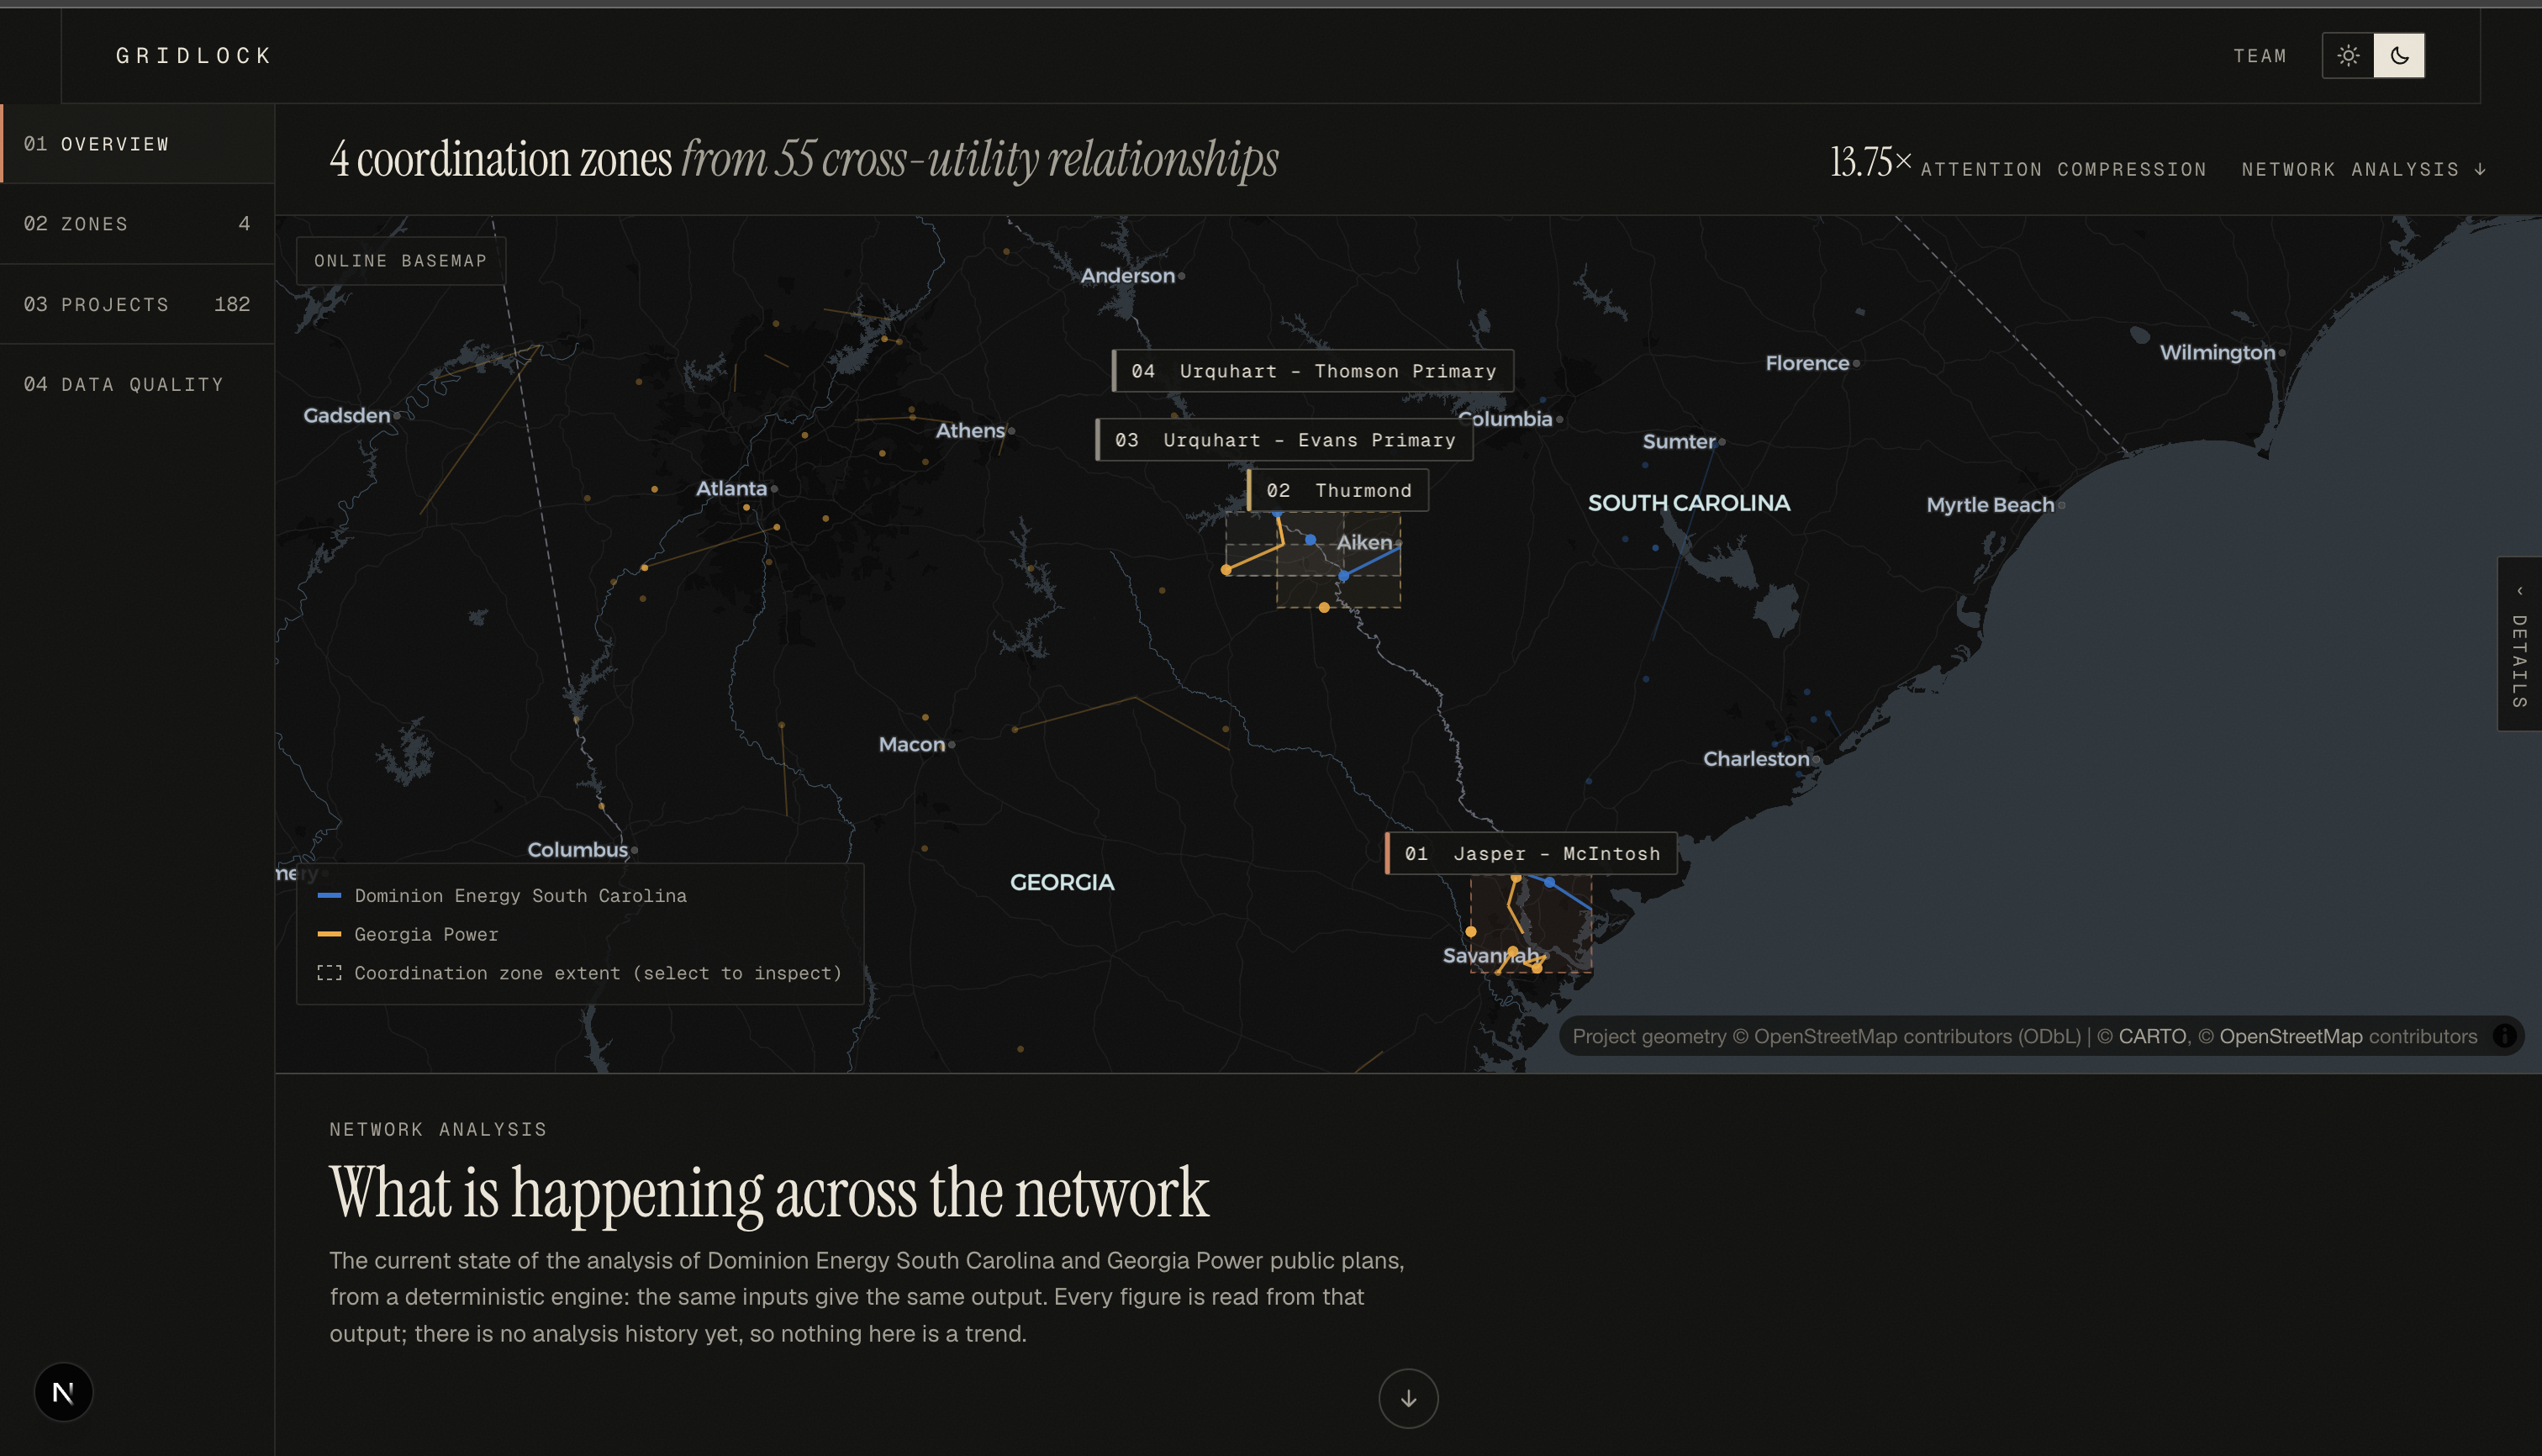
| Coordination zones to act on | 4 |
$$\frac{55 \text{ overlaps}}{4 \text{ zones}} = 13.75\times \text{ less for a planner to review}$$
Every zone comes with:
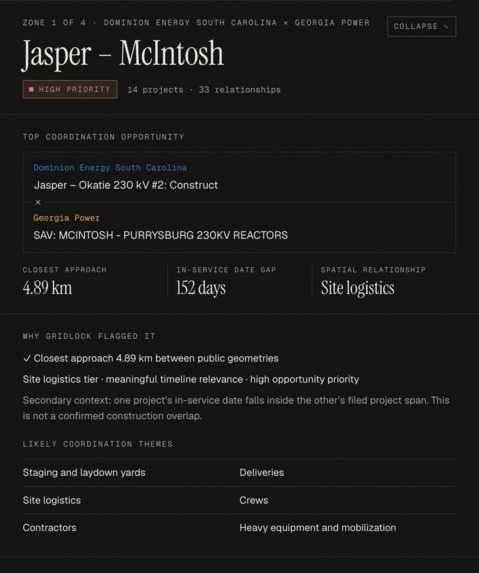
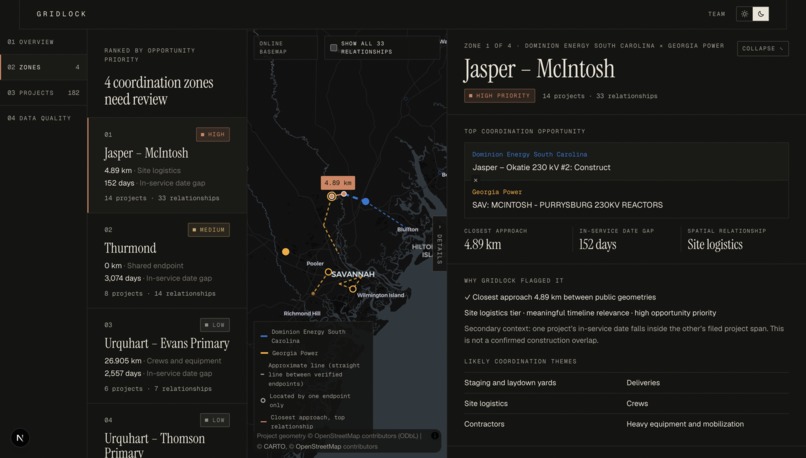
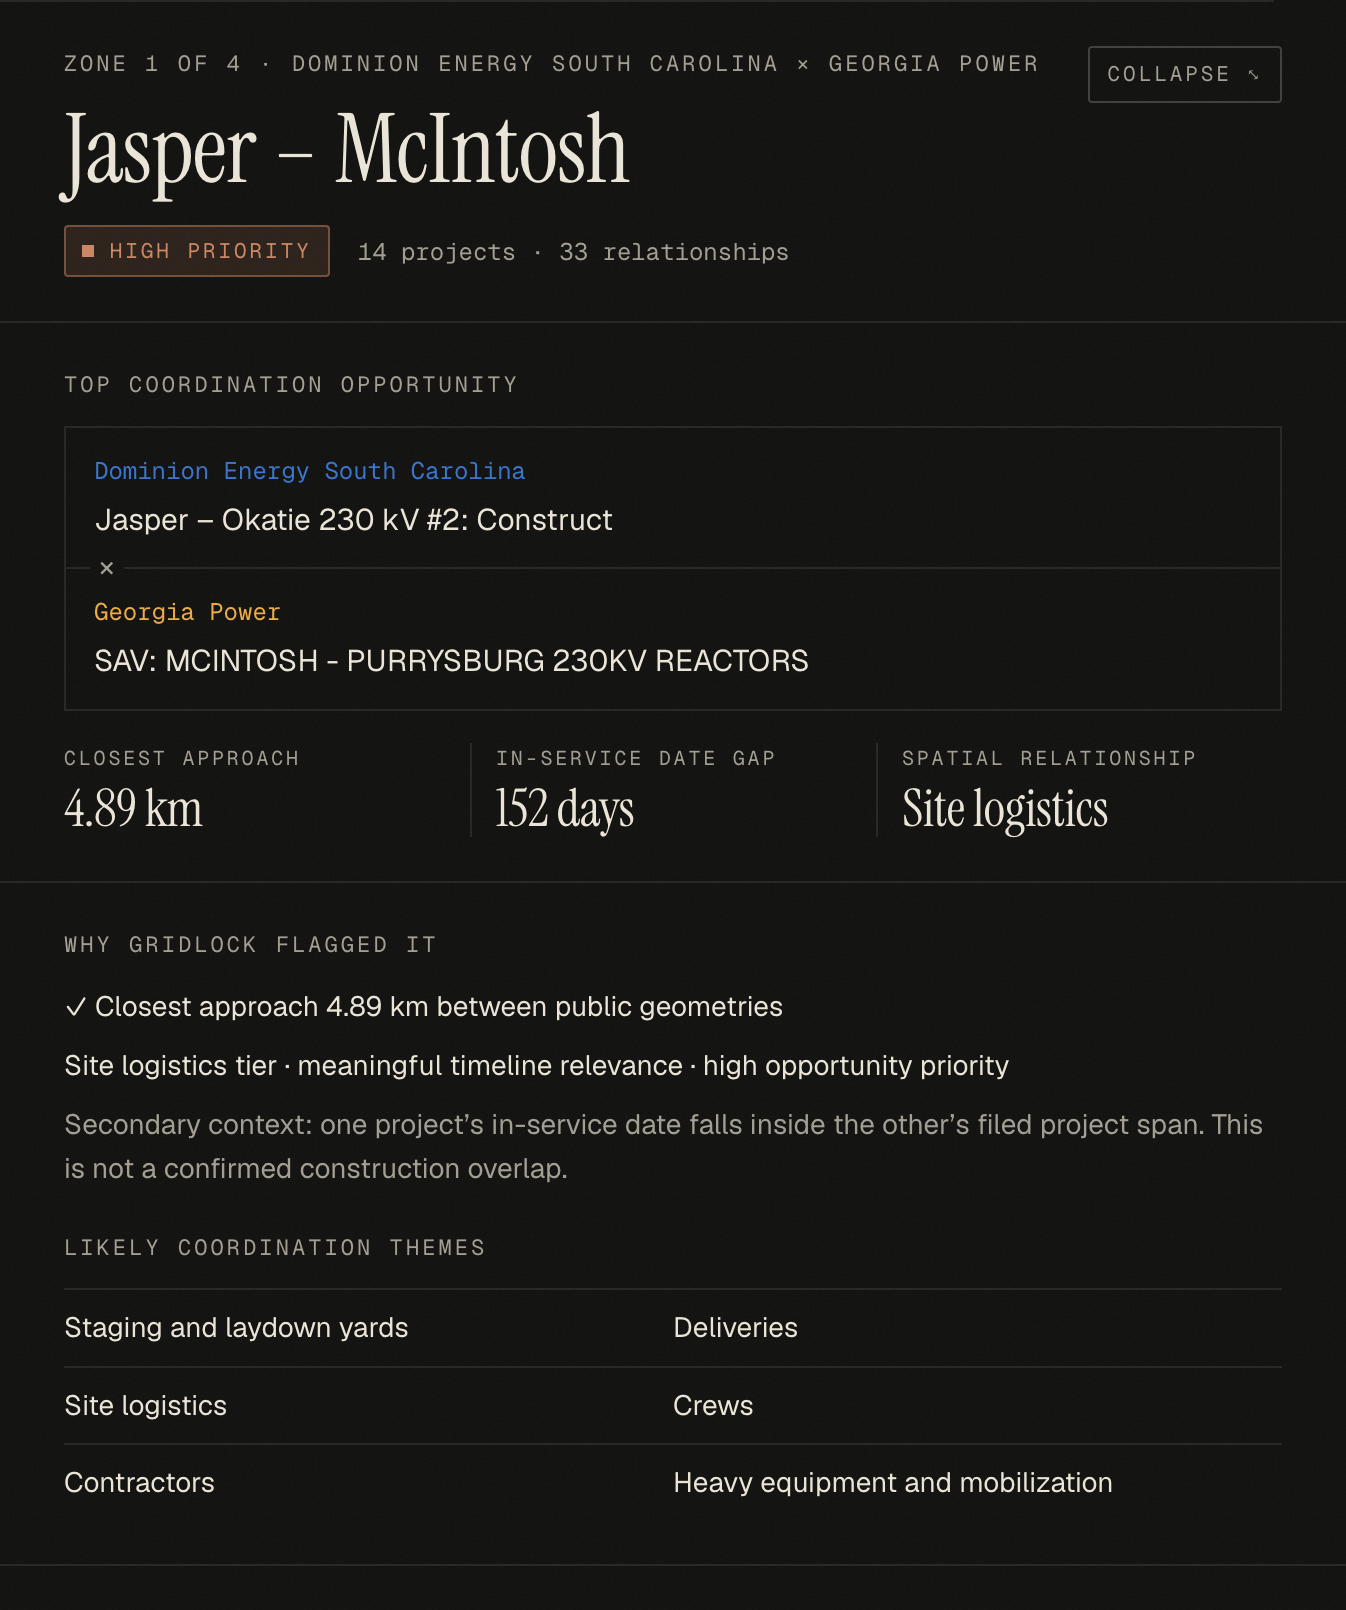
- Its closest pair and how far apart their dates are.
- A talking-point list for its distance tier. For example, crossing → outage timing and crossing structures; under 8 km → shared staging yards and deliveries.
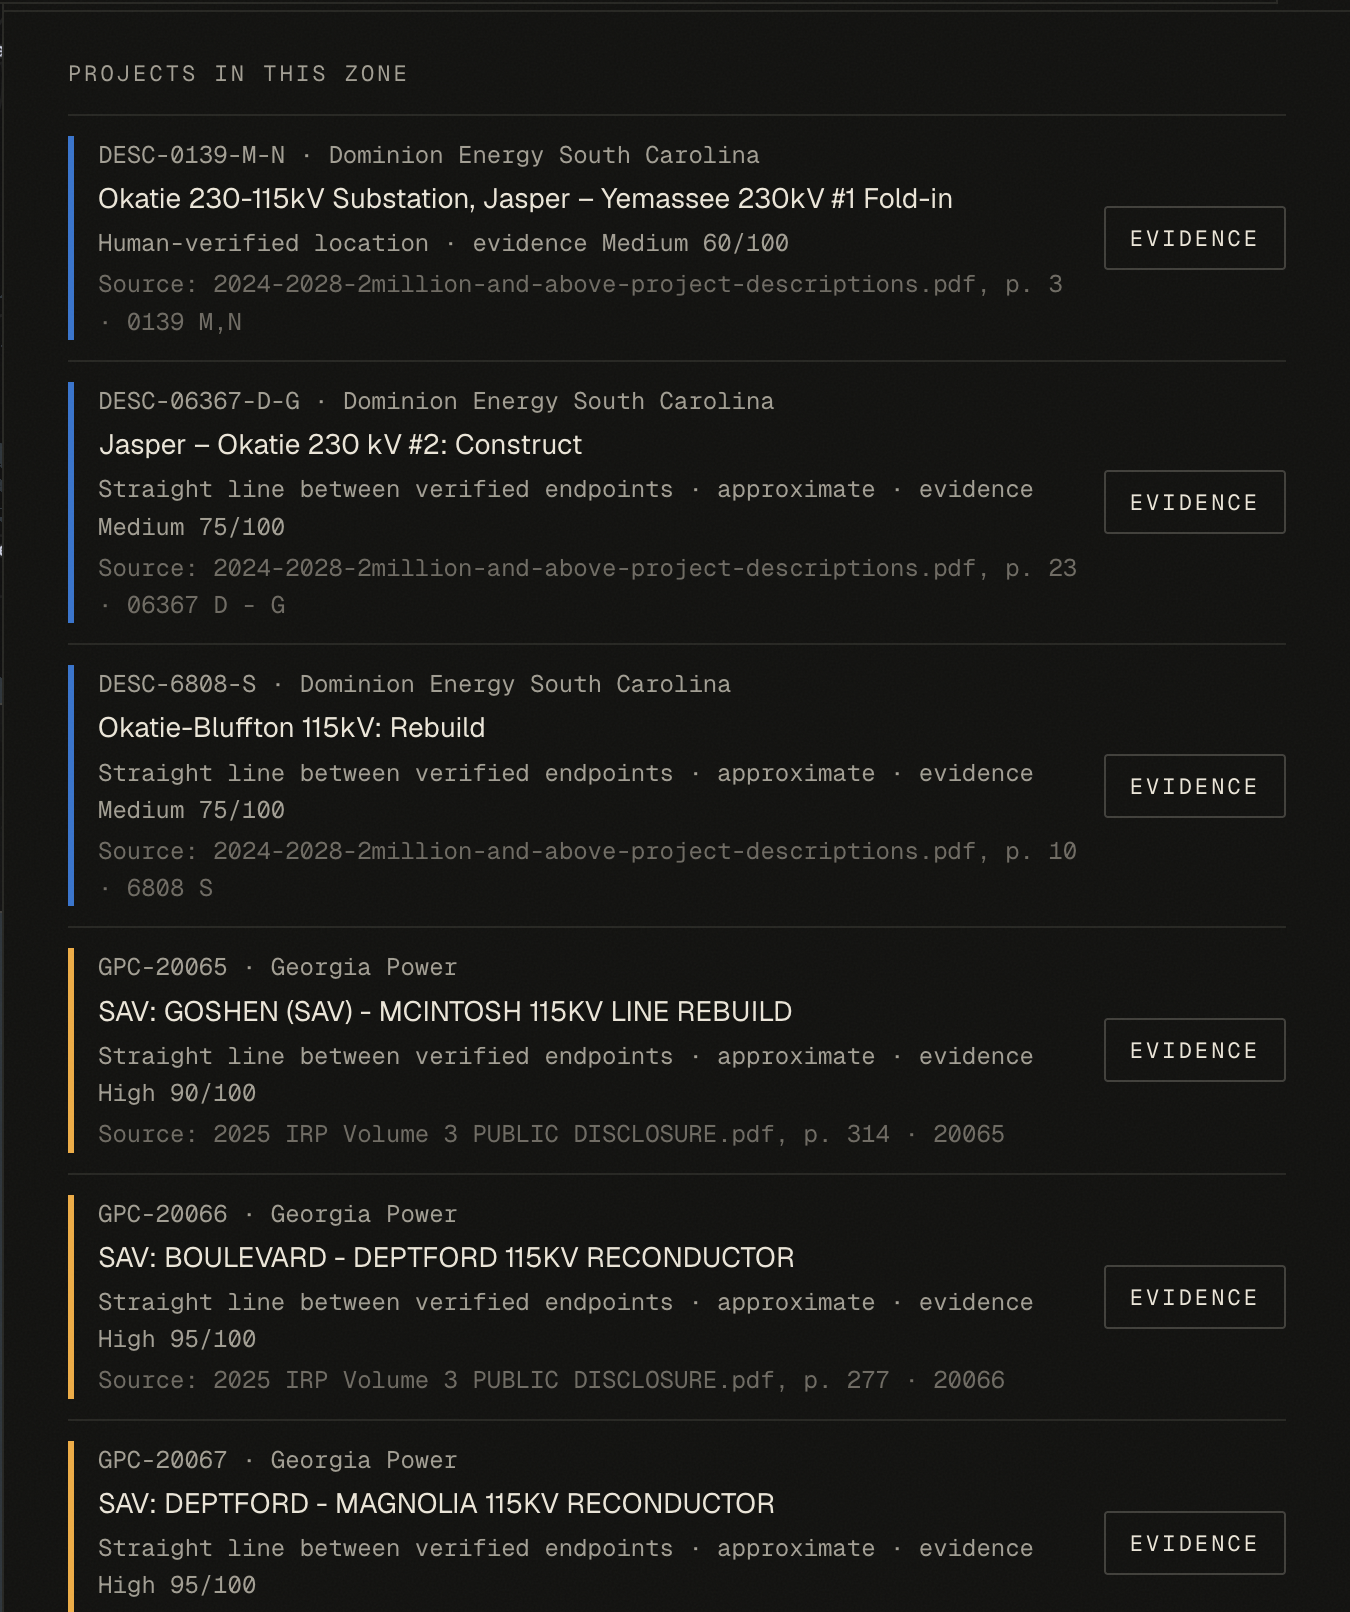
- The source for every project: filing, page number, project ID and the matched map feature.
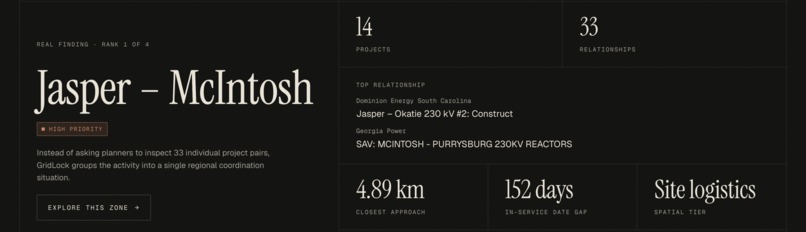
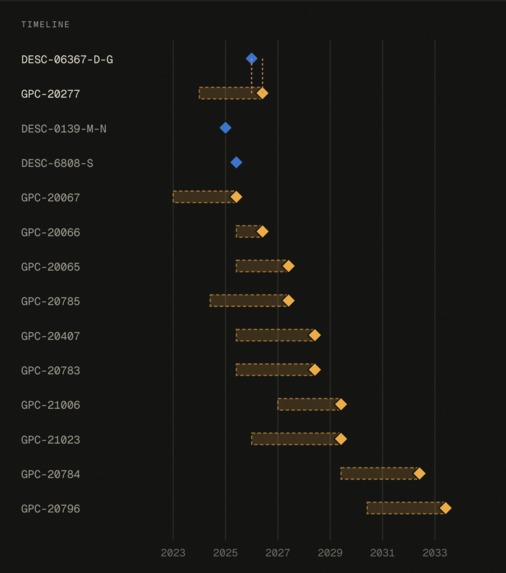
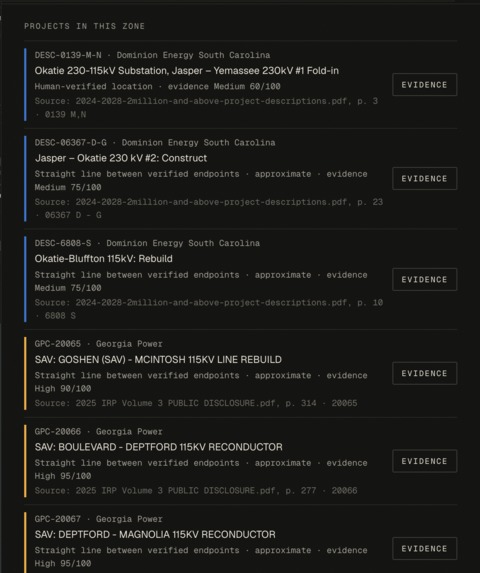
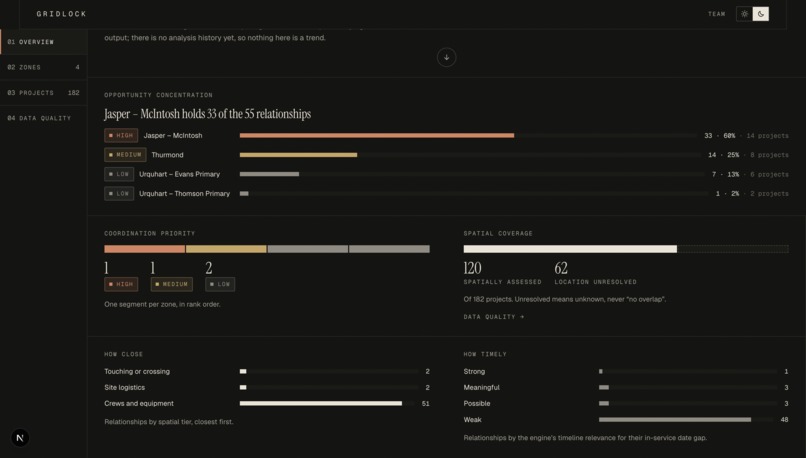
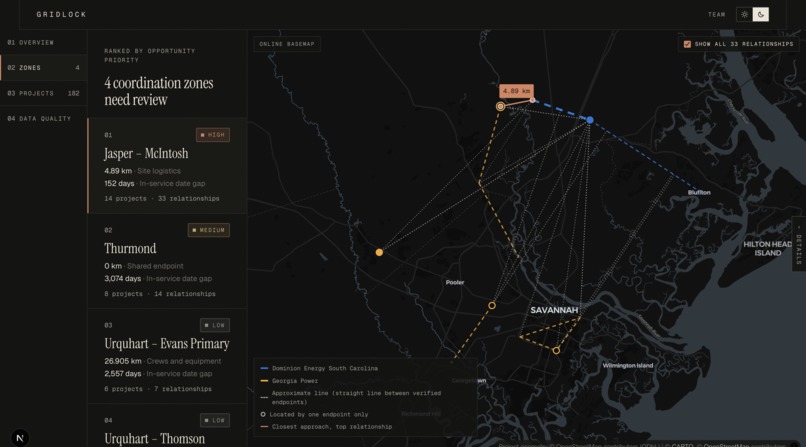
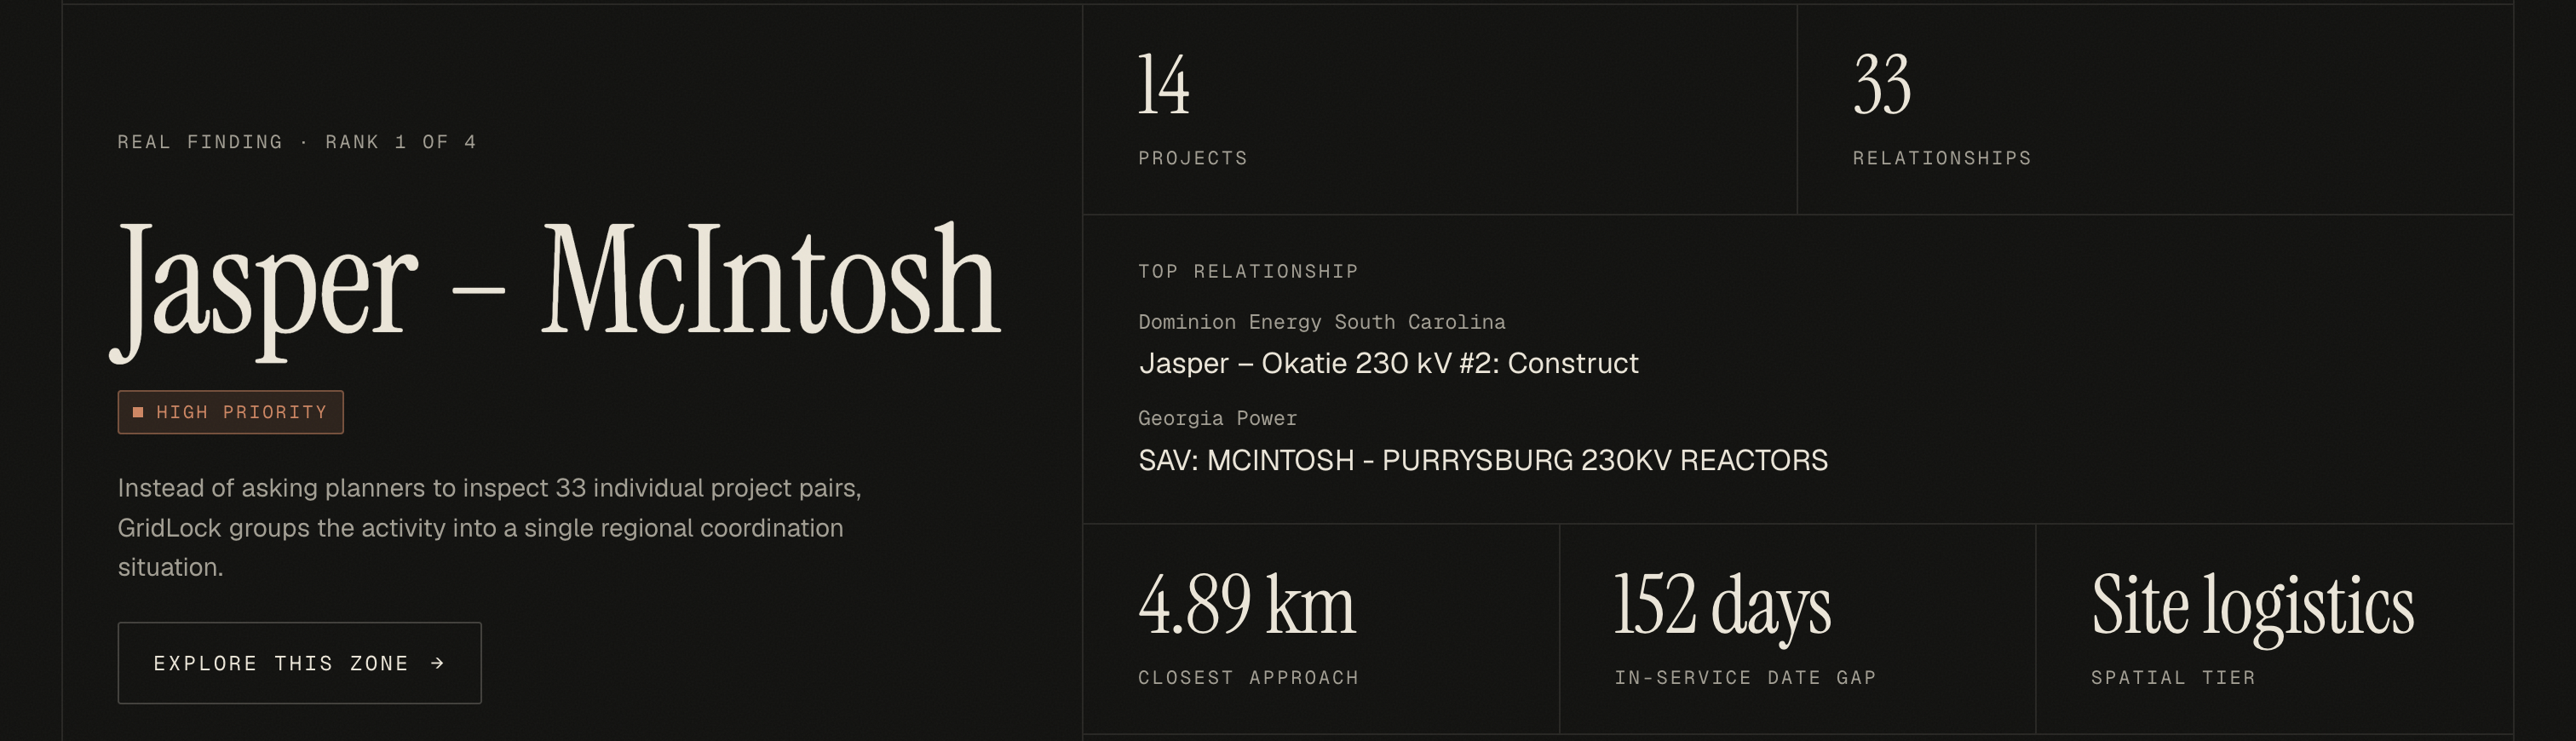
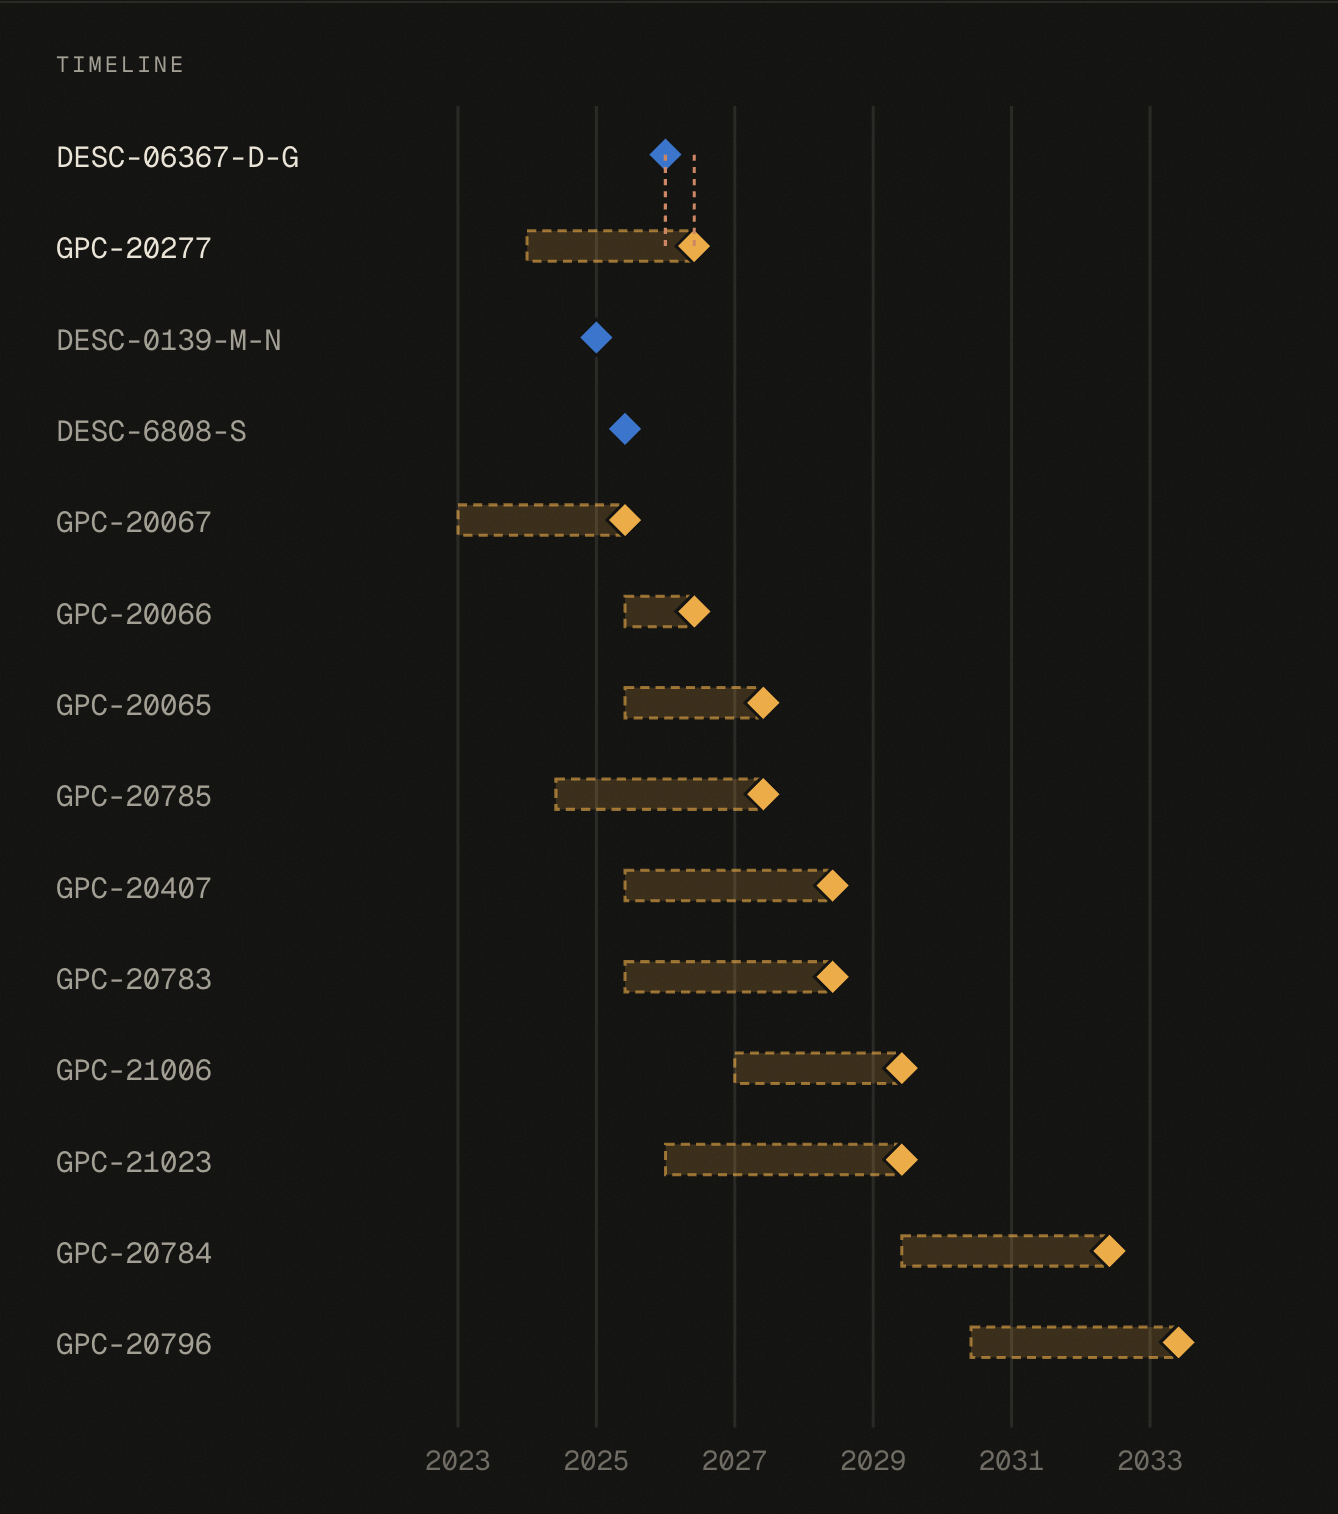
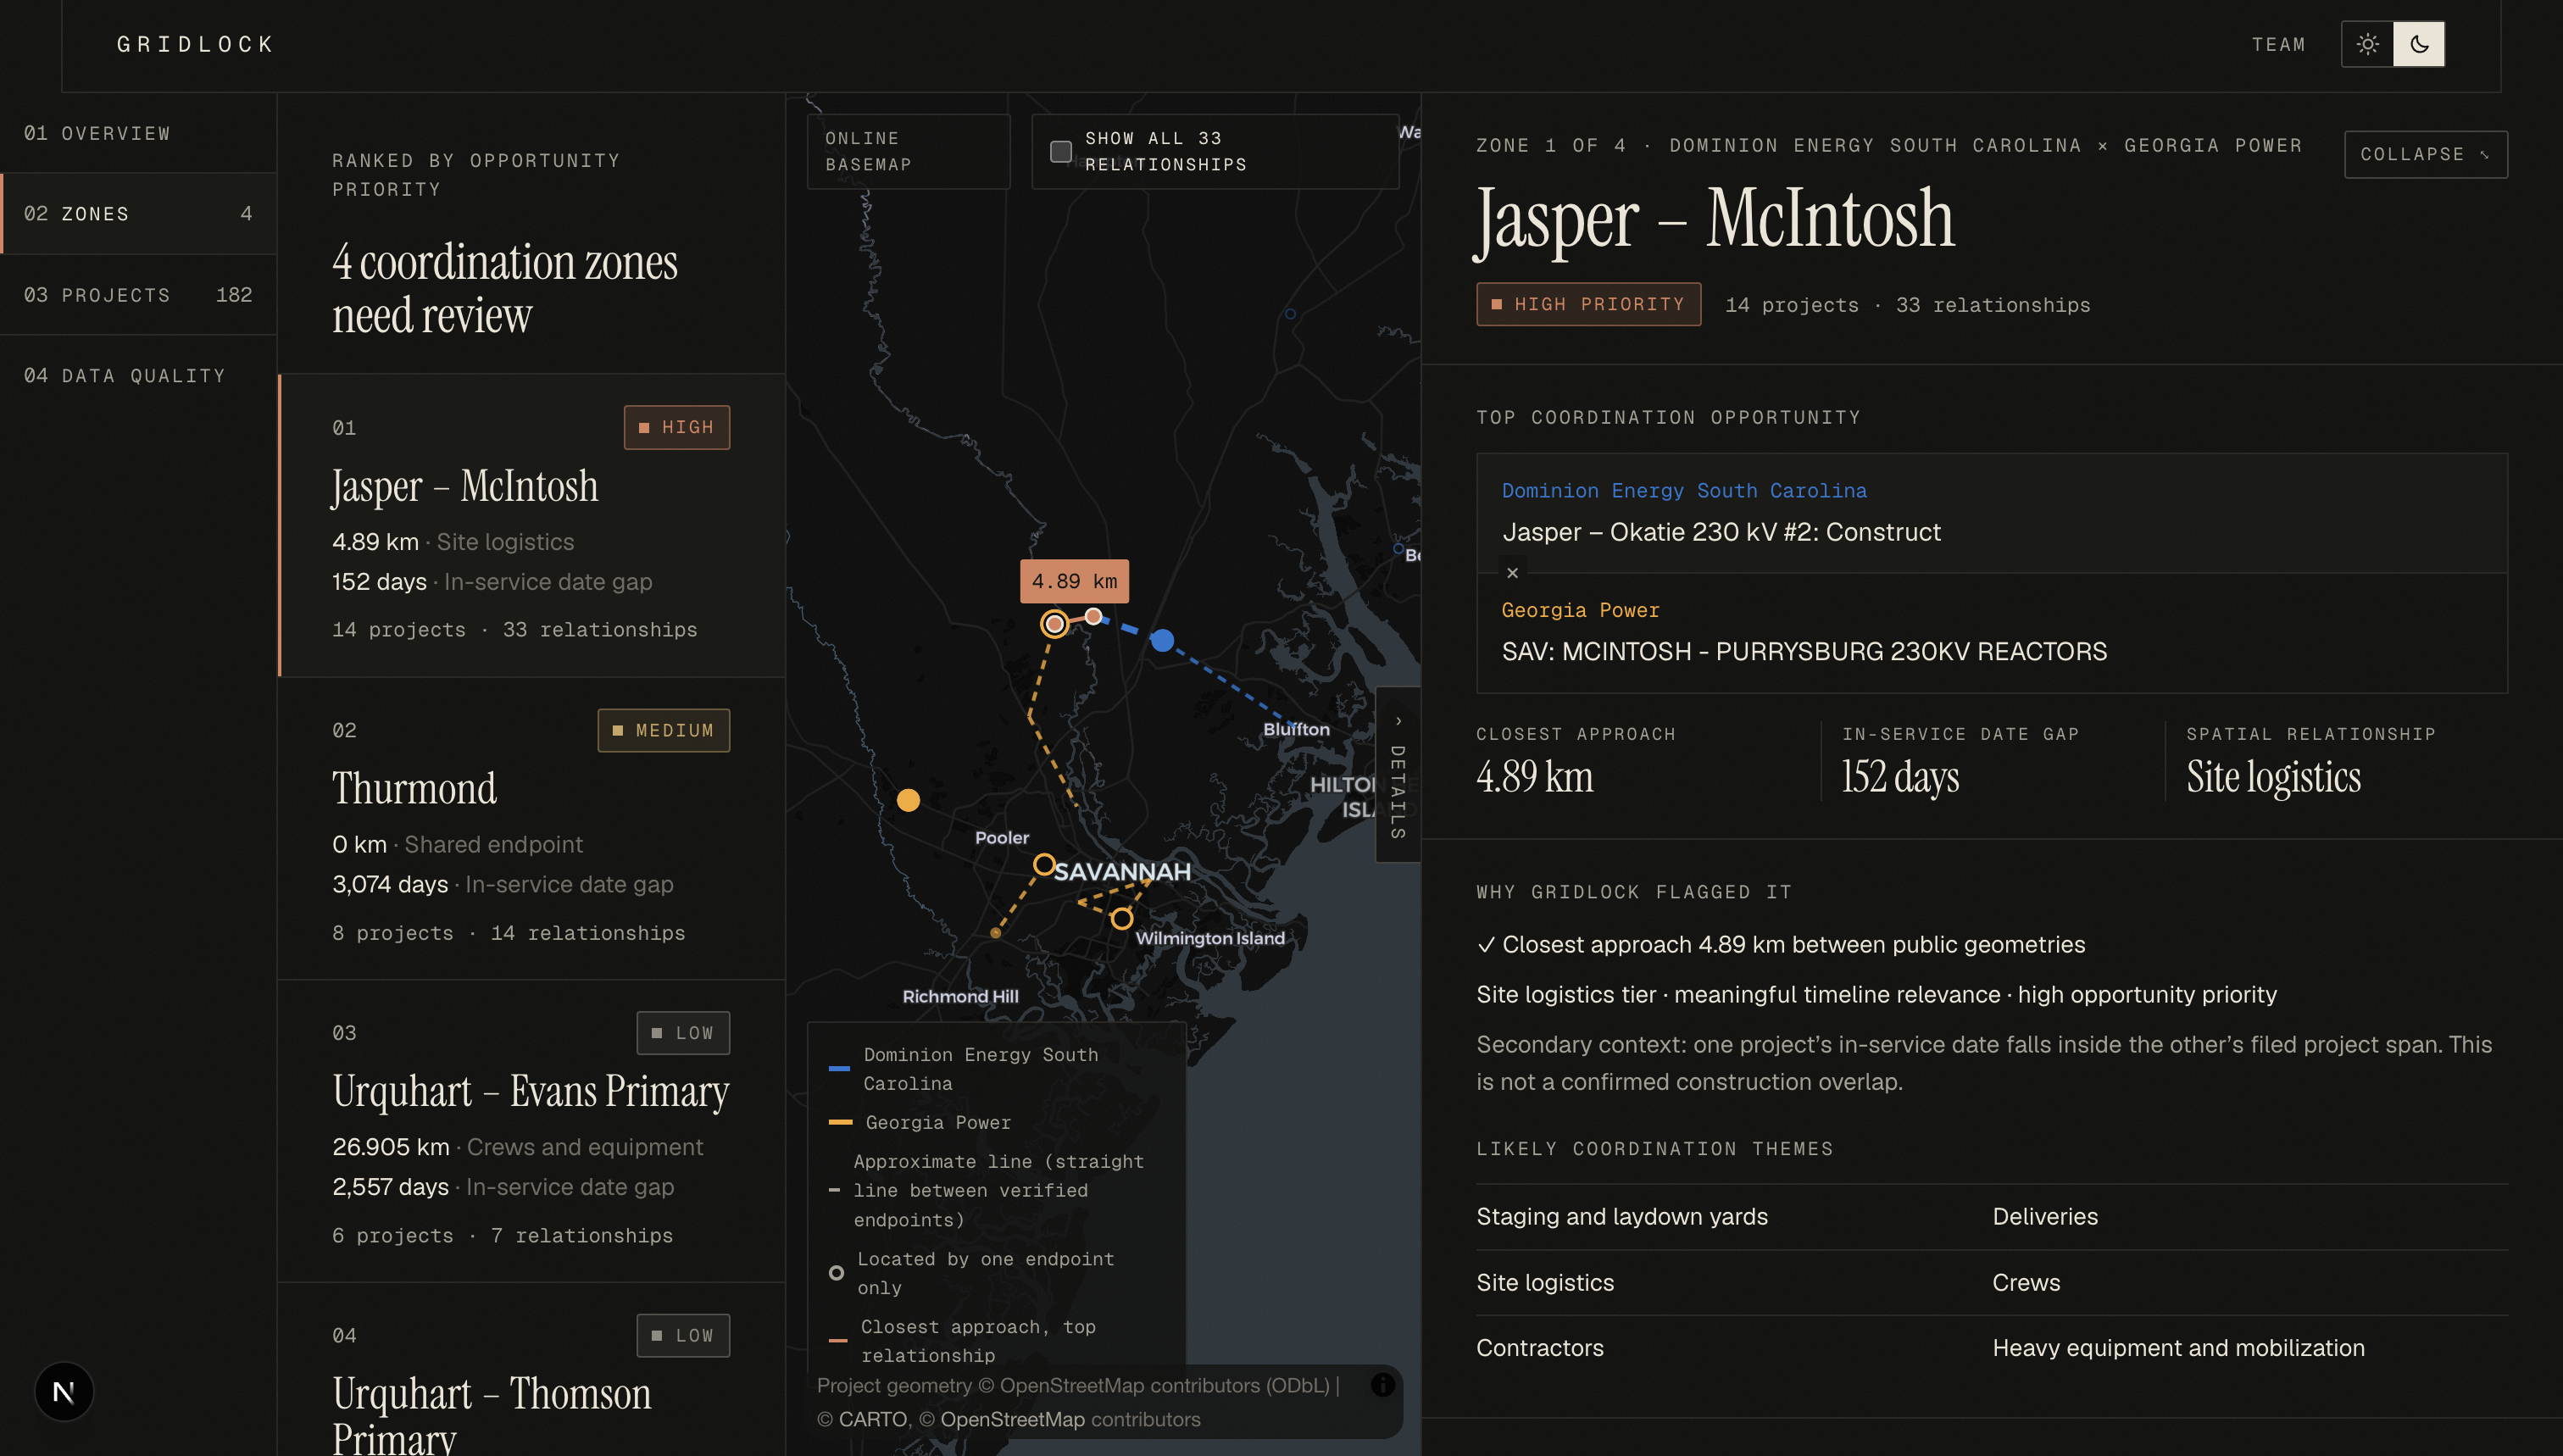
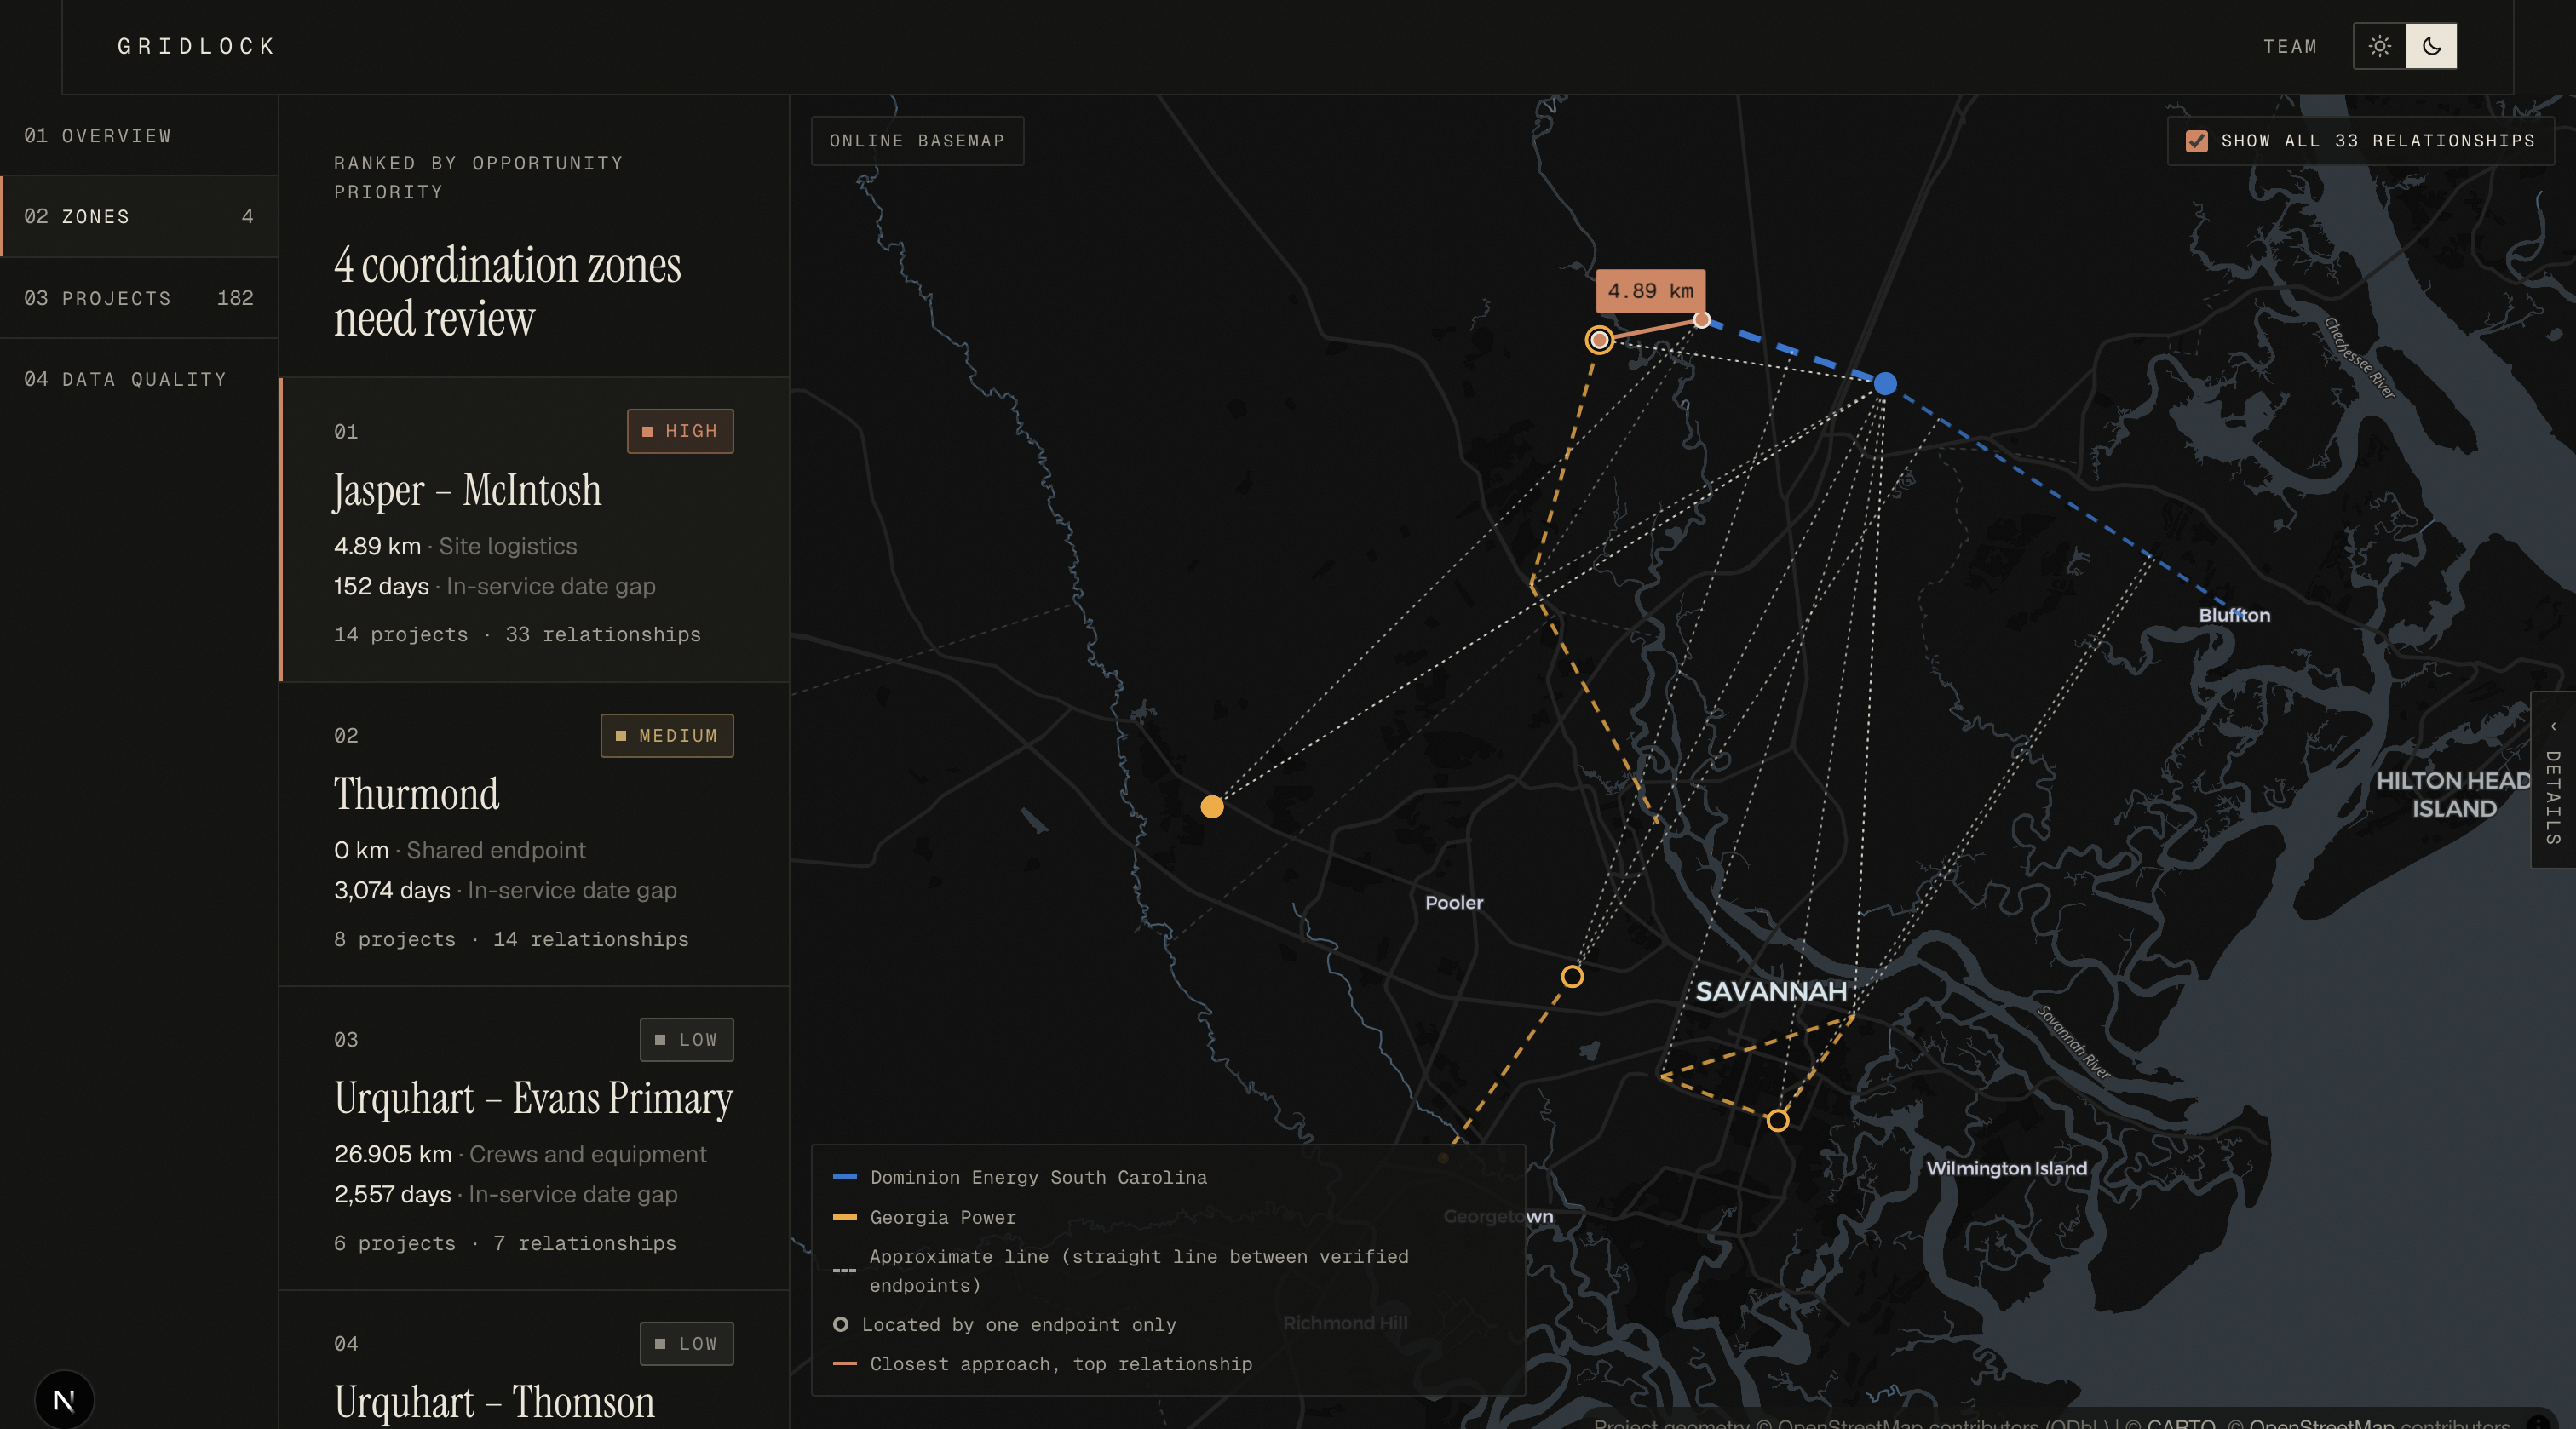
Top finding: Dominion's Jasper – Okatie 230 kV line and Georgia Power's McIntosh – Purrysburg reactors come within 4.89 km of each other, and they go into service 152 days apart. That's close enough to share yards, deliveries and crews.
Our approach: what makes GridLock different
1. We find where a project really is, like a detective. Filings only give names like "Jasper – Okatie". We match each name to real substations in OpenStreetMap. A name alone isn't enough, so every match must pass three checks: it's in the right region, it's run by the right company, and it can handle the project's voltage. When two substations share a name, GridLock picks the pair whose endpoints sit close together, because a real power line connects nearby places. These checks stopped a "Dawson" in the wrong state and a "Grady" in Florida from sneaking in.
2. We measure closest points, not centres. A long line can pass right beside a substation even if its middle is far away. GridLock finds the two nearest points using a flat map projection, then measures the true distance between them on the curved Earth: $$d(A,B) = \min_{p \in A,\; q \in B} \text{geodesic}(p, q)$$
3. We turn a list into a map of relationships. Each project is a dot, and each overlap is a line joining a Dominion dot to a Georgia Power dot. A zone starts from the strongest remaining overlap and grows through connected overlaps until it would cover more than 60 km. Every overlap lands in exactly one zone, so nothing gets hidden. One project can appear in two zones if it really sits in two situations.
4. We rank with common sense about time. Distance comes first, then how close the dates are. The Thurmond pair touches (0 km), but its dates are 3,074 days apart. So it ranks below the Savannah River pair (4.89 km, 152 days), because a crew can't share work that's eight years apart.
5. We keep "how important" and "how sure" separate. Every project gets a 100-point Evidence Quality score: $$\text{score} = \underbrace{20}{\text{source}} + \underbrace{30}{\text{identity}} + \underbrace{35}{\text{location}} + \underbrace{15}{\text{dates}}$$ An overlap is only as trustworthy as the weaker of its two projects. Evidence never changes a zone's priority: a shaky crossing is still a crossing, and it just carries a warning.
6. We never guess.
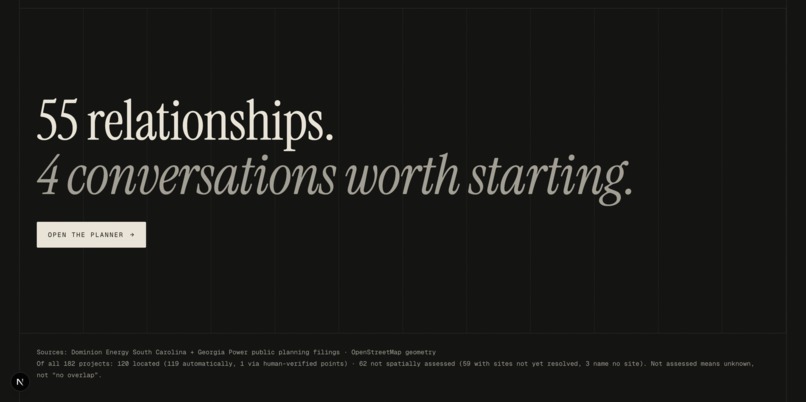
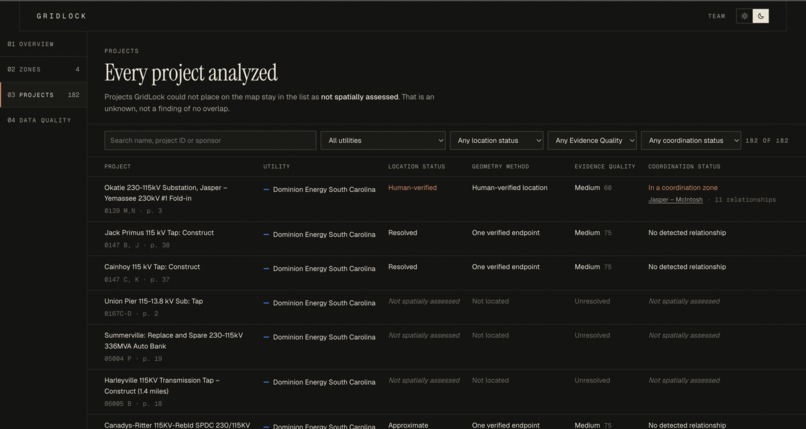
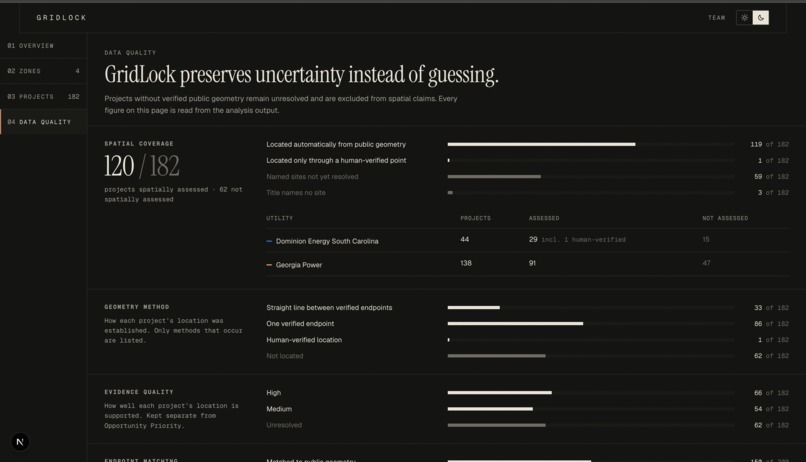
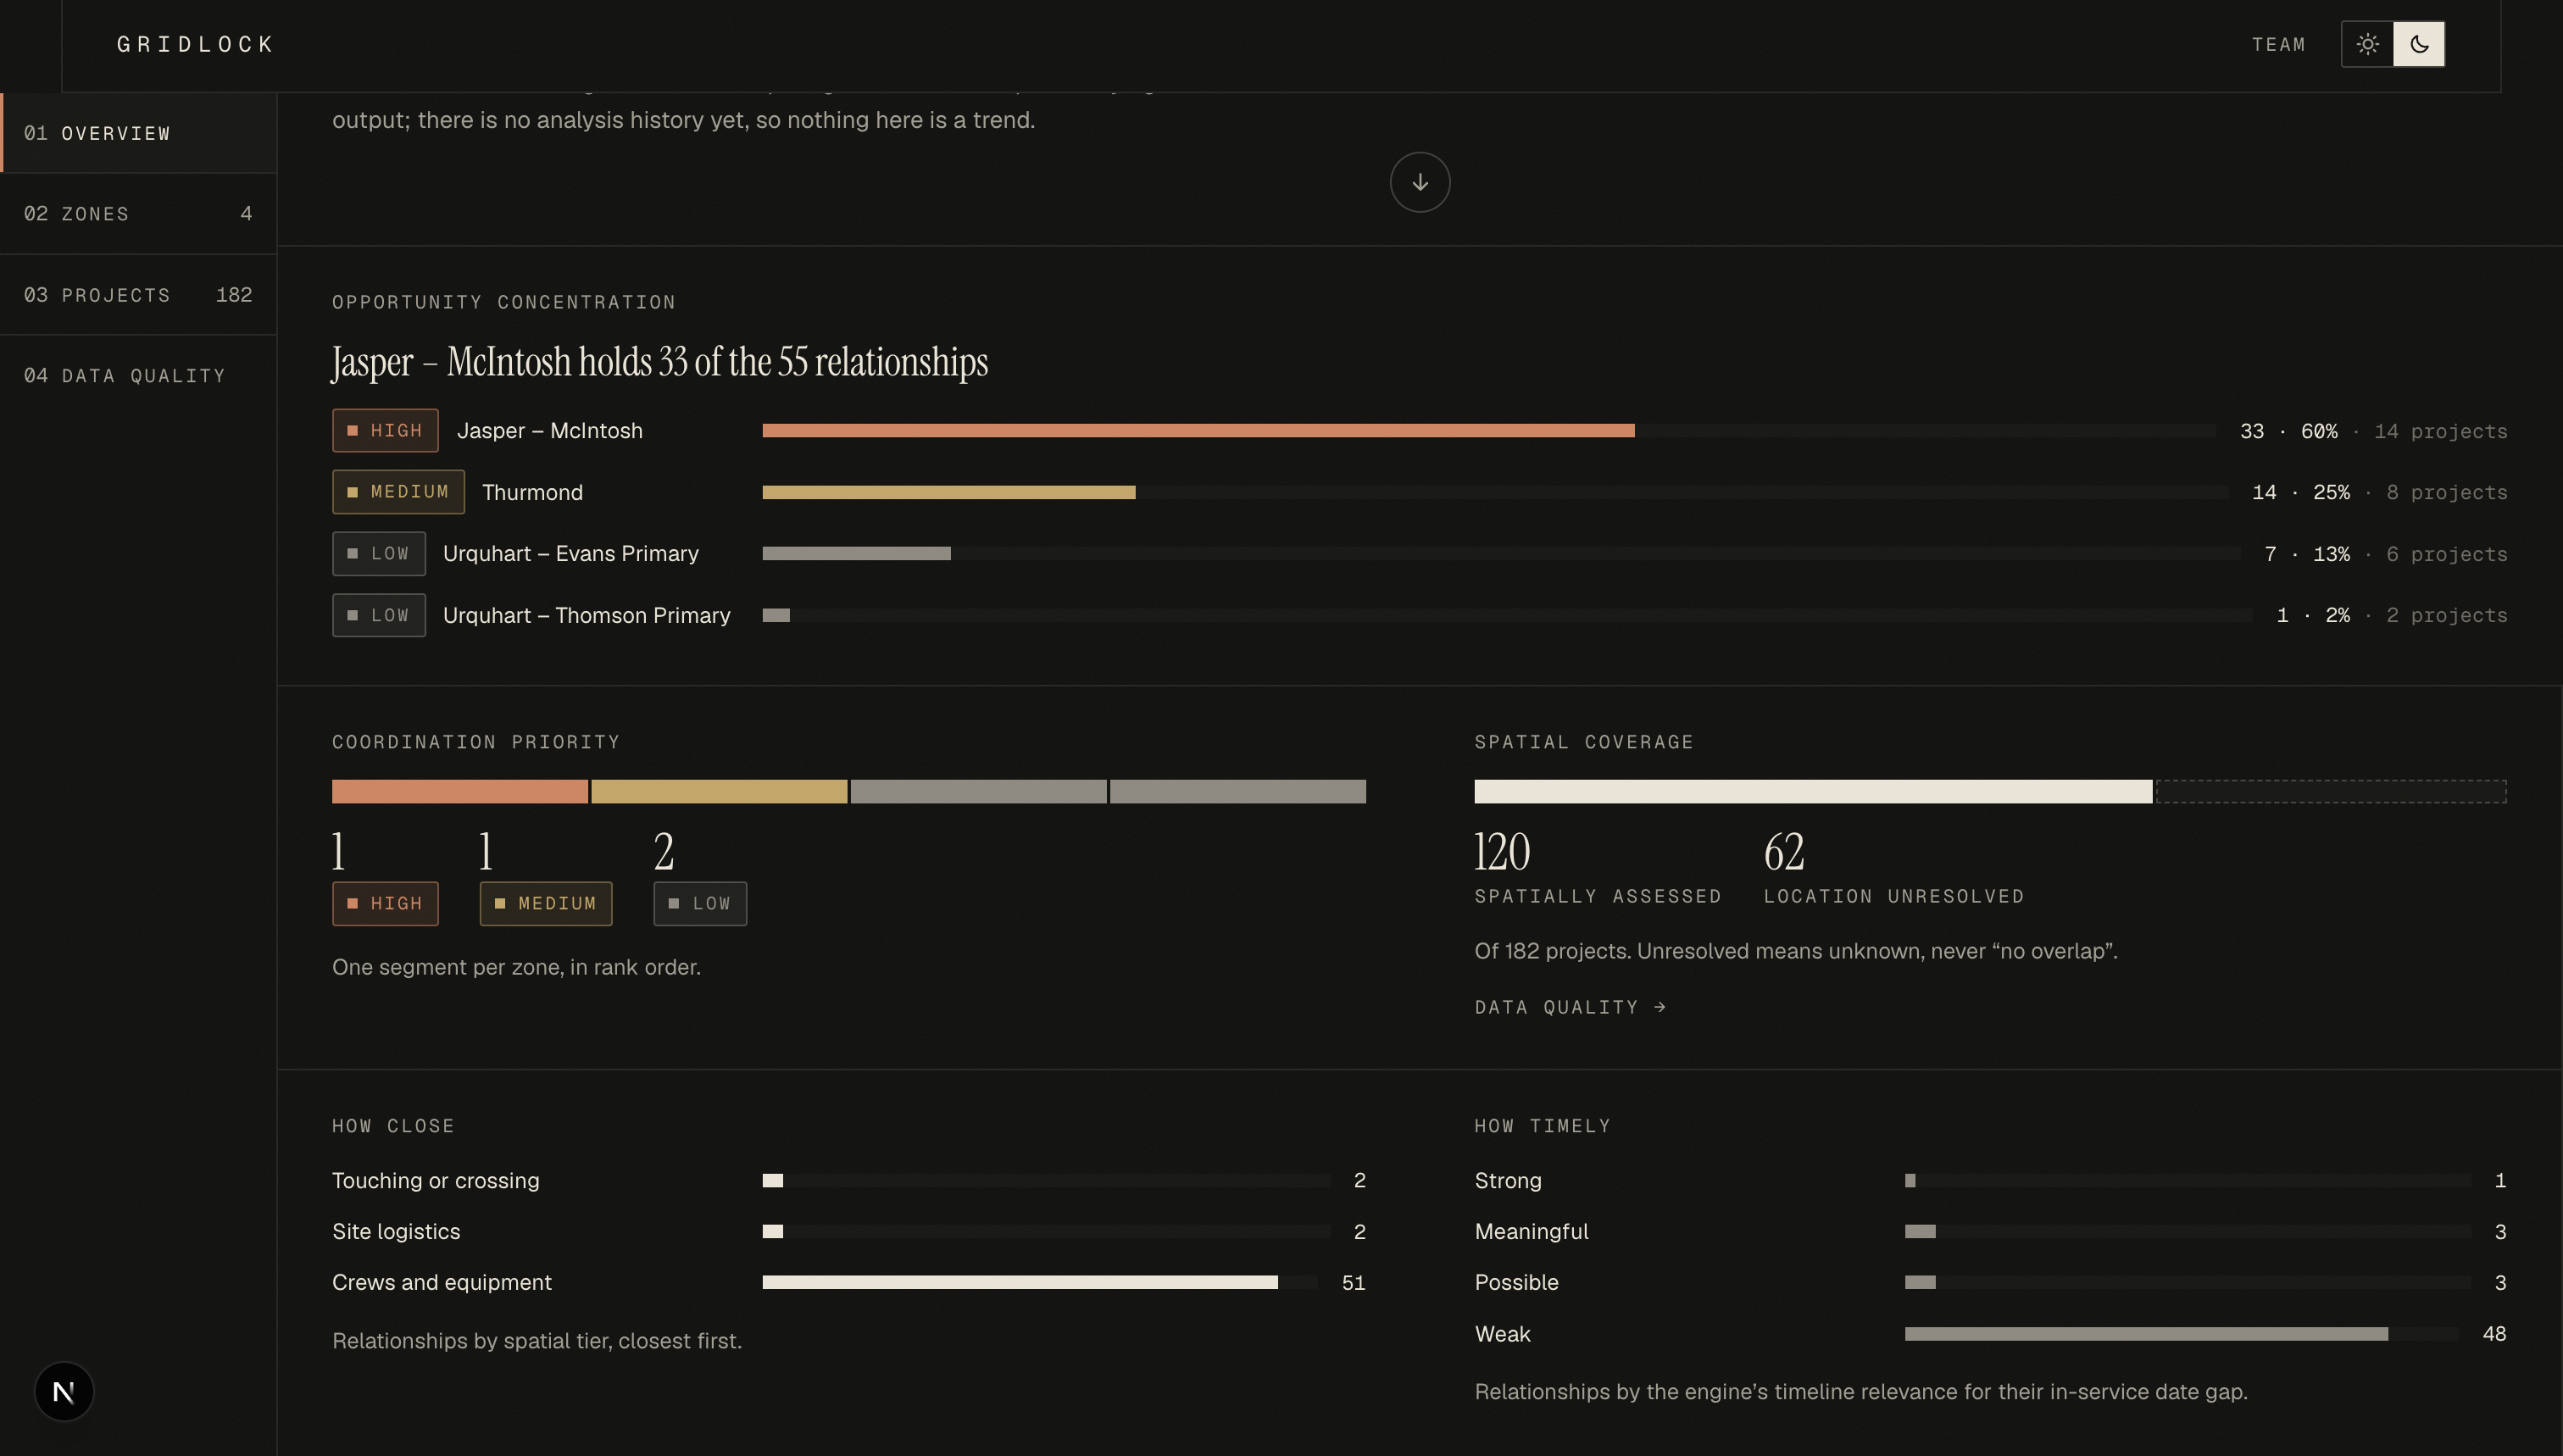
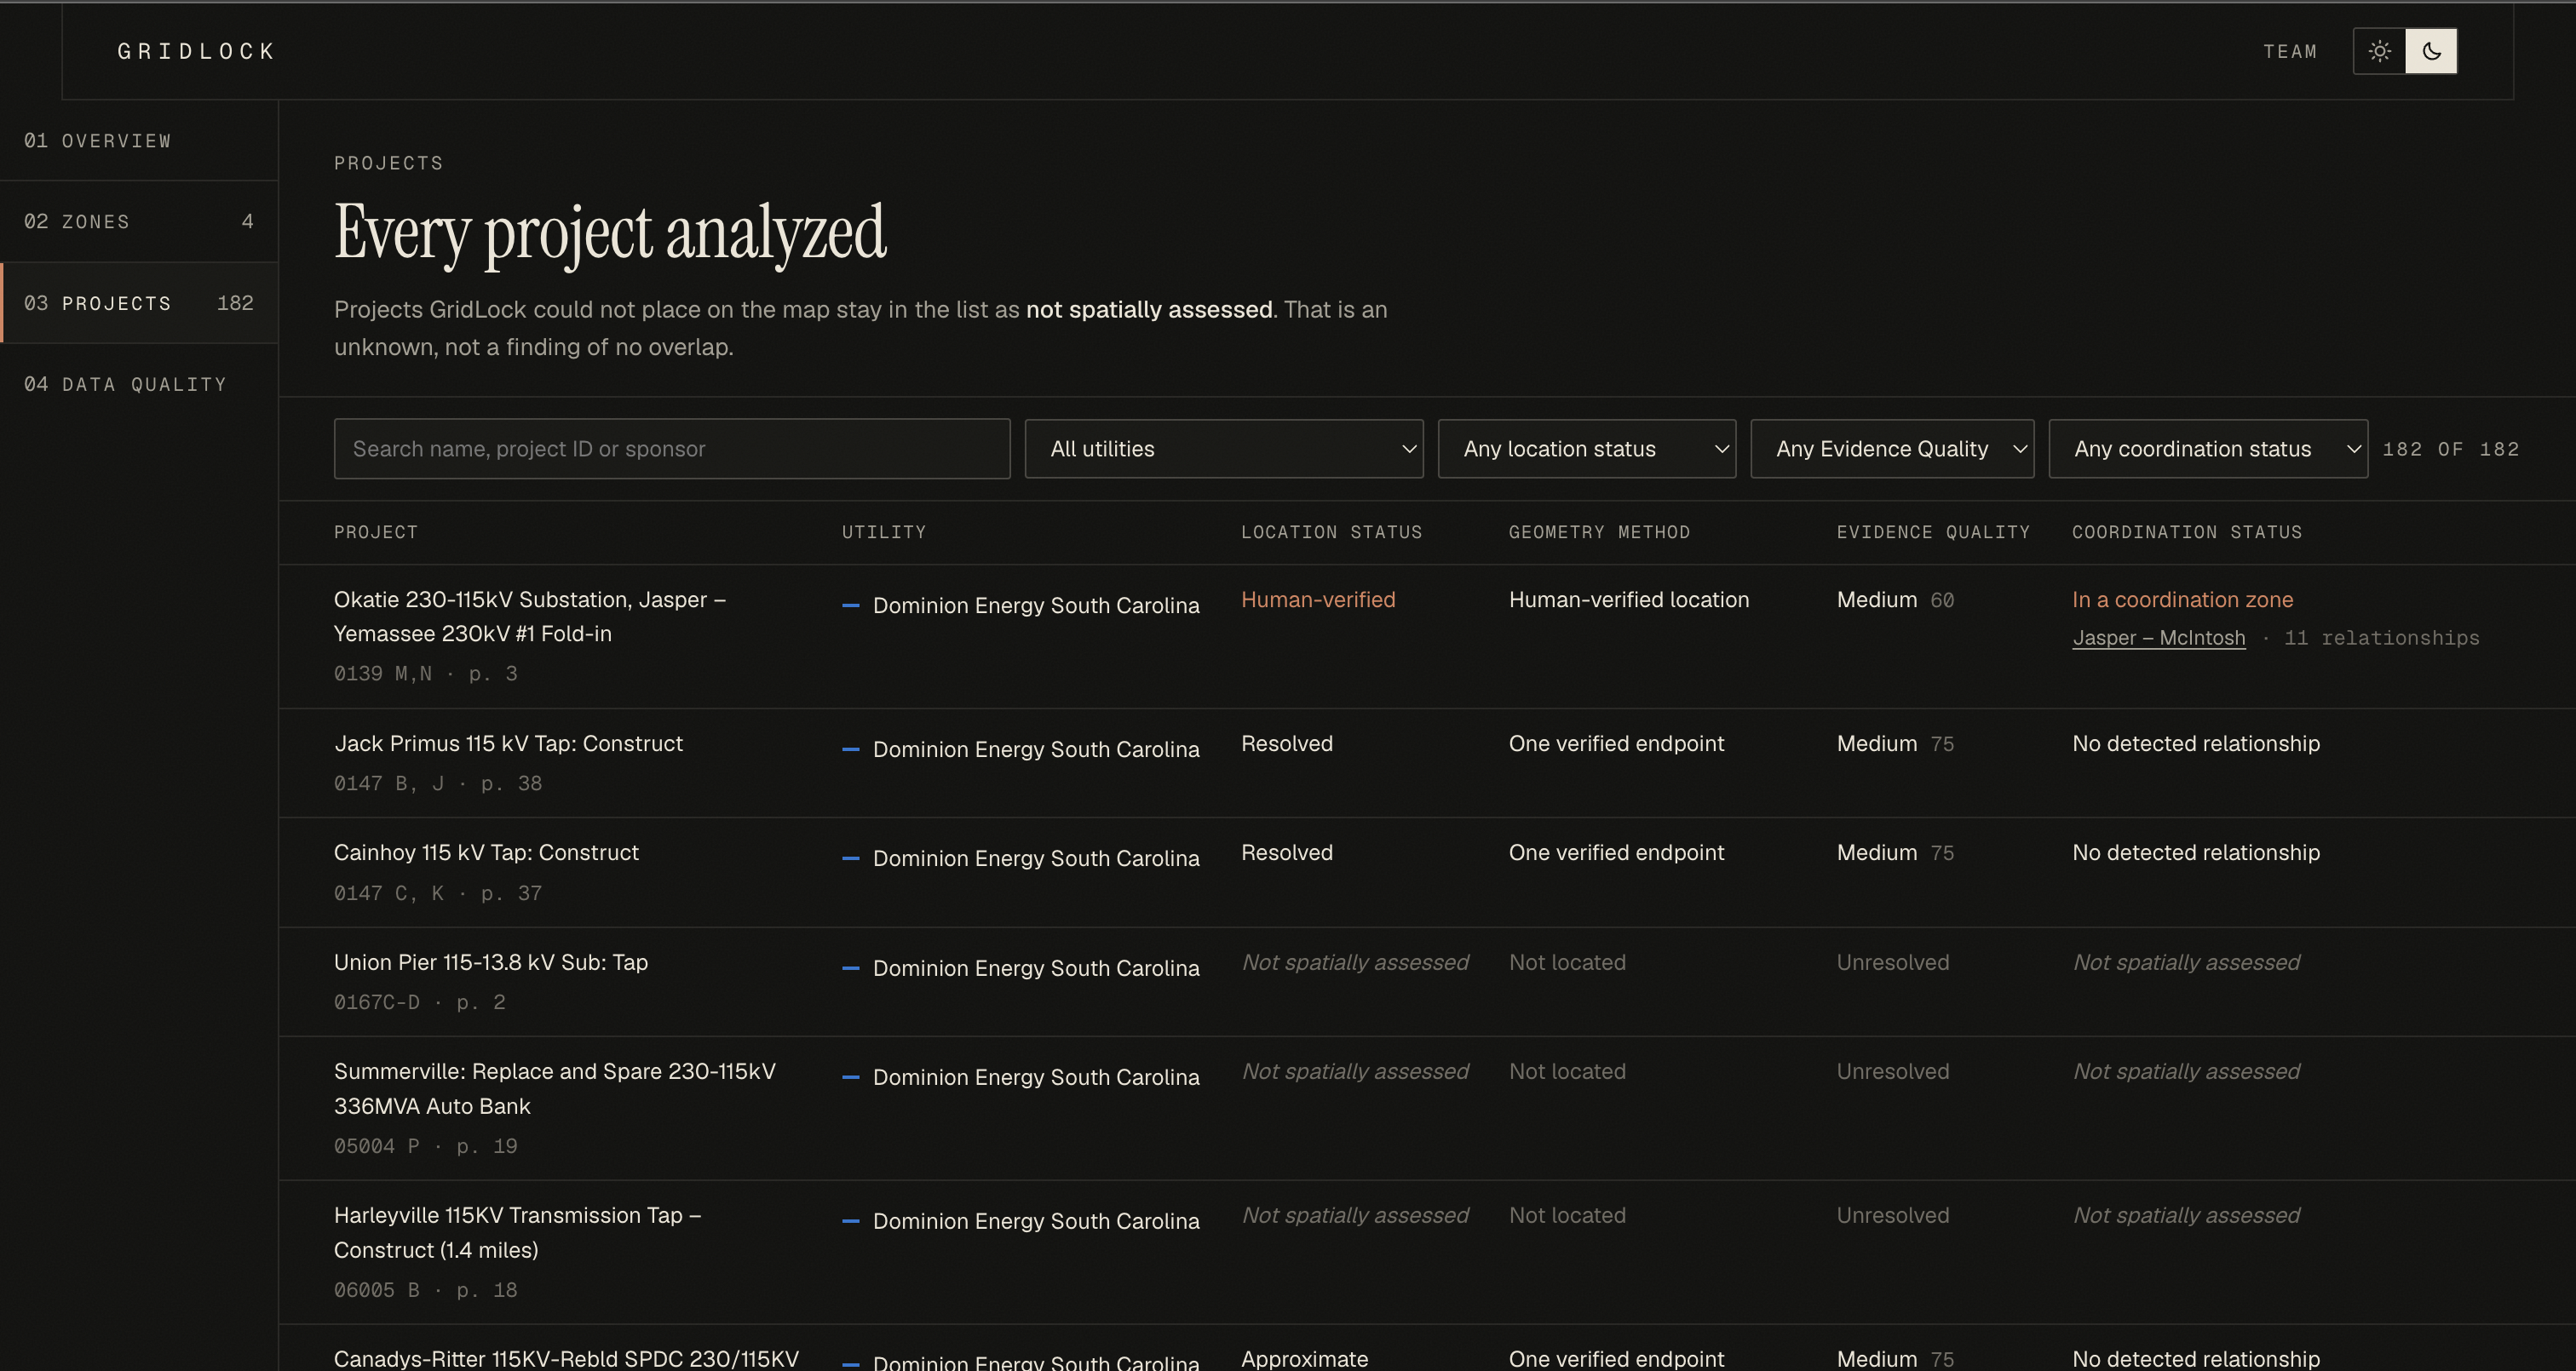
- Unplaced projects: the 62 projects we couldn't place are marked "not assessed", never "no overlap".
- Ambiguous names: 3 names match equally good substations in different places, so GridLock leaves them unresolved instead of picking one.
- Missing construction windows: the filings don't include them, so we compare in-service dates and say so.
- Hand-placed locations: we placed exactly one project by hand (Okatie). Its location comes from a public siting filing, with the reviewer and page numbers recorded.
How accurate it is
The sponsor gave us 6 known overlaps, measured centre to centre. We kept that sheet out of the pipeline and used it only to check our answers afterwards.
- All 6 recovered, with the date gaps matching exactly, plus 49 more found.
- Closest points changed the story:
| Pair | Sponsor sheet | GridLock |
|---|---|---|
| Hooks – Thurmond × Evans – Thurmond Dam | 6.58 km | 0 km: both end at the same substation |
| Jasper – Okatie × McIntosh – Purrysburg | 9.09 km | 4.89 km: moves up to the "share site logistics" tier |
- The same inputs give the same output, byte for byte. The OpenStreetMap snapshot is saved with a fingerprint, and a test re-runs the pipeline to check.
- We state our limits. Most line routes are straight lines between endpoints, not surveyed paths, and the app labels them that way.
How we built it
- Reading the filings:
pypdfplus rule-based parsing reads Dominion's project descriptions and Georgia Power's 10-year plan (IRP Volume 3). The CEII notice on every page is stripped out, and PDF text is treated as data, never as instructions. - Map data: about 30,000 power lines and substations downloaded once from OpenStreetMap (Overpass API) and saved for offline use.
- Analysis:
rapidfuzzfor name matching,shapelyandpyprojfor distances,networkxfor the relationship graph, andpydanticfor strict data models. - Config: every threshold, weight and label lives in one config file, and nothing is hard-coded.
- One shared contract: the backend's data models generate a JSON Schema and TypeScript types, so the frontend and backend can't drift apart. The frontend does no analysis of its own; it only displays results.
- Frontend: Next.js, React and MapLibre. It has four views (Overview, Zones, Projects, Data Quality), an evidence drawer on every project, and light and dark themes, and it works on a phone.
- Works offline: if the internet drops, the map switches to bundled Census state outlines, and every result stays the same.
- 224 automated tests.
Challenges we ran into
- Most substations have no name. Only 2,388 of 7,279 substations in the region have a name in OpenStreetMap, which makes matching by name hard. We chose to leave projects unplaced rather than guess.
- Same name, wrong place. Our first version matched by name alone and put substations in the wrong state. We fixed it with the region, operator and voltage checks plus the "endpoints must sit together" rule.
- Time almost broke our zones. 48 of the 55 overlaps are more than a year apart. Splitting zones by date left us with about 44 tiny zones, which is no help to anyone. We kept zones based on geography and added a "coordinate in stages" warning instead.
- Untimely crossings were ranked too high. A crossing eight years out was outranking a timely overlap. We added a rule: crossings more than 2 years apart drop to Medium priority.
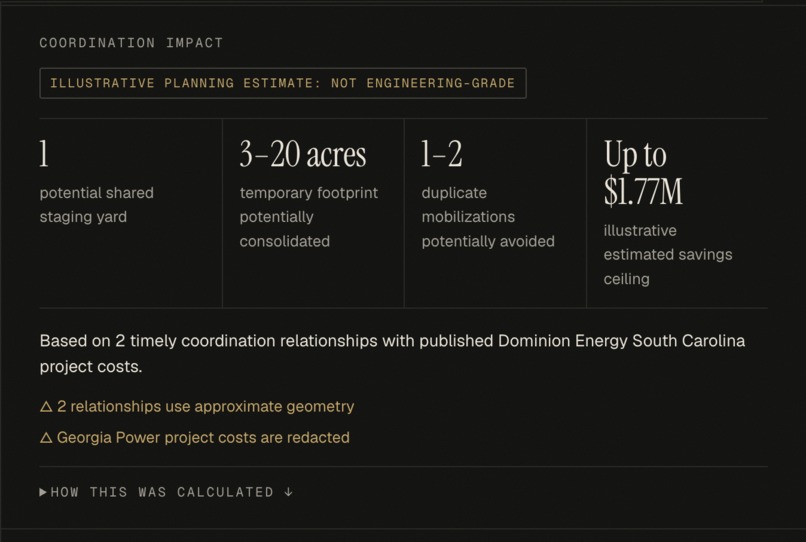
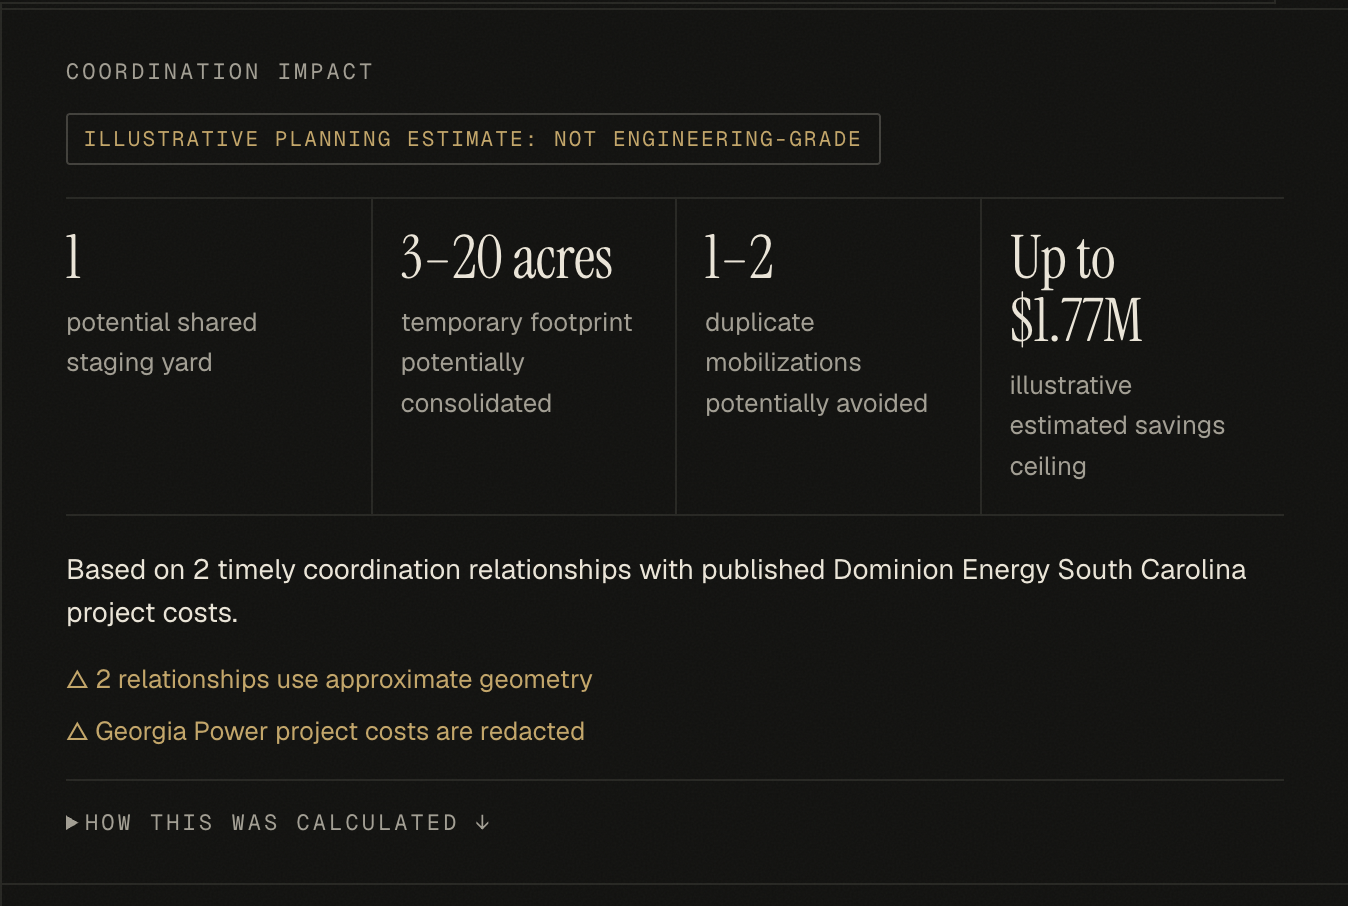
- Georgia Power's costs are redacted. We didn't invent a savings number. Doing that would go against the whole point of the tool.
Accomplishments we're proud of
- Checking 2,639 possible pairs and ending with 4 ranked, explainable zones.
- Recovering all 6 of the sponsor's overlaps, and showing where closest-point measuring changes the answer.
- Tracing every number back to a page in a public filing.
What we learned
More data isn't more help; fewer, better alerts are. Where you measure from changes the result. And a tool earns trust by showing what it doesn't know.
What's next
- Add more utilities from the SERTP regional planning group.
- Use real line routes where they're public.
- Add a cost and shared-land estimate once cost data is available.
- Use construction start dates as utilities publish them.
Built With
- fastapi
- geojson
- httpx
- maplibre-gl
- networkx
- next.js
- node.js
- openpyxl
- openstreetmap
- overpass-api
- pnpm
- pydantic
- pypdf
- pyproj
- pytest
- python
- pyyaml
- rapidfuzz
- react
- shapely
- typescript
- us-census-tiger
- uv
- uvicorn

Log in or sign up for Devpost to join the conversation.