-
-
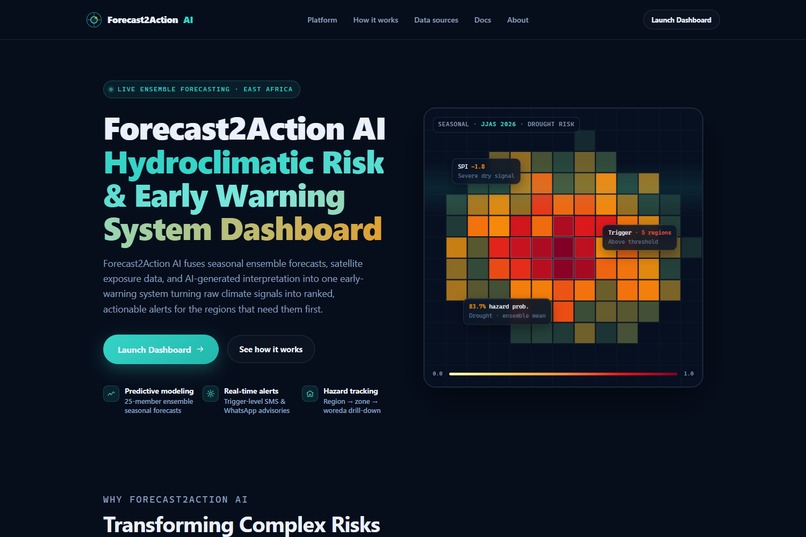
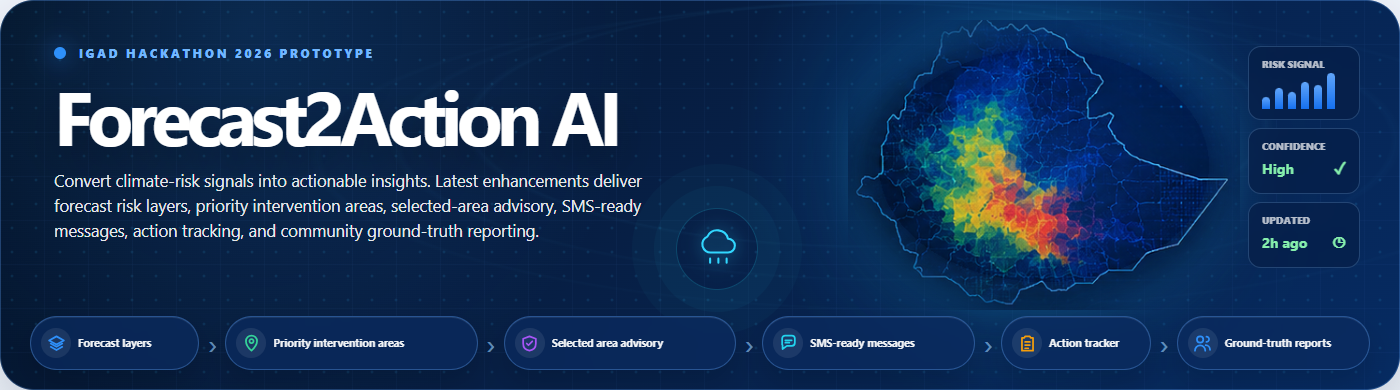
01_landing_hero
-
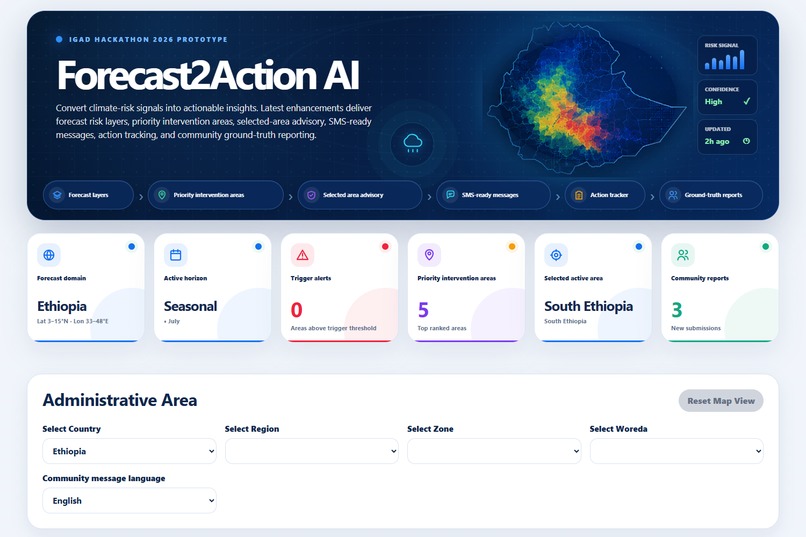
02_dashboard_overview
-
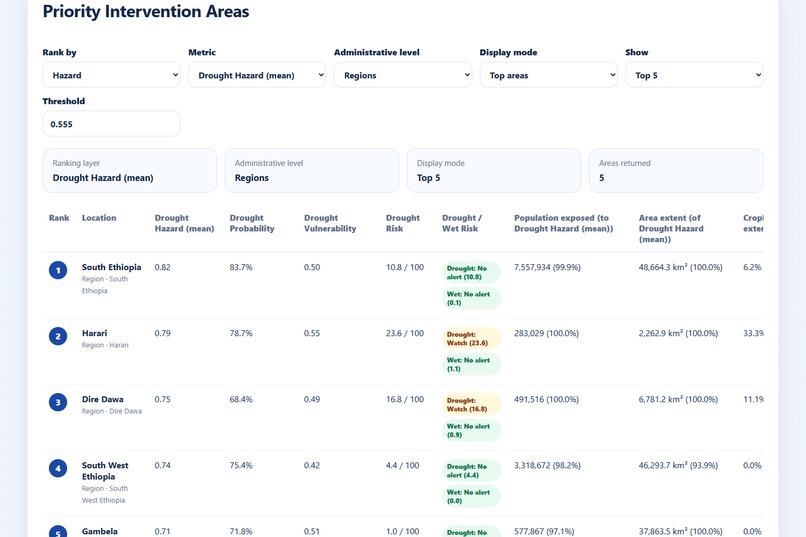
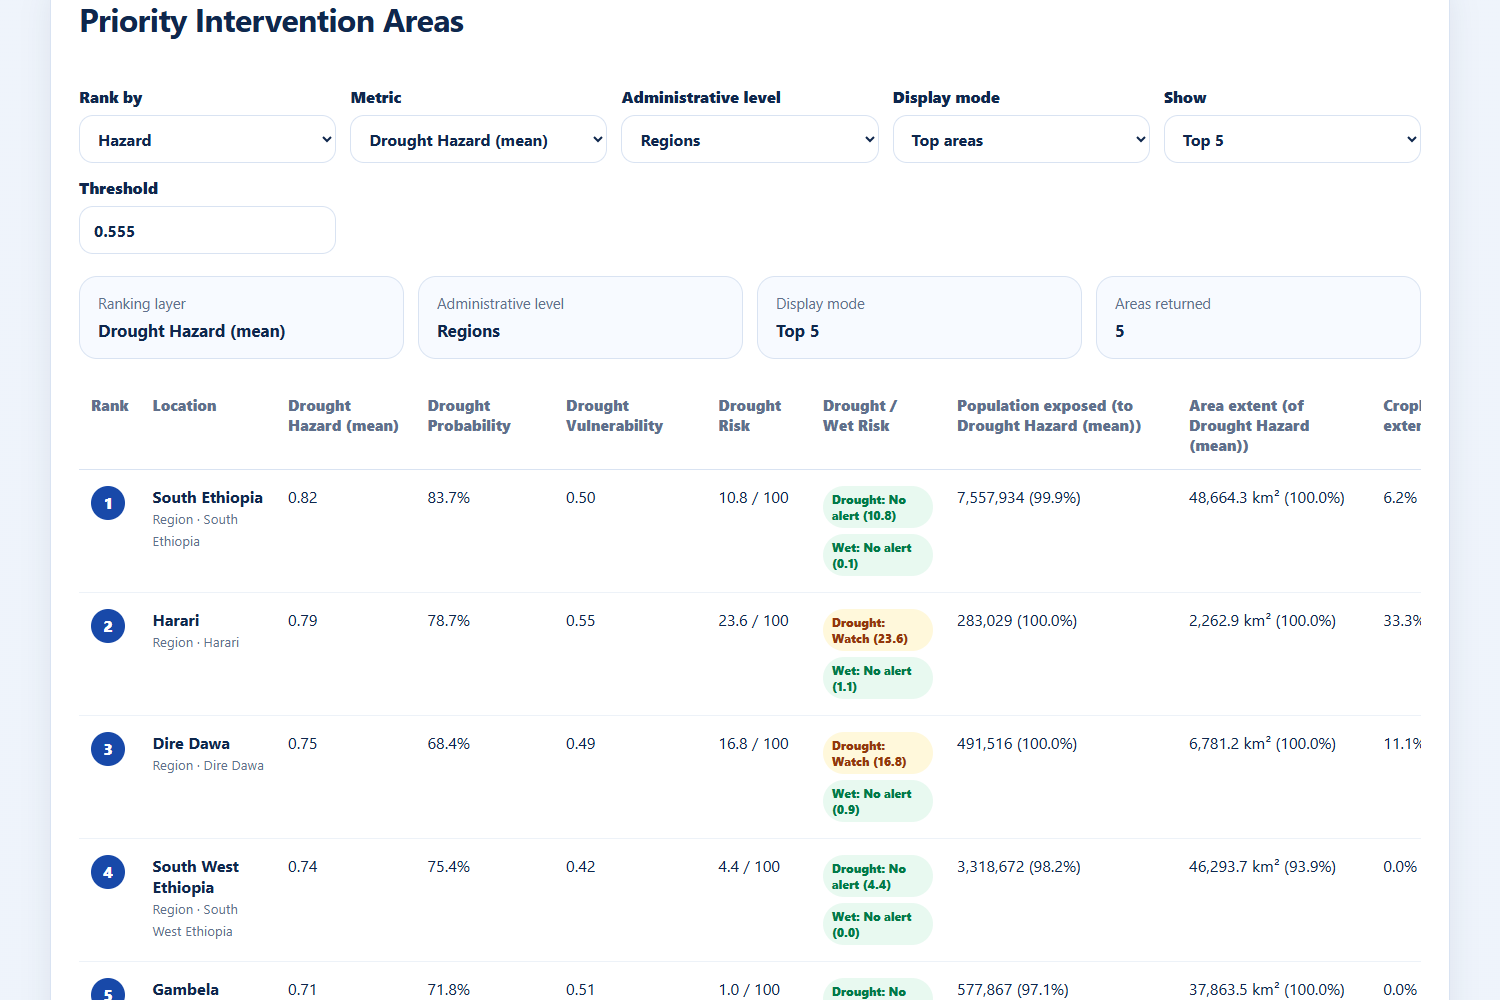
03_priority_intervention_table
-
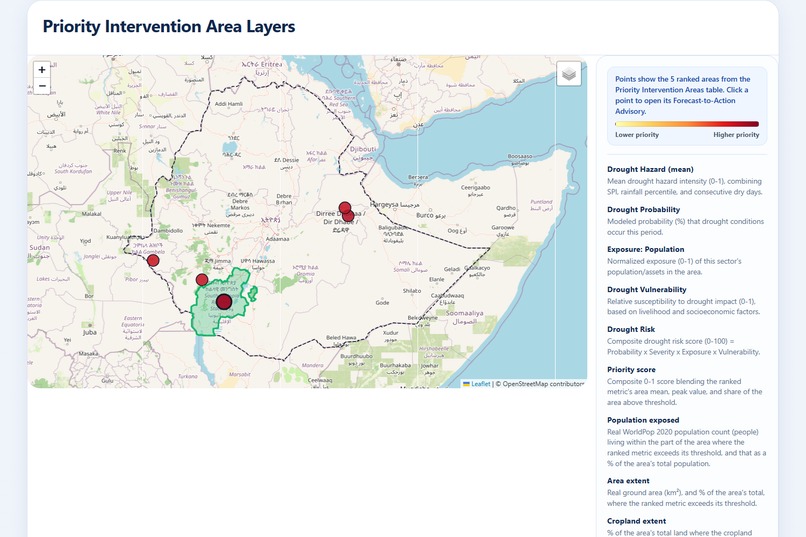
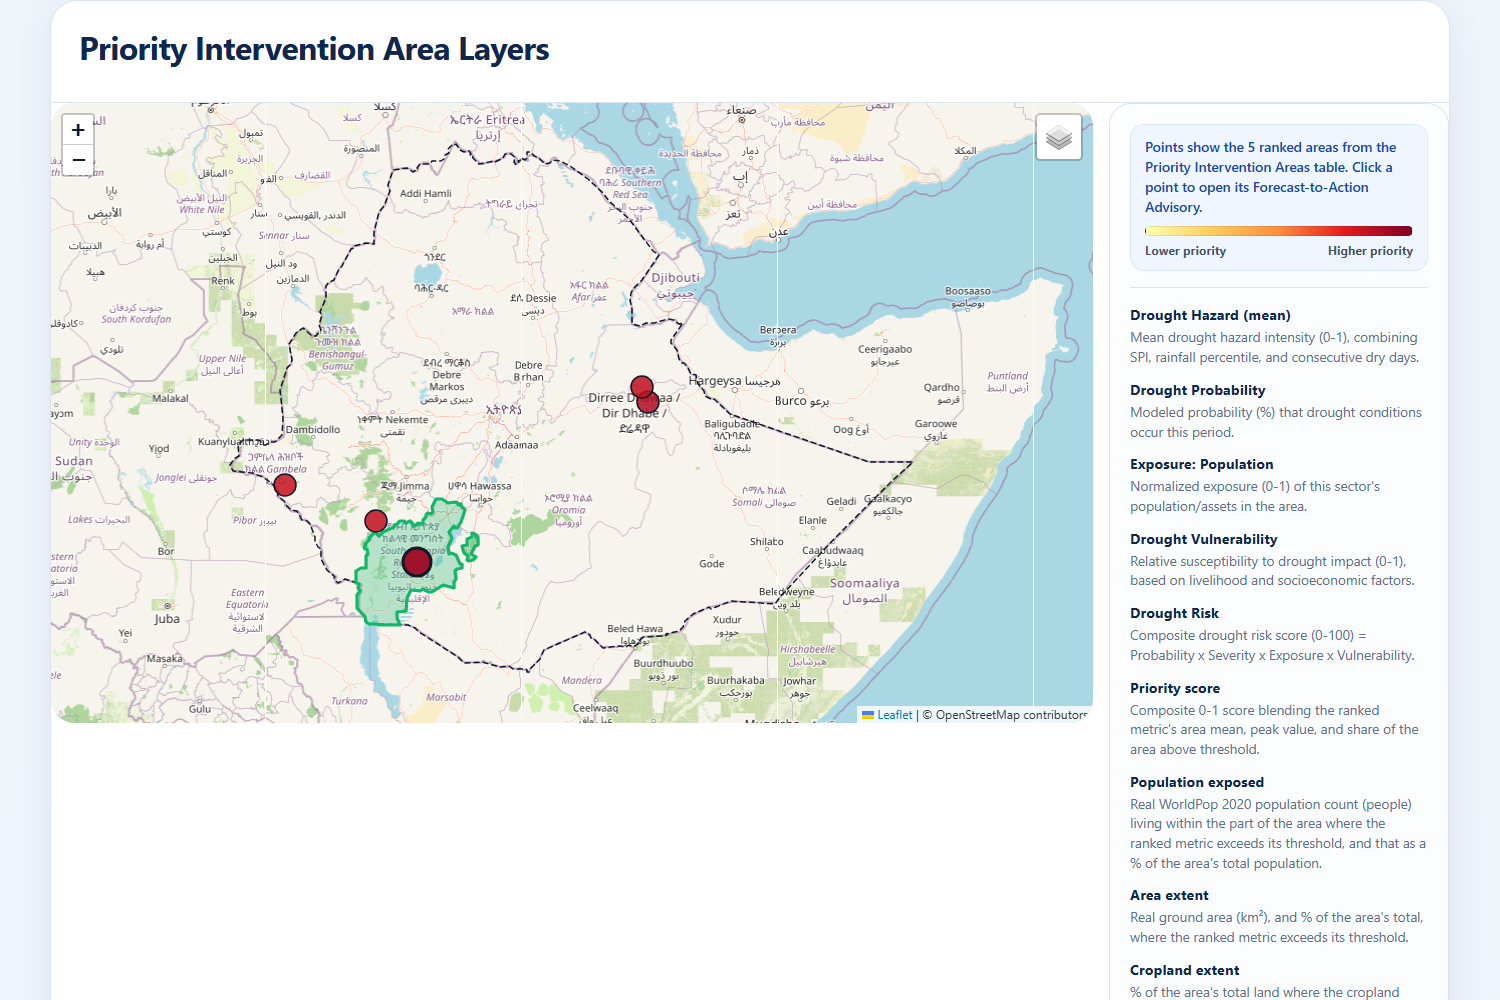
04_risk_map
-
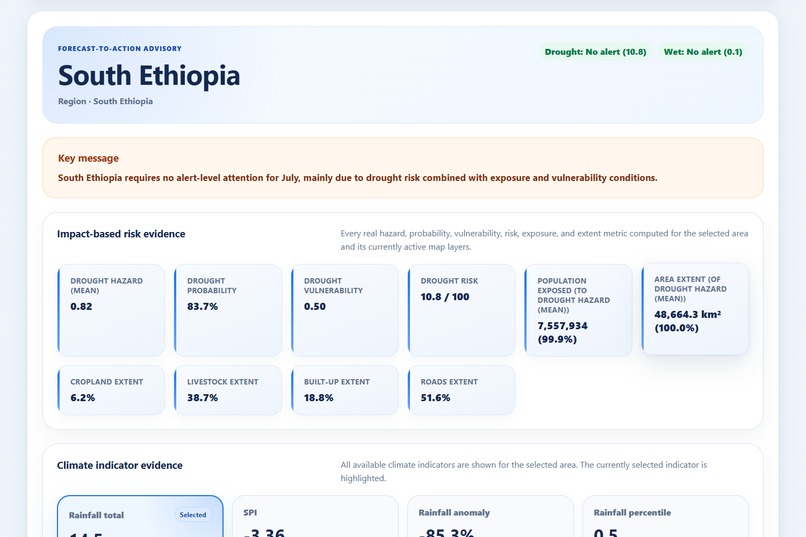
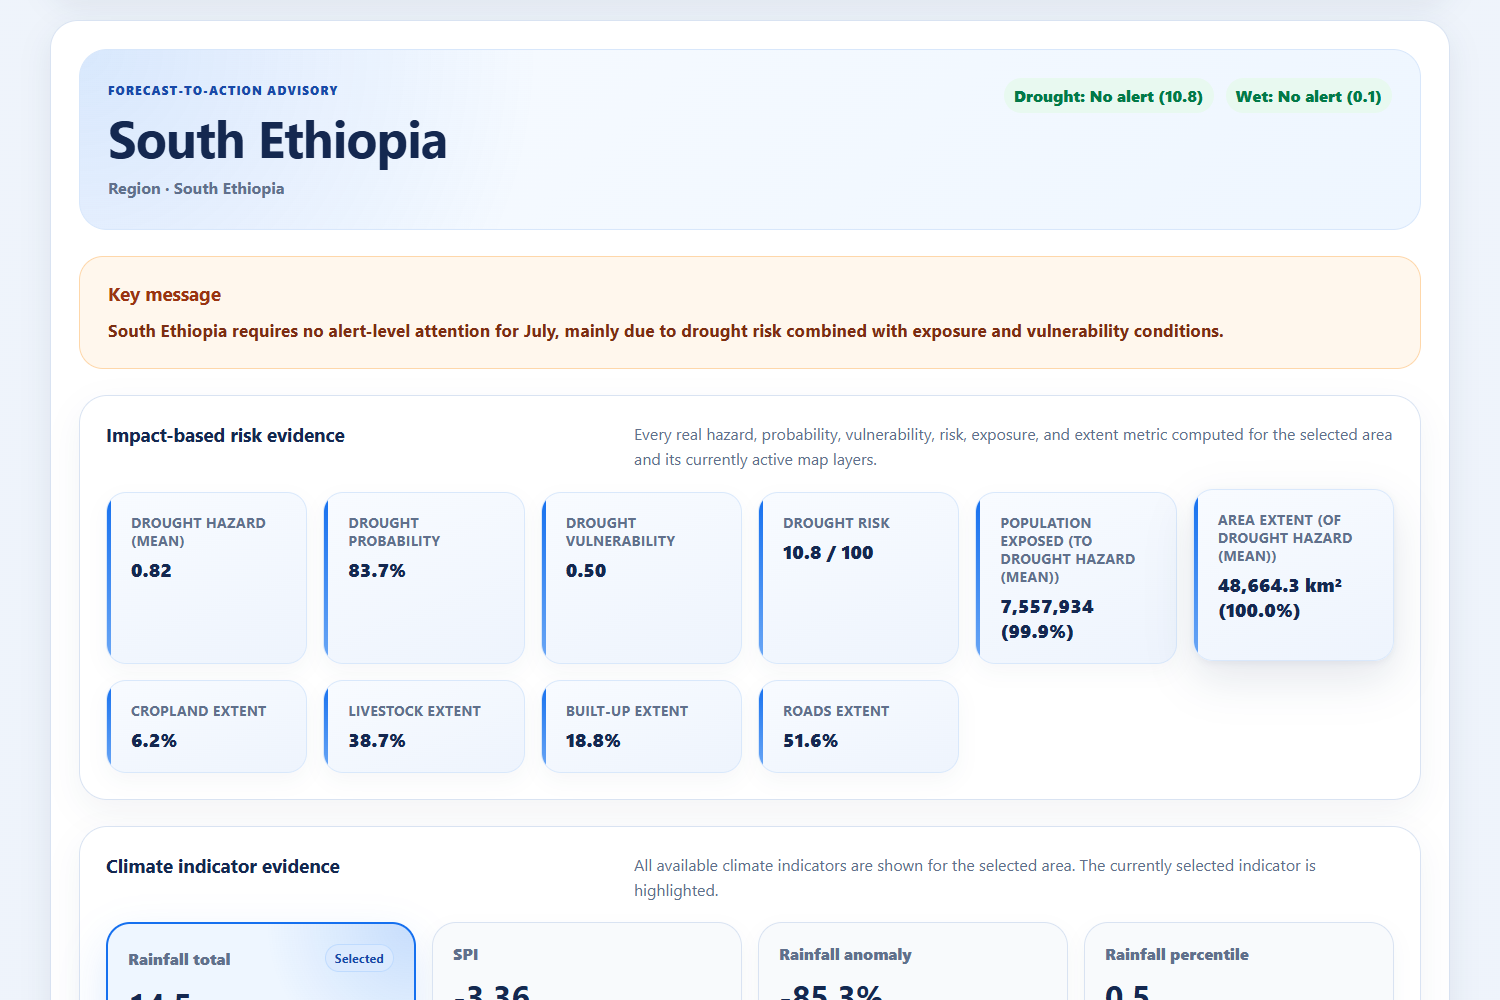
05_selected_area_advisory
-
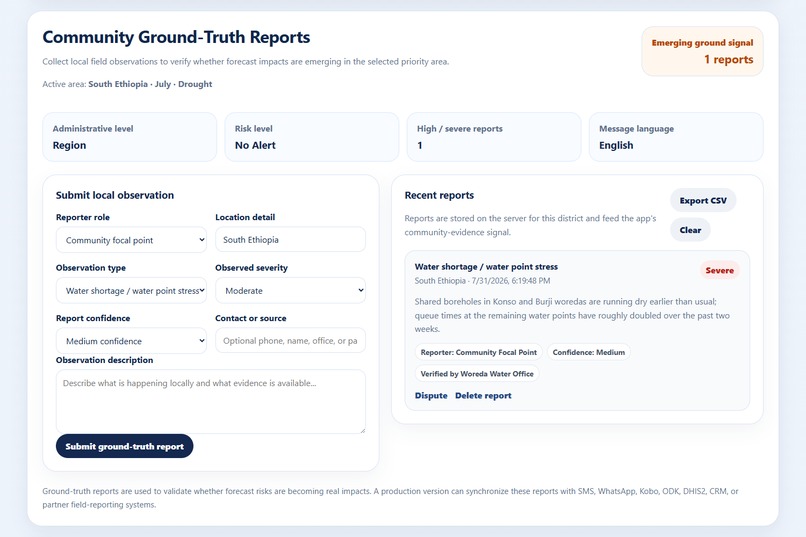
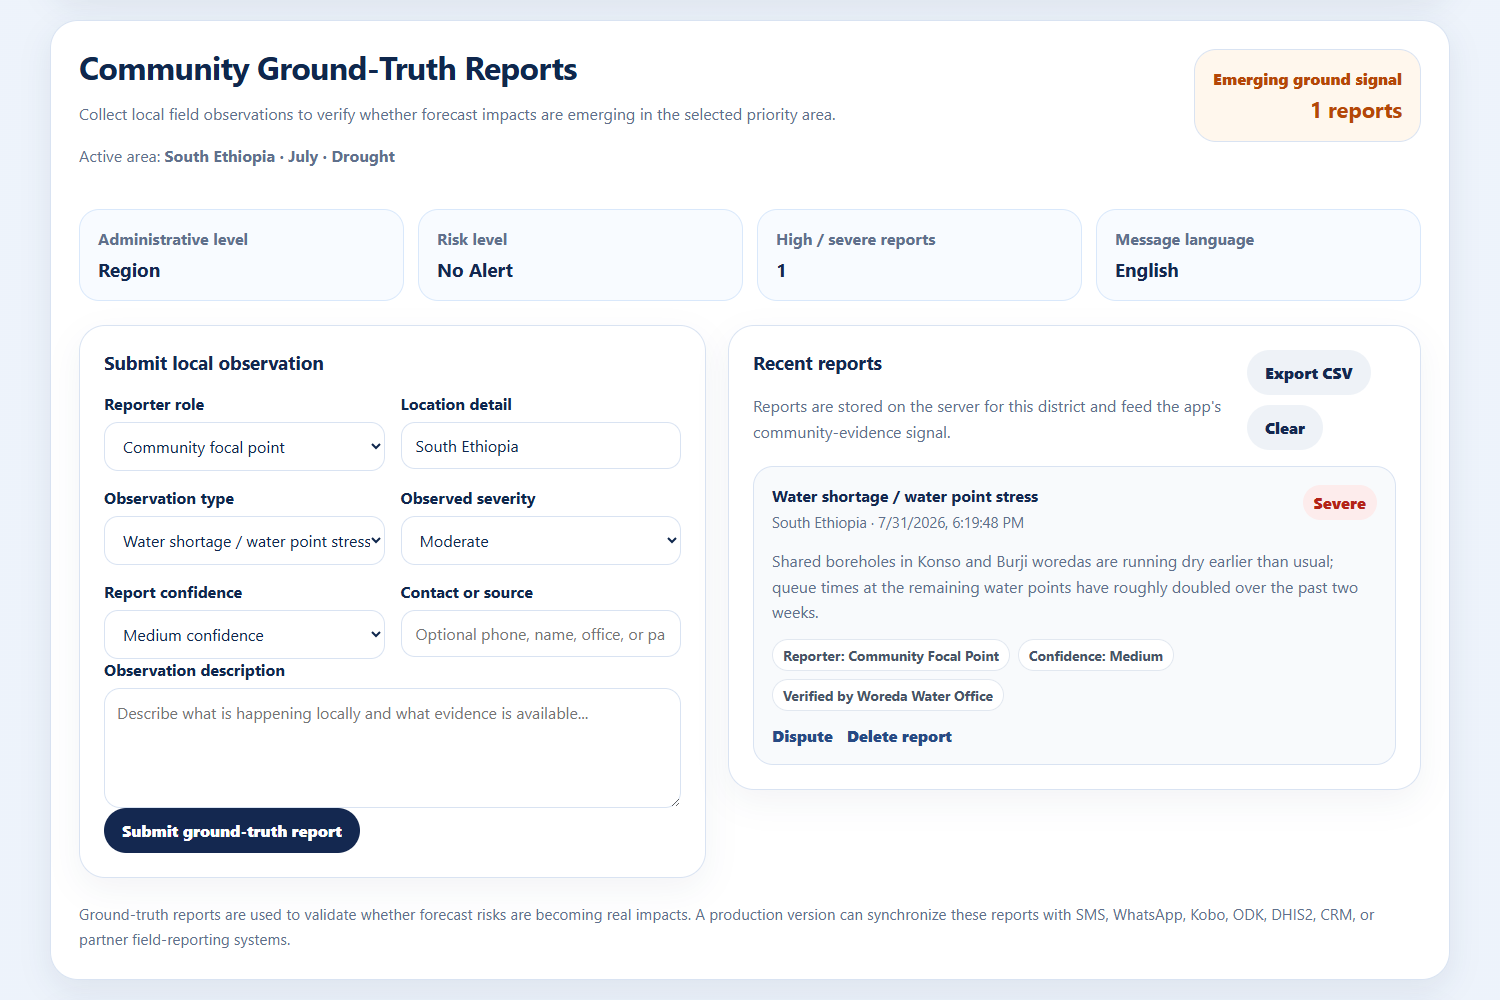
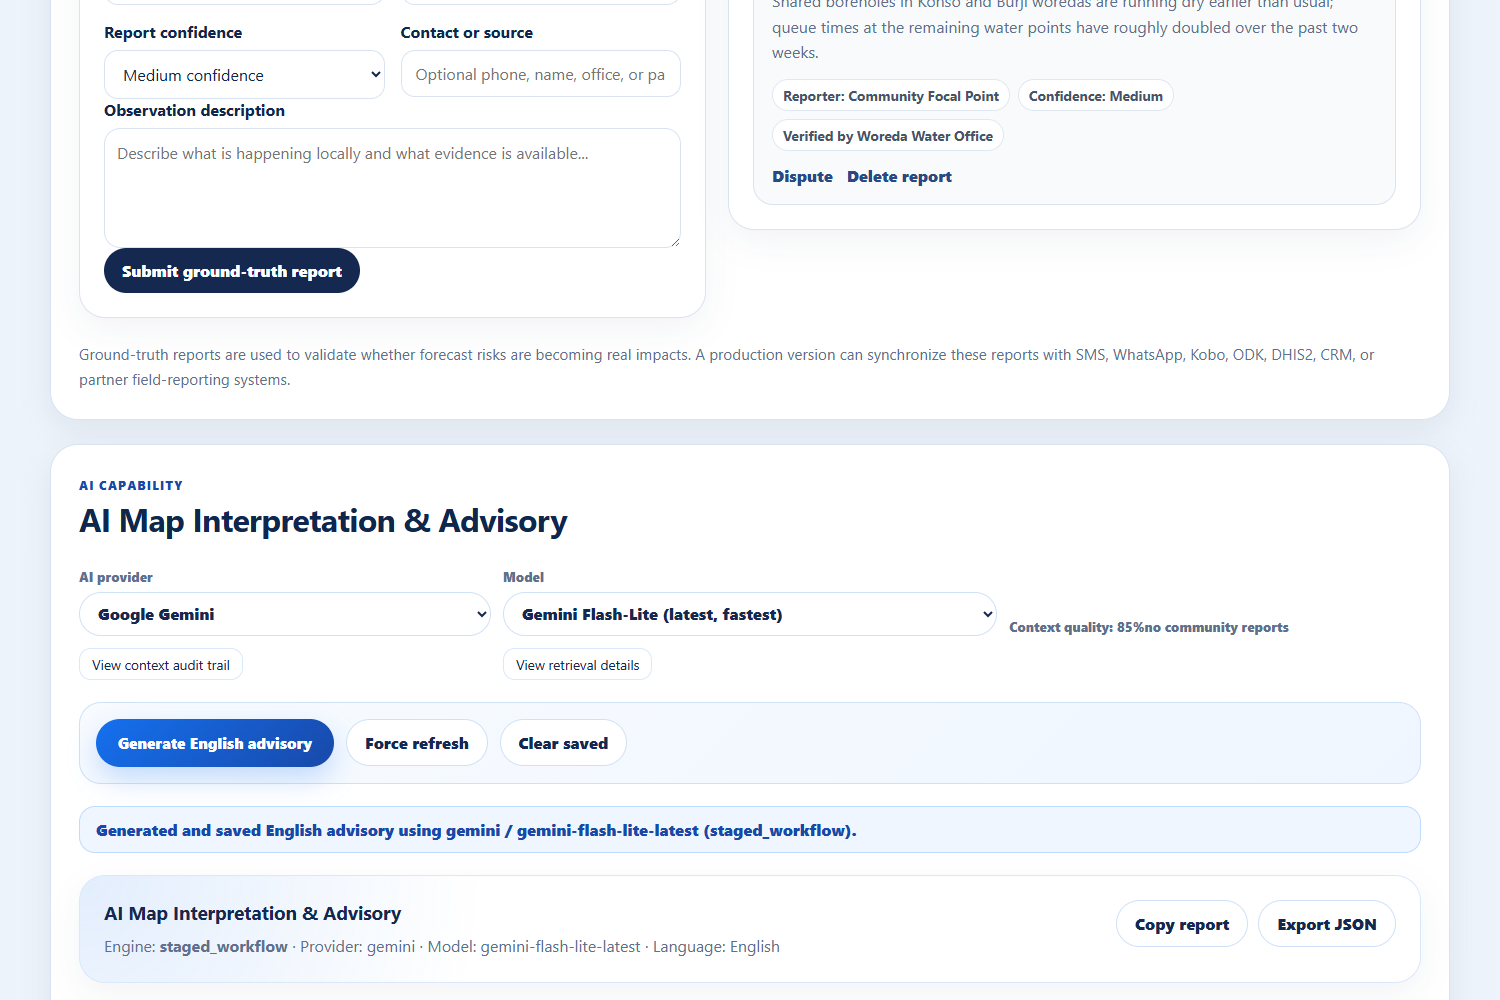
06_community_ground_truth
-
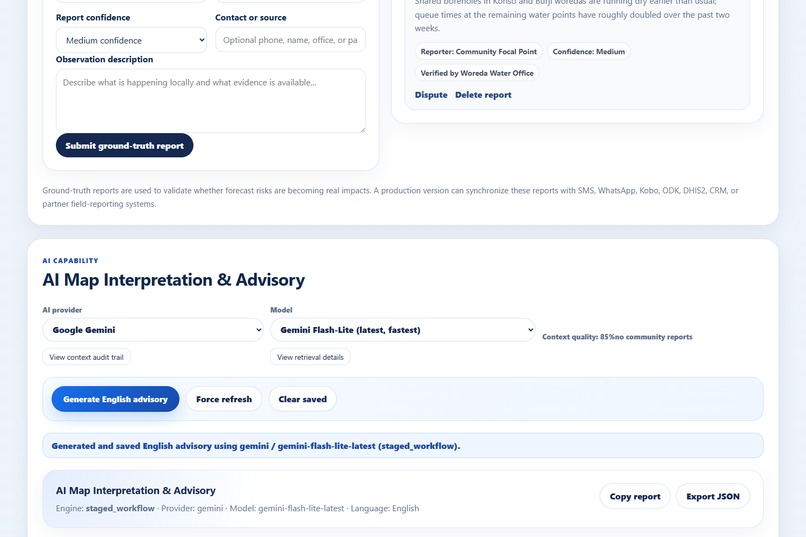
07_ai_interpretation_panel
-
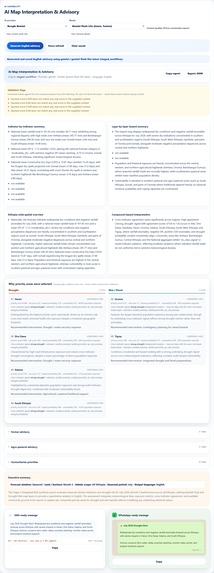
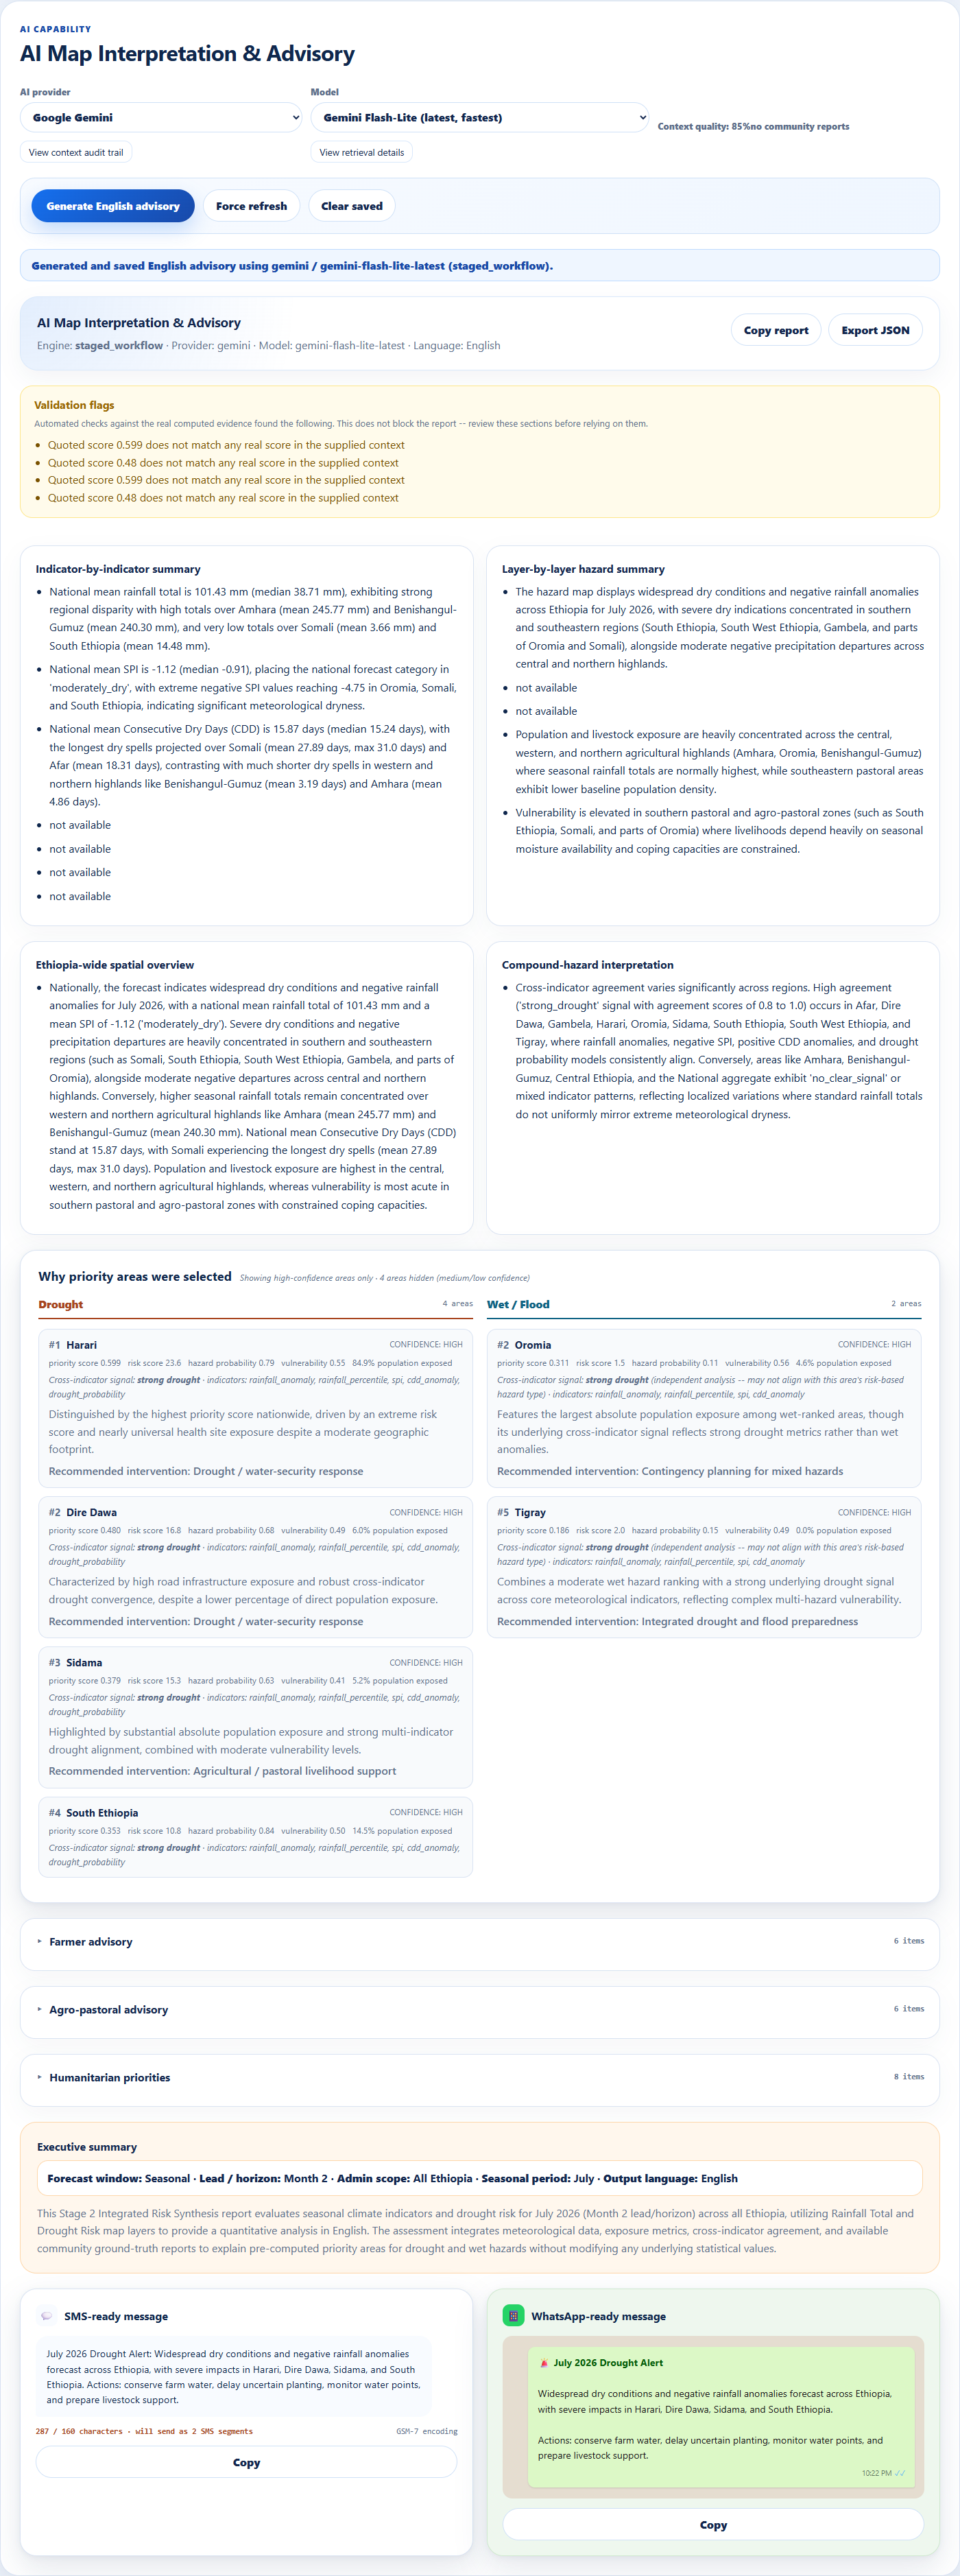
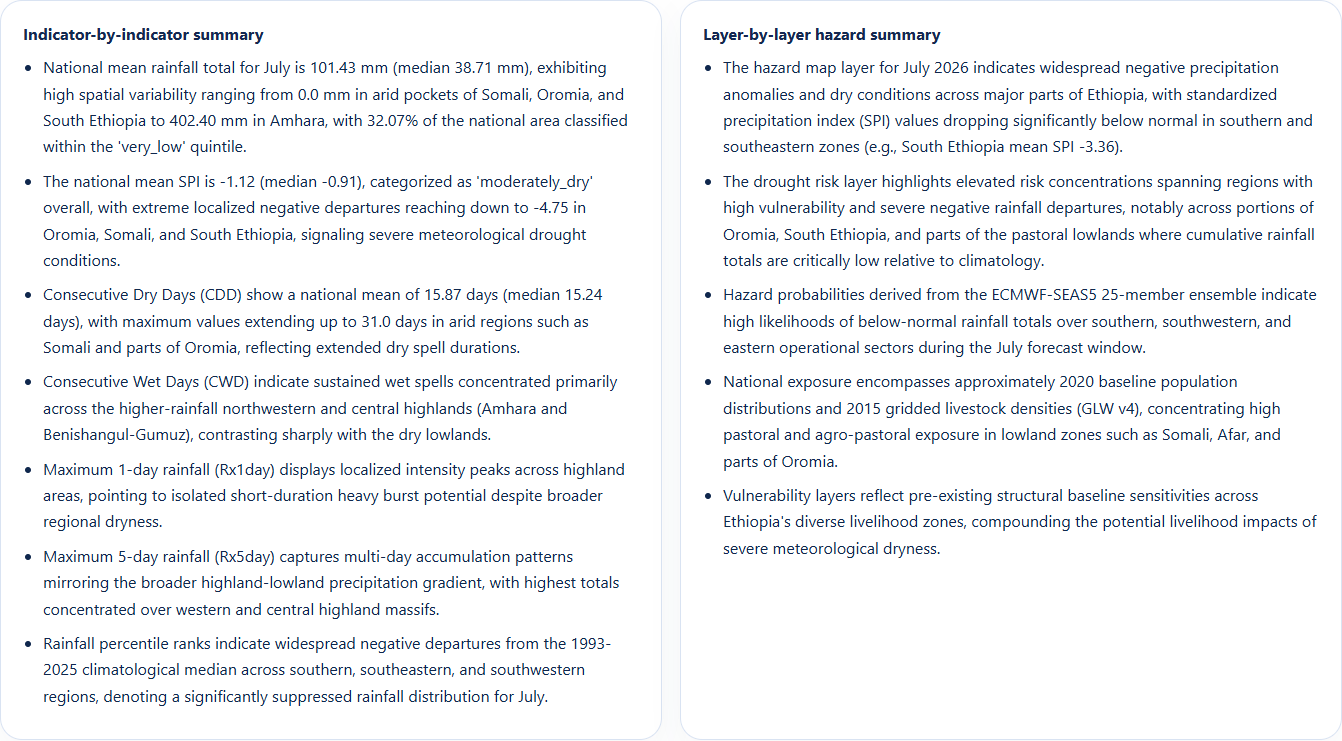
08_ai_report_content
-
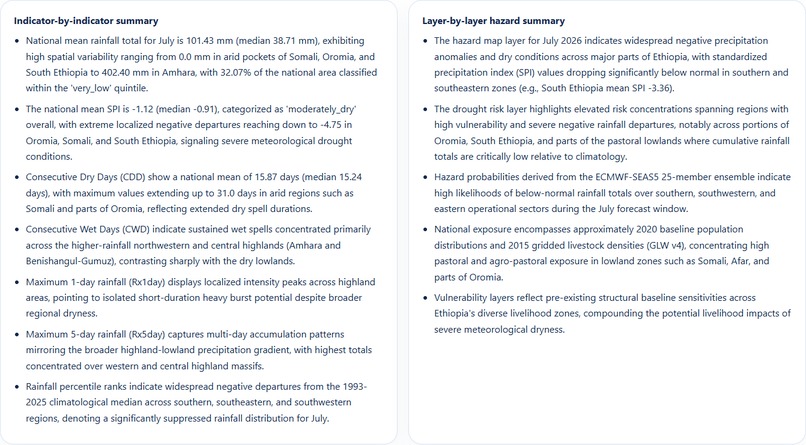
09_ai_report_summary
-
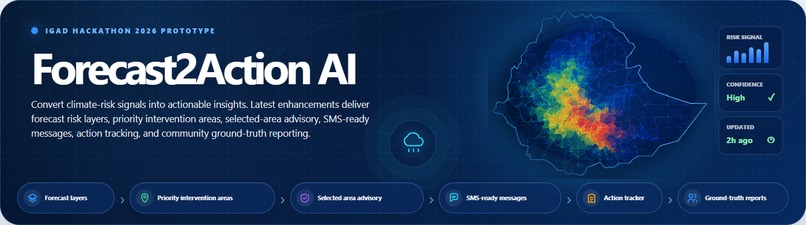
10_banner
-
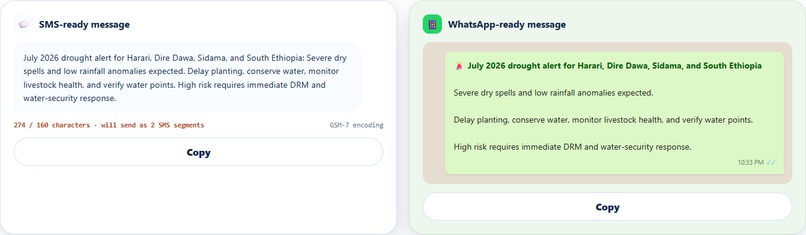
11_ai_sms_whatsapp
-
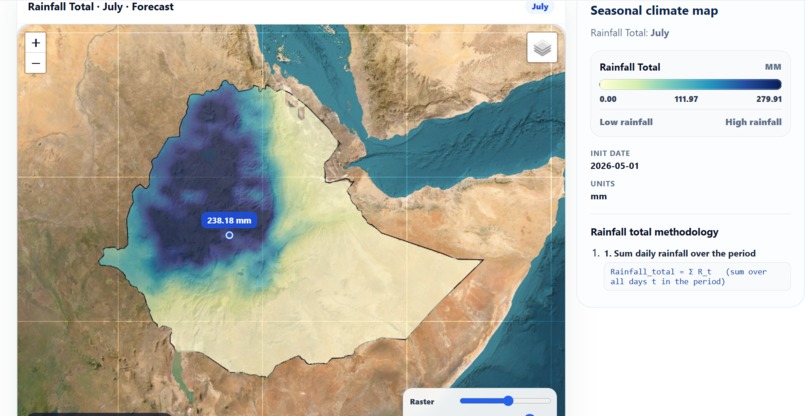
12_single_view
-
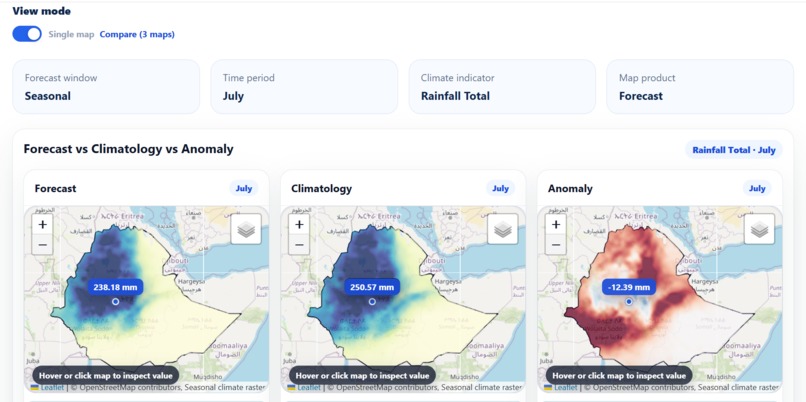
12_3mode_view
-
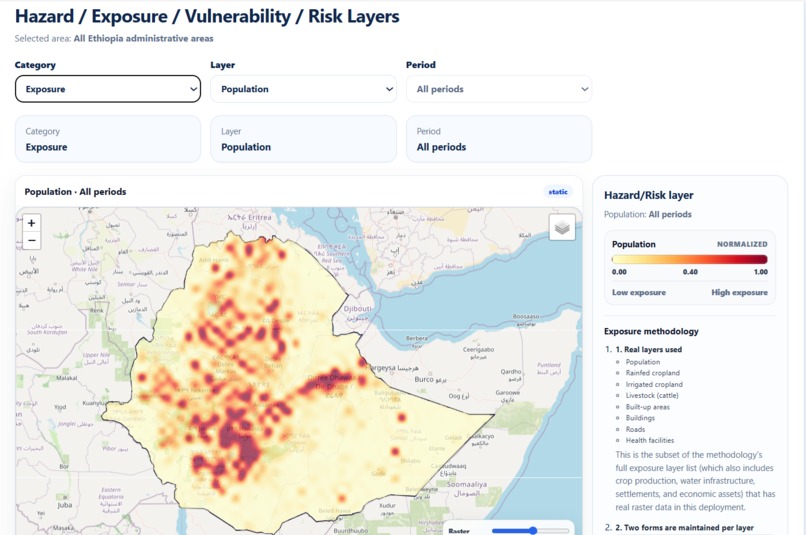
13_exposure_map
Inspiration
East Africa's IGAD region runs on a painful lag: satellites and forecast models already know a drought or flood is coming weeks out, but that signal usually reaches communities as a generic bulletin, or not at all, and it never gets checked against what's actually happening on the ground. We wanted to close that loop turn raw hydroclimatic signal into a ranked, explainable, actionable alert, and let the people living through the hazard confirm or contradict it in real time.
What it does
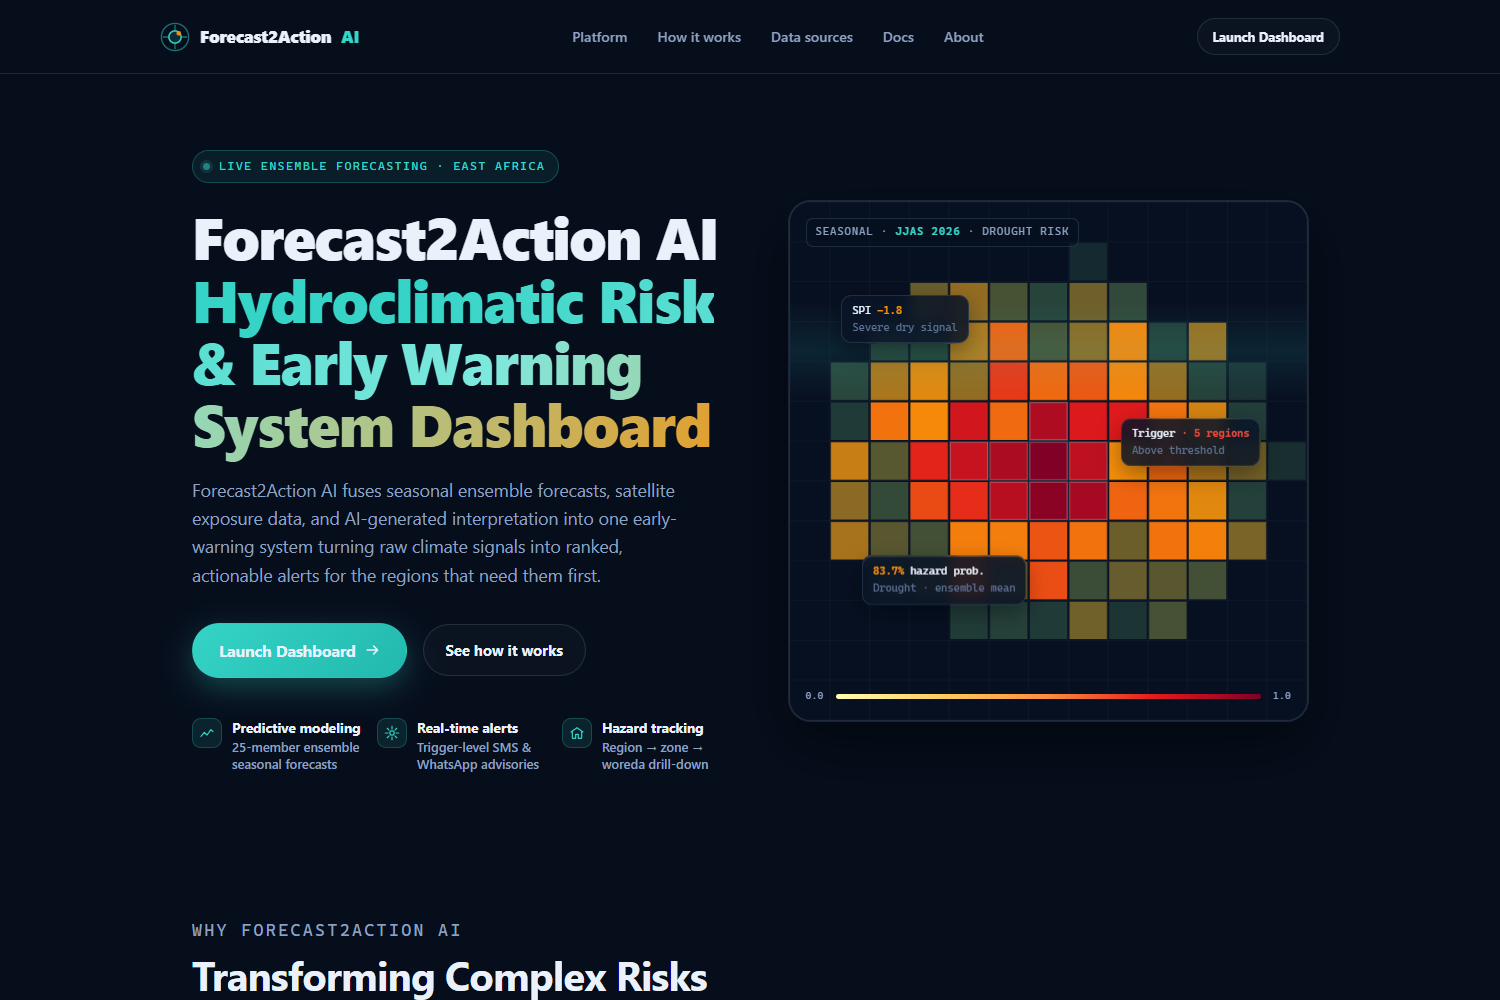
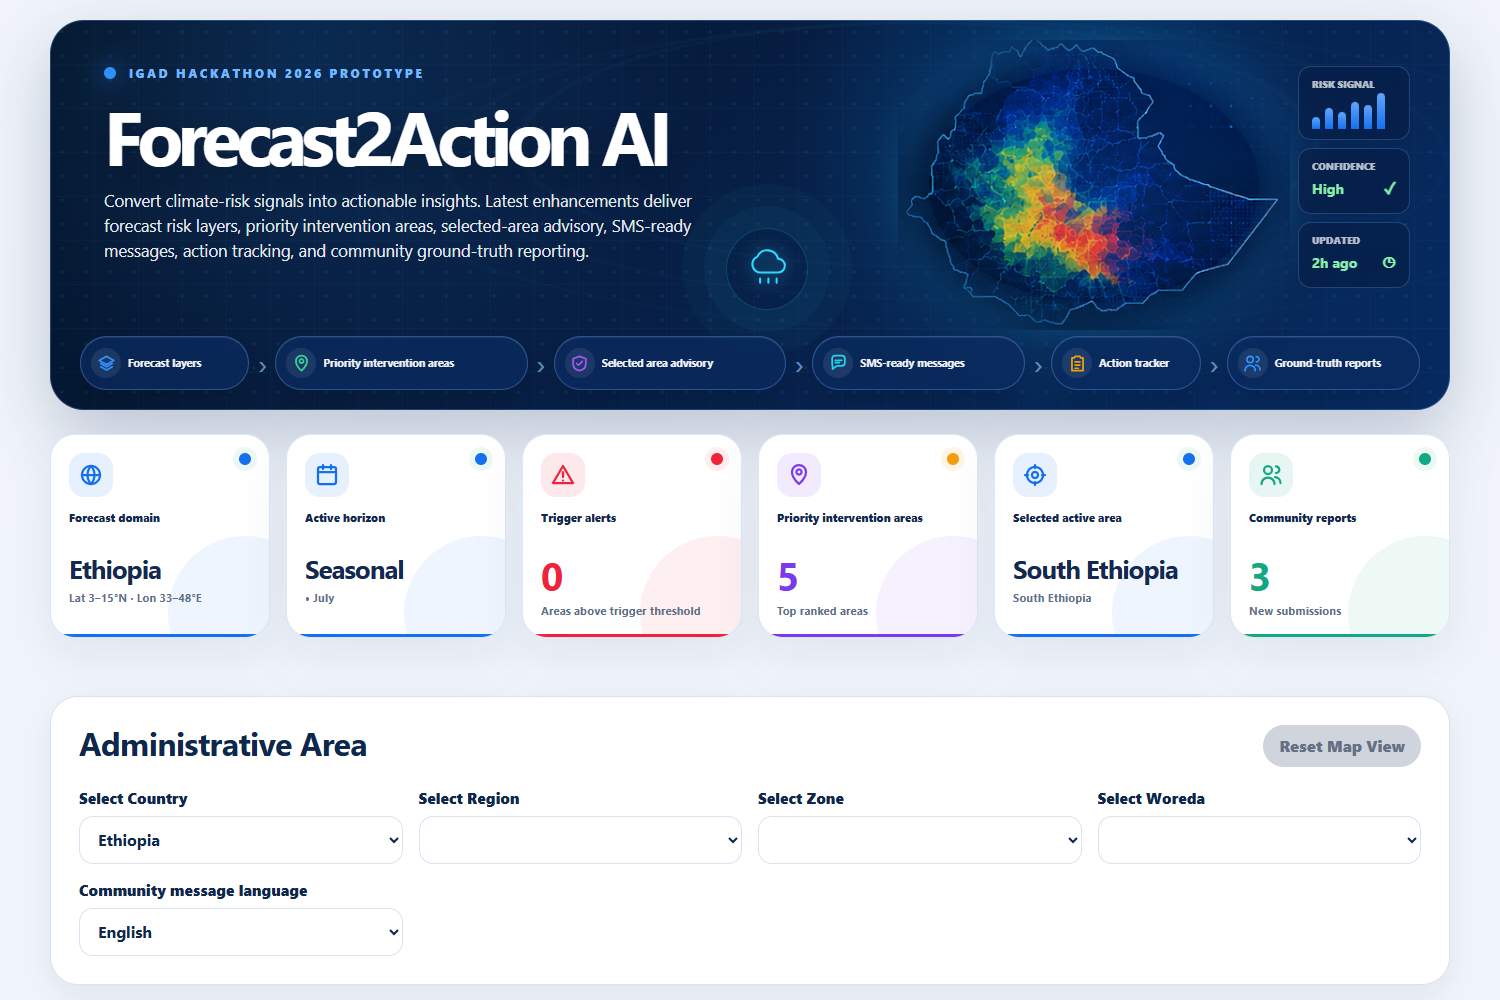
Forecast2Action AI is an early-warning dashboard for Ethiopia that:
- Ranks every region, zone, and woreda by real drought and wet-hazard risk, computed as
$$ \text{Risk} = 100 \times P \times S \times E \times V $$
(hazard Probability × Severity × Exposure × Vulnerability), not a synthetic placeholder score.
- Classifies each area into Trigger / Warning / Watch / No-alert, calibrated against that hazard's own real observed ceiling for the current period rather than a fixed theoretical maximum.
- Generates a staged AI interpretation of the map hazard evidence, then integrated risk synthesis, then translated action with every number the LLM cites pulled from real computed evidence, never invented.
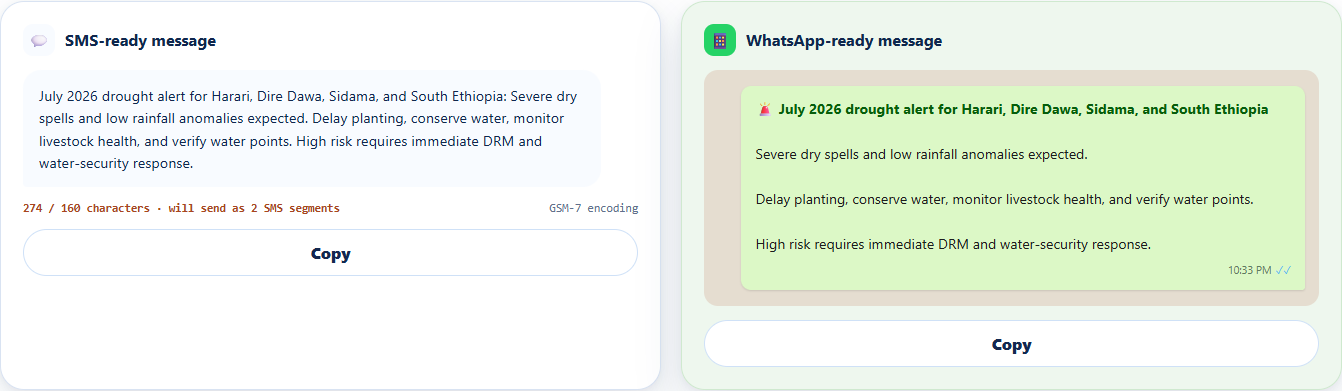
- Produces role-specific advisories (farmer, agro-pastoral, humanitarian) and SMS-ready messages sized for low-bandwidth delivery.
- Collects real community ground-truth reports (from focal points, extension workers, kebele officials, NGO partners) and feeds them back into the AI's reasoning as corroborating never fabricated evidence, with a lightweight verification workflow so a confirmed report carries more weight than an unconfirmed one.
How we built it
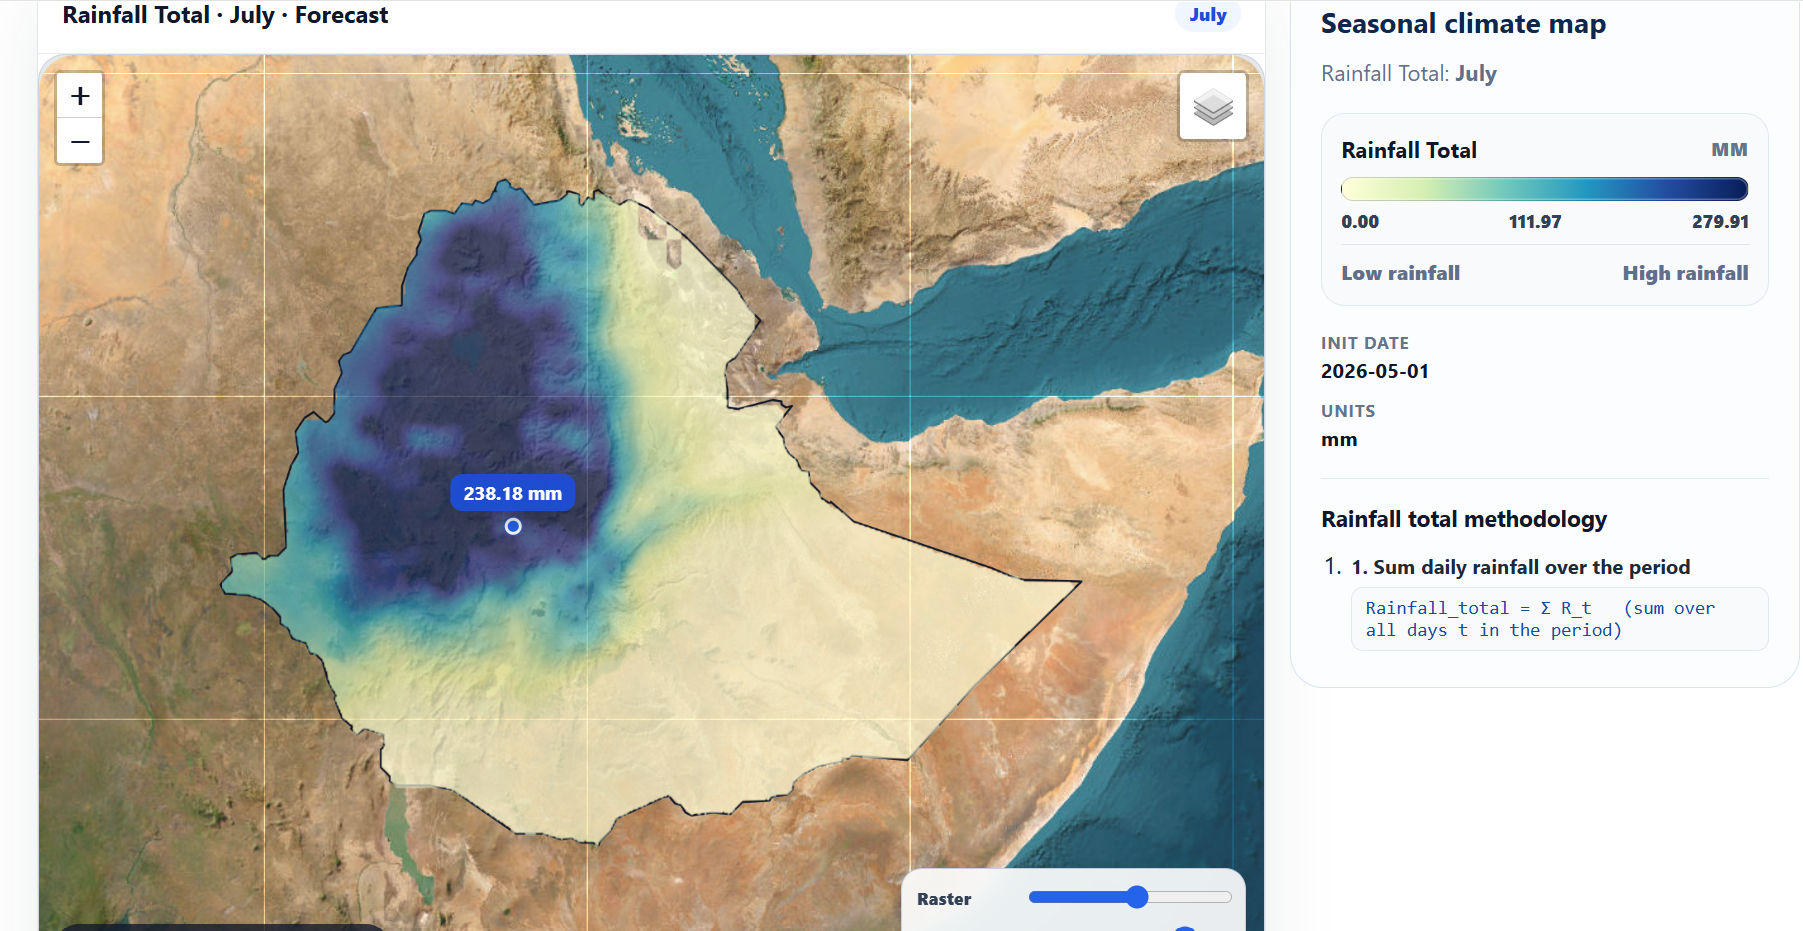
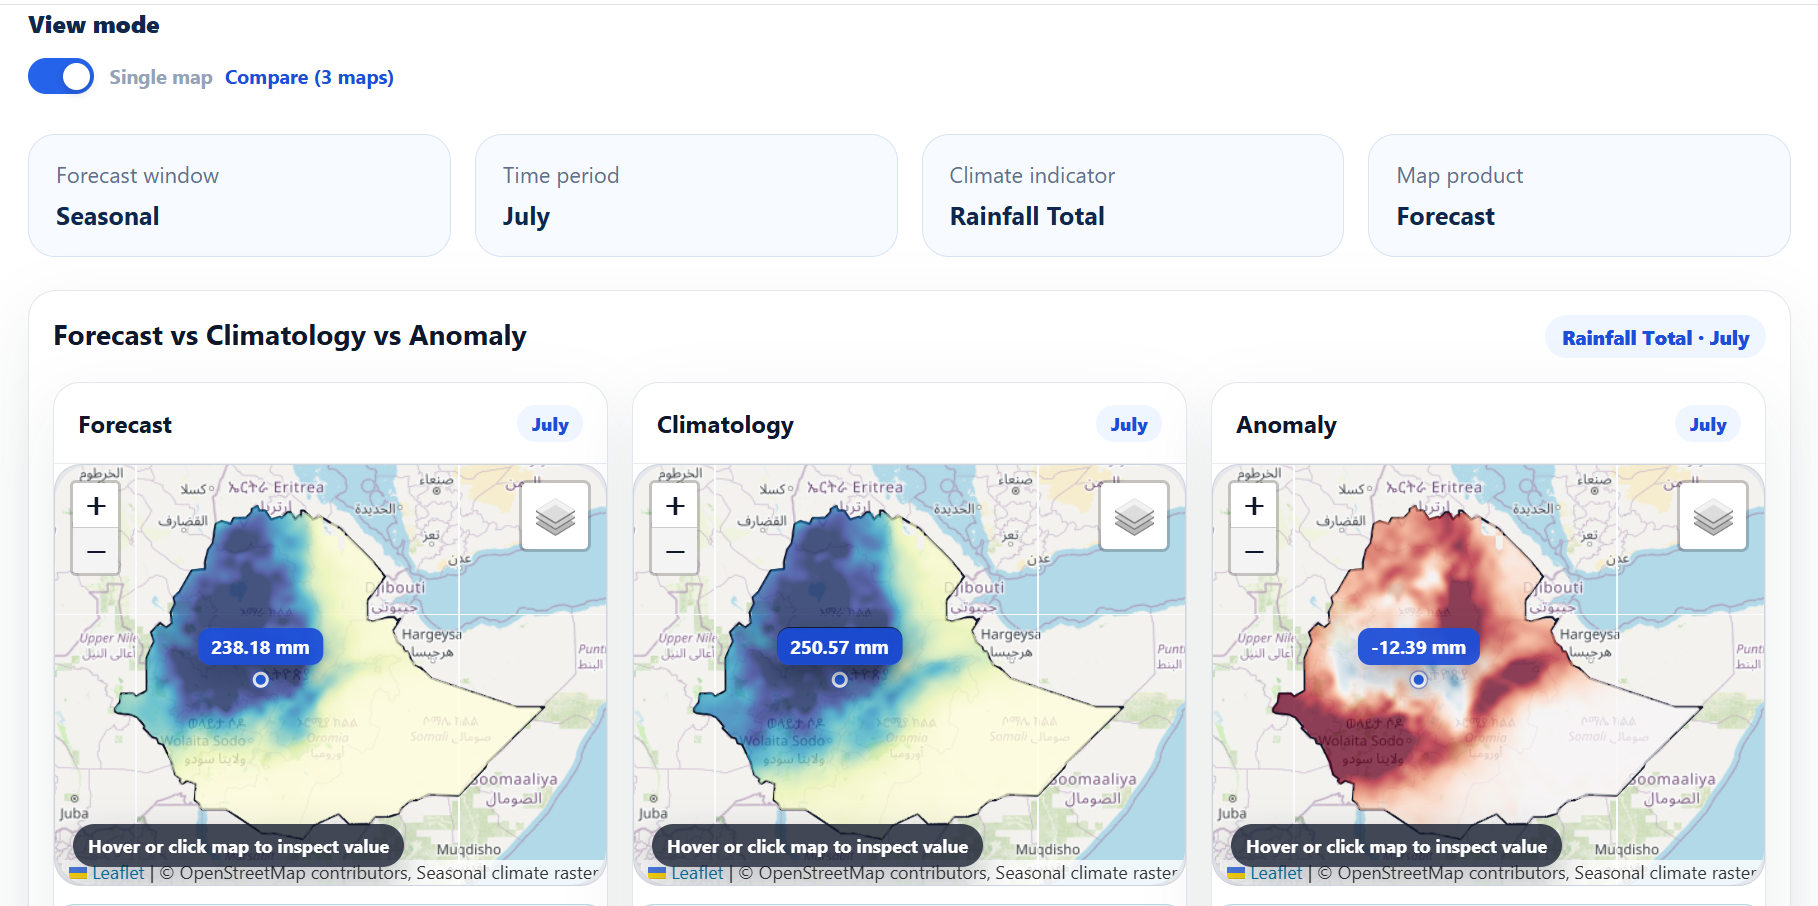
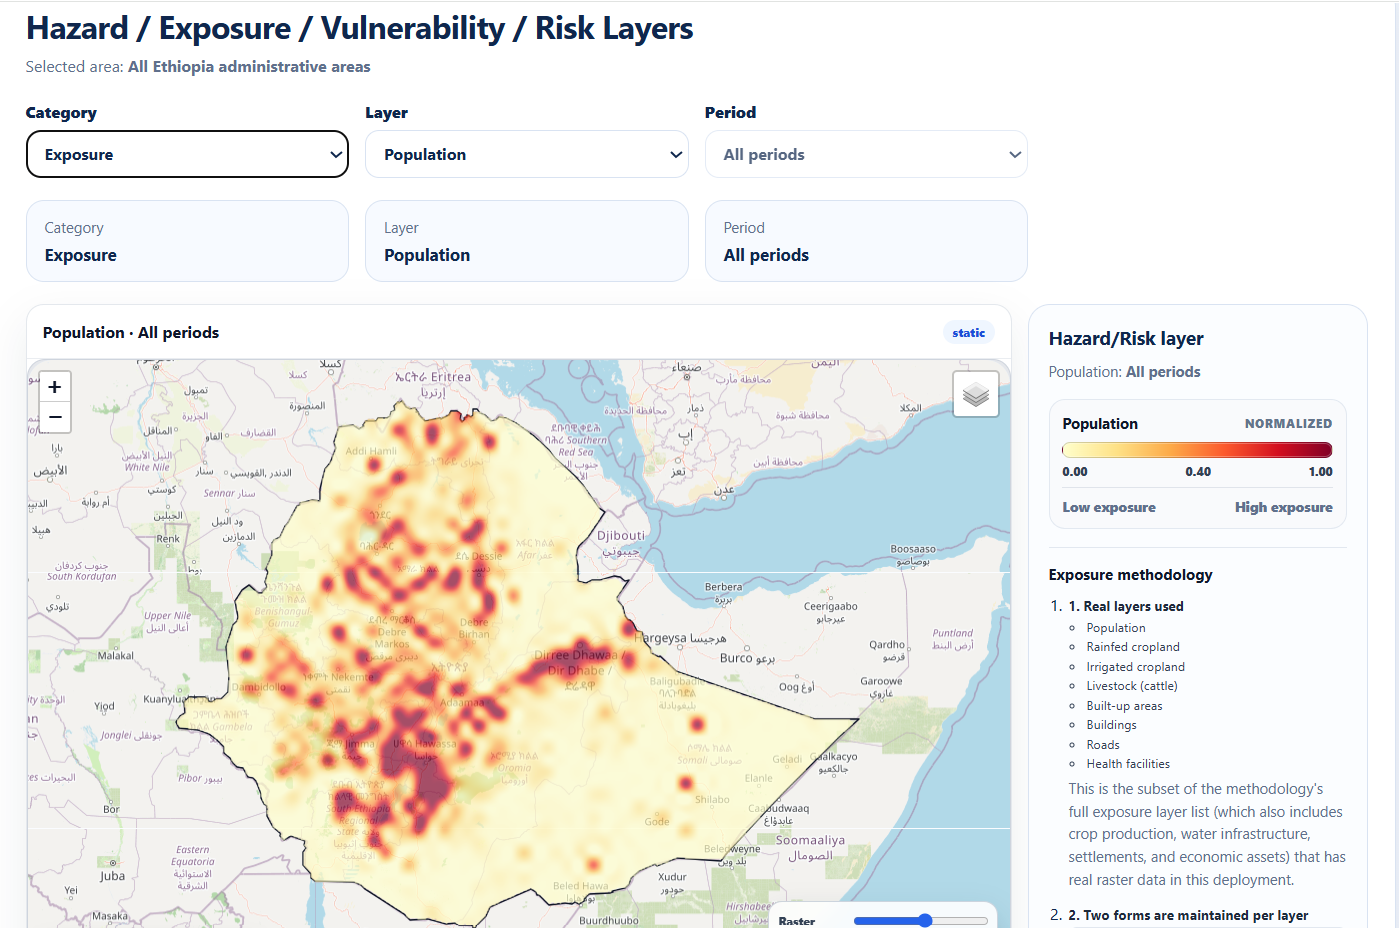
The backend (FastAPI/Python) ingests real WorldPop population, GLW4 livestock, FEWS NET IPC-derived vulnerability, and seasonal forecast rasters (rainfall, SPI, consecutive dry/wet days, rainfall percentile), and zonal-aggregates them over real admin boundary polygons for every region/zone/woreda in Ethiopia.
The AI layer is a three-stage pipeline, deliberately kept separate from the numbers:
- Stage 1 interprets each hazard layer and climate indicator on its own, area-agnostic.
- Stage 2 synthesizes cross-indicator findings and writes a per-priority-area narrative, now also given real community report evidence for that area.
- Stage 3 translates all of that into farmer/agro-pastoral/humanitarian advisories and an SMS-length summary.
Everywhere the model is allowed to write prose, its output is merged with and can never override deterministically computed values (risk scores, exposure percentages, citations, community report counts). The frontend is a React + Leaflet dashboard: an interactive risk map, a sortable priority-intervention table, a forecast-to-action advisory card, and a community reporting panel that submits straight back into the evidence the AI sees on its next run.
Challenges we ran into
- Calibrating "Trigger" on a real scale. Our drought/wet risk score is theoretically 0–100, but real nationwide severity never gets anywhere near that ceiling (the worst observed woreda topped out around 50). Reusing fixed thresholds made "Trigger" mathematically unreachable we had to calibrate cutoffs against each layer's actual observed range instead.
- Keeping the LLM honest. Free/low-cost model providers occasionally produced malformed JSON or invented plausible-sounding numbers. We solved this by never trusting the model for anything quantitative every cited statistic is computed in Python first and stitched in after generation.
- Multi-provider reality. Supporting Gemini, NVIDIA NIM, OpenRouter, and OpenAI meant hitting a different wall with each one image-count caps, tiny total context windows, per-provider token limits and building a fallback chain that degrades gracefully instead of just failing.
- Freshness vs. caching. Raster-derived evidence is expensive to compute, so we cache it but a community report submitted five minutes ago can't wait for the next cache rebuild. We had to explicitly keep the community-evidence path uncached while everything else stays cached.
Accomplishments that we're proud of
Every number on the dashboard population exposed, area extent, risk score, trigger level traces back to a real dataset, not a mock. The AI narrative is grounded the same way: it can say "corroborated by 3 community reports of pasture stress," and that claim is true, because it was computed, not generated.
What we learned
The hardest part of "AI for early warning" isn't getting a model to write a plausible-sounding advisory it's making sure every plausible-sounding sentence is also a true one. Treating the LLM purely as a narrator over deterministic evidence, rather than a source of truth, made that possible.
What's next for Forecast2Action AI
Expanding the verification workflow so trusted field partners can carry more weight in the risk classification itself, adding semantic retrieval over historical advisories, and extending the same architecture to the rest of the IGAD region beyond Ethiopia.
Built With
- css3
- fastapi
- fews-net
- geojson
- geospatial-analysis
- glw4
- google-gemini
- groq
- javascript
- leaflet.js
- machine-learning
- numpy
- nvidia-nim
- openai
- openrouter
- openstreetmap
- pandas
- pydantic
- python
- rasterio
- react
- react-leaflet
- scipy
- vite
- worldpop

Log in or sign up for Devpost to join the conversation.