-
-
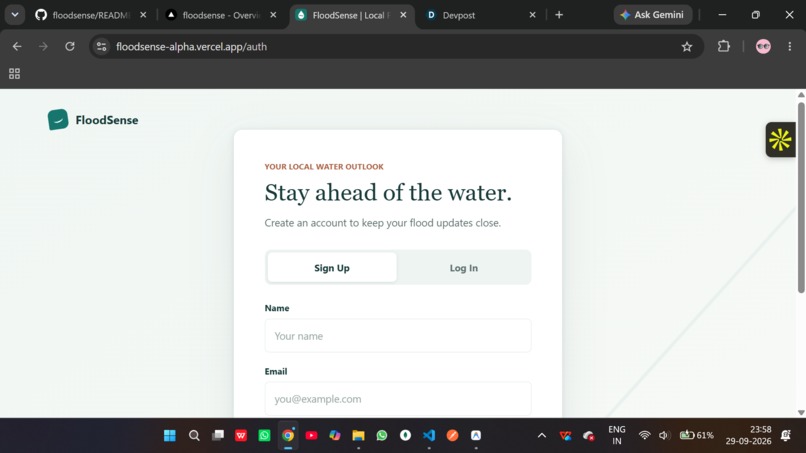
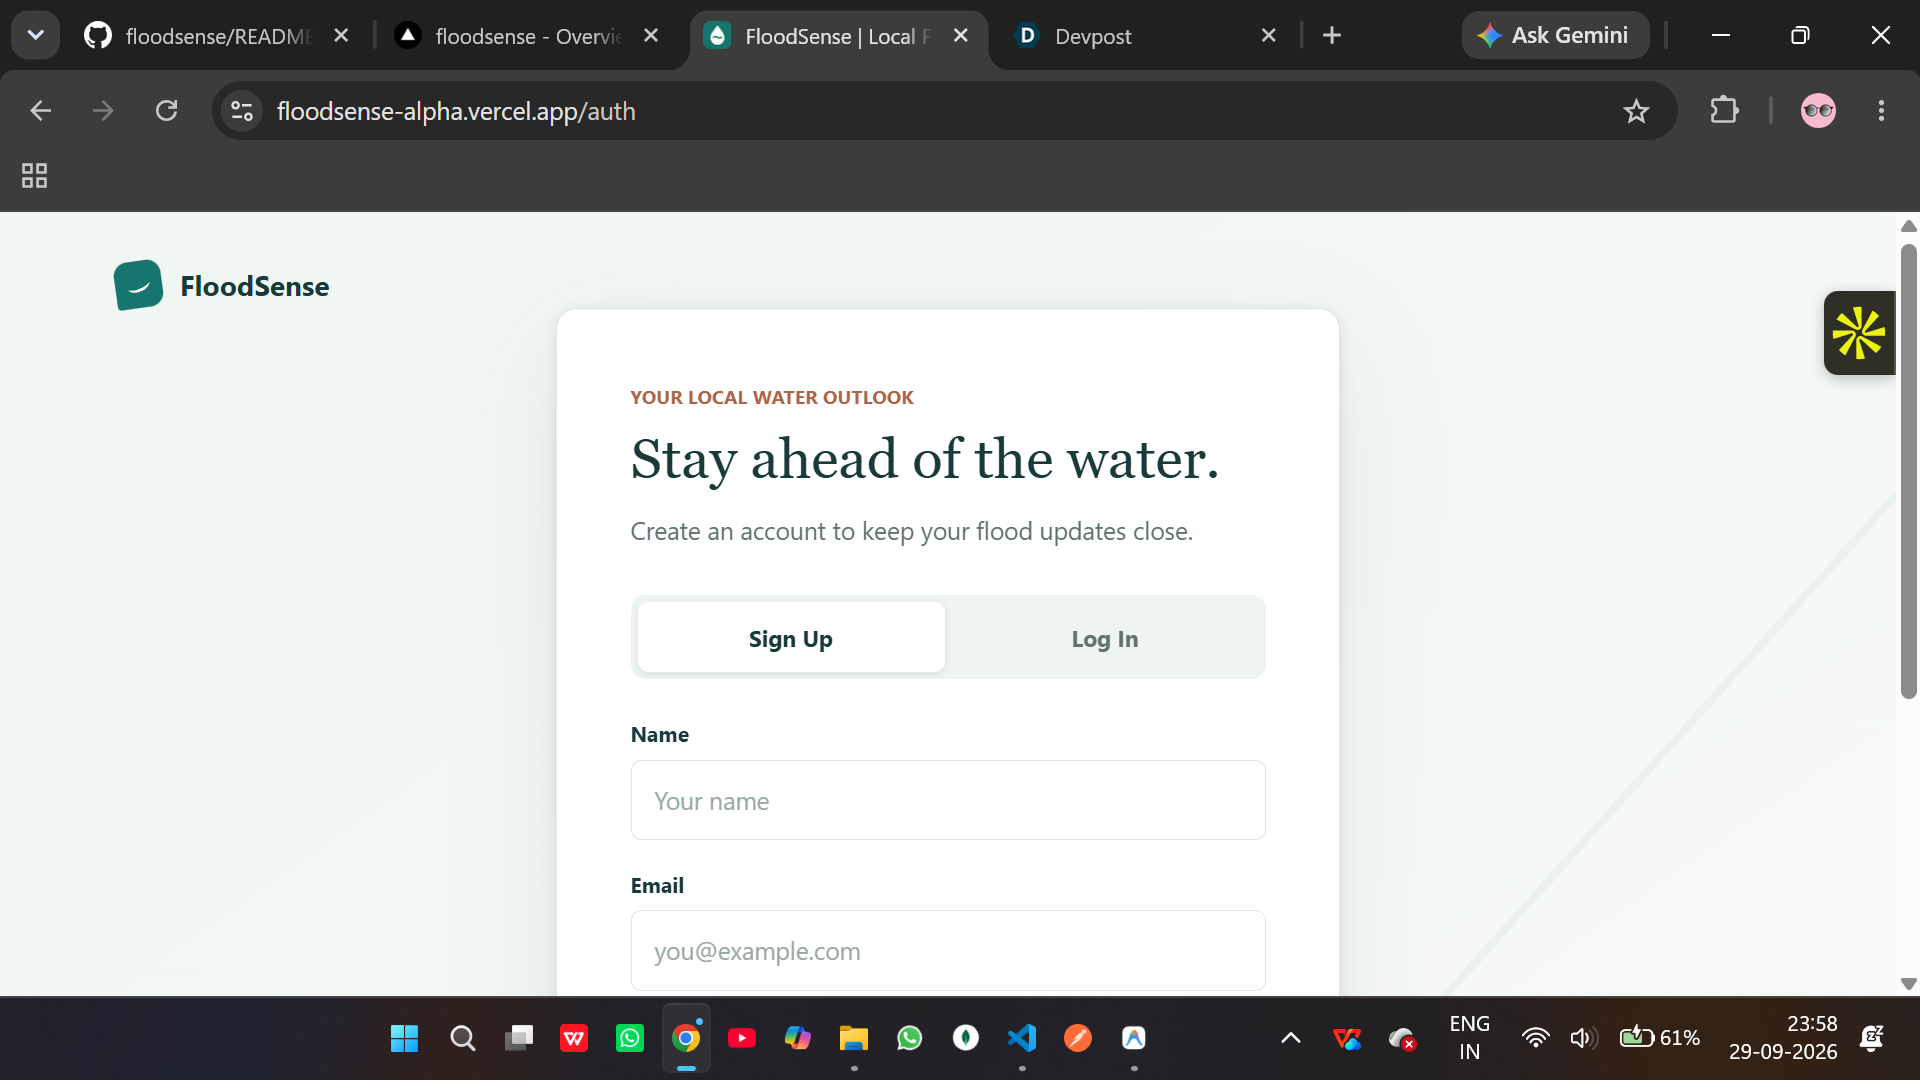
SignUp/LogIn Page of Floodsense
-
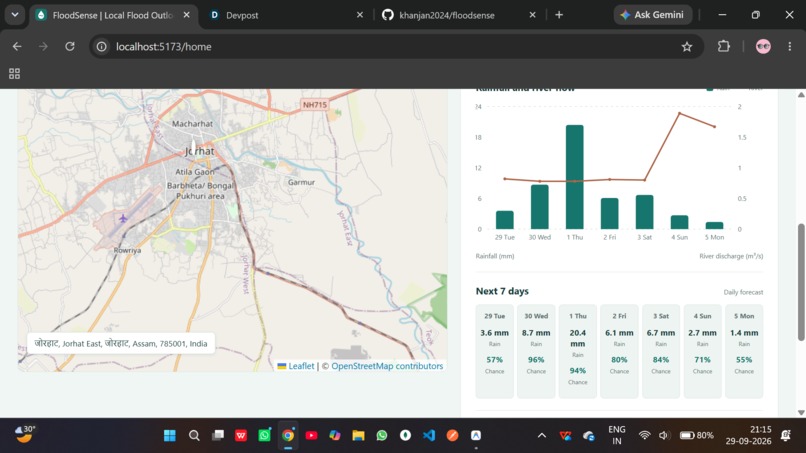
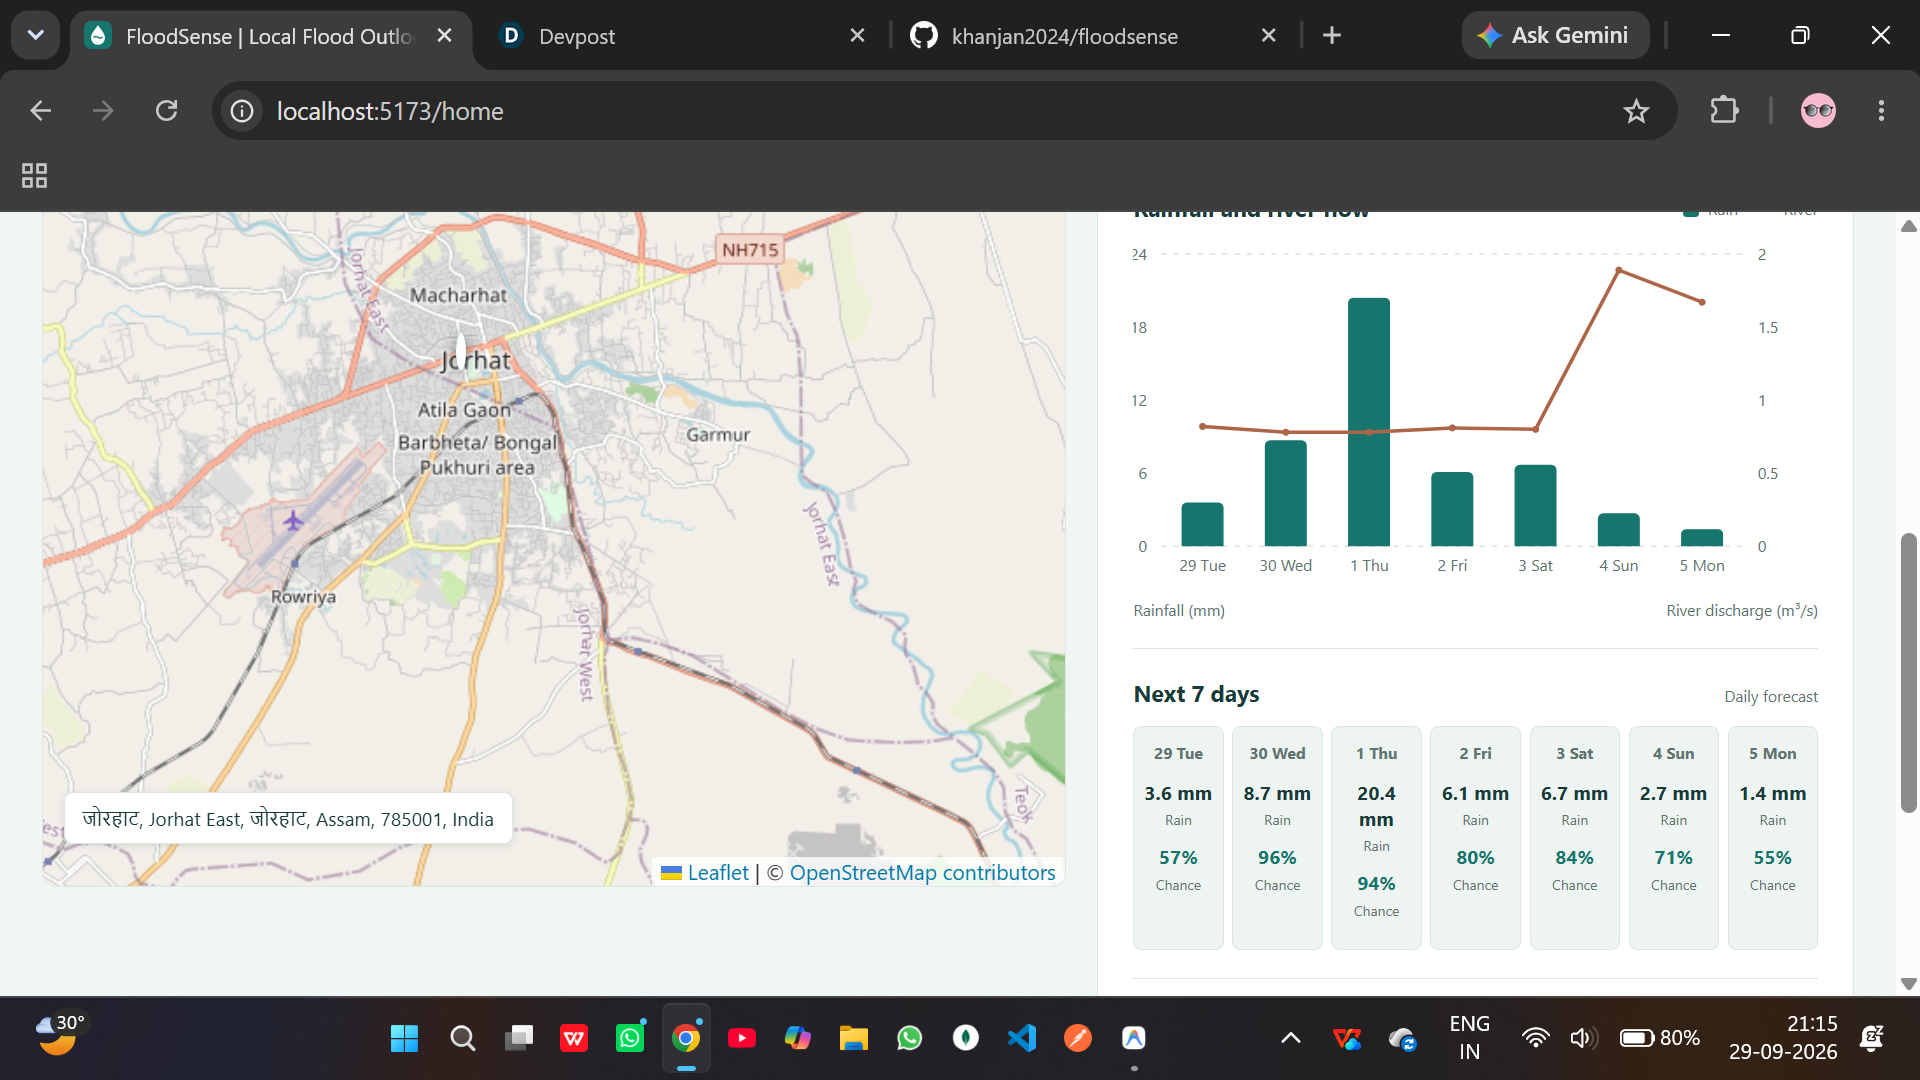
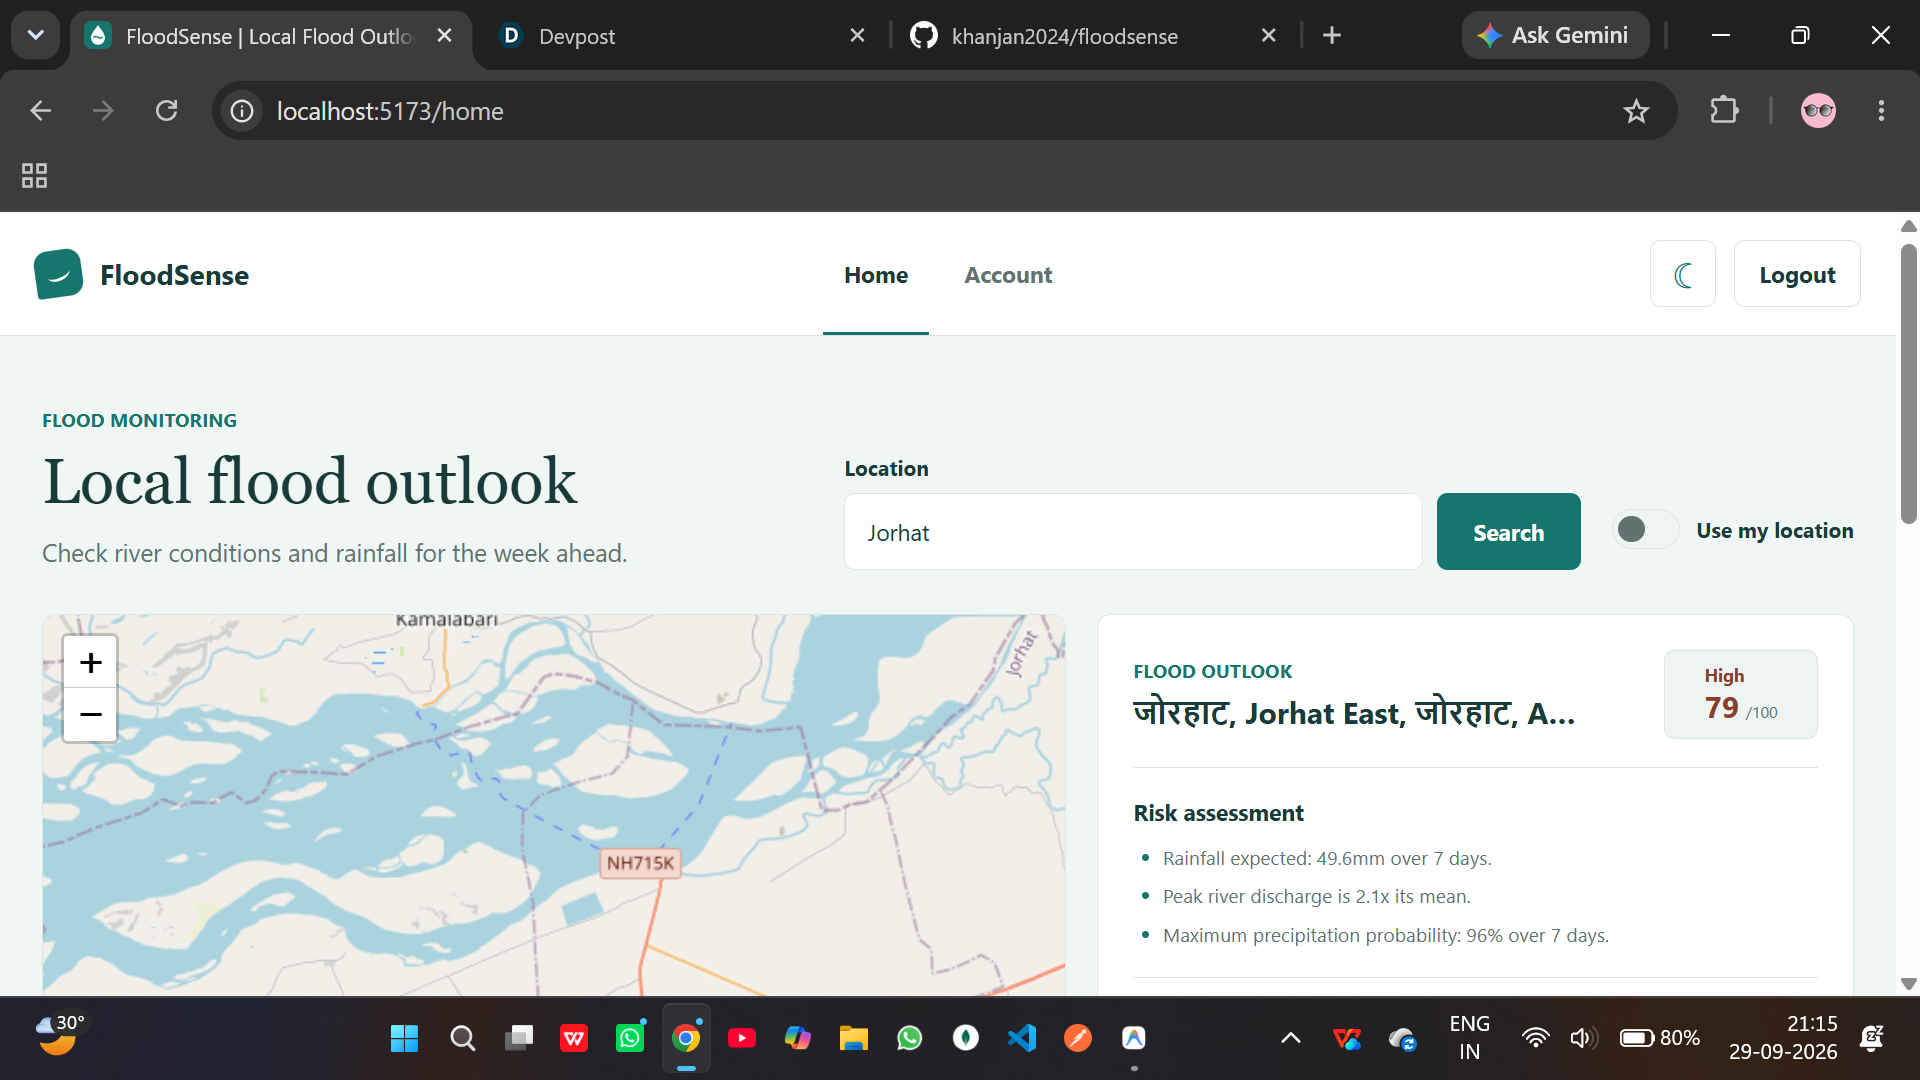
FloodSense Map view of location
-
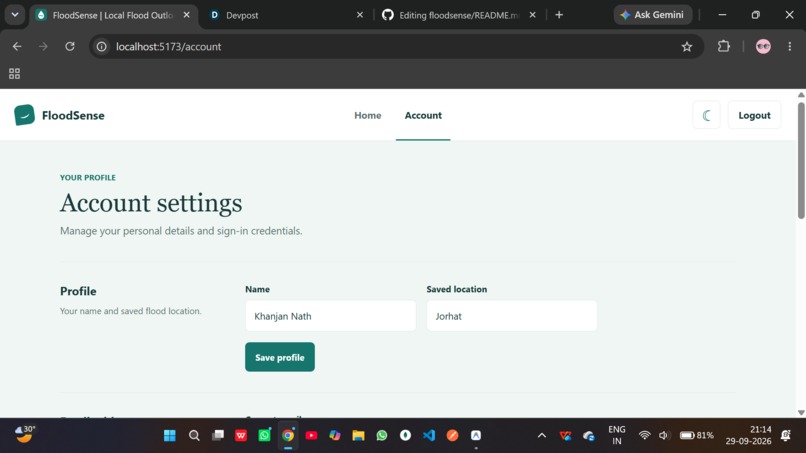
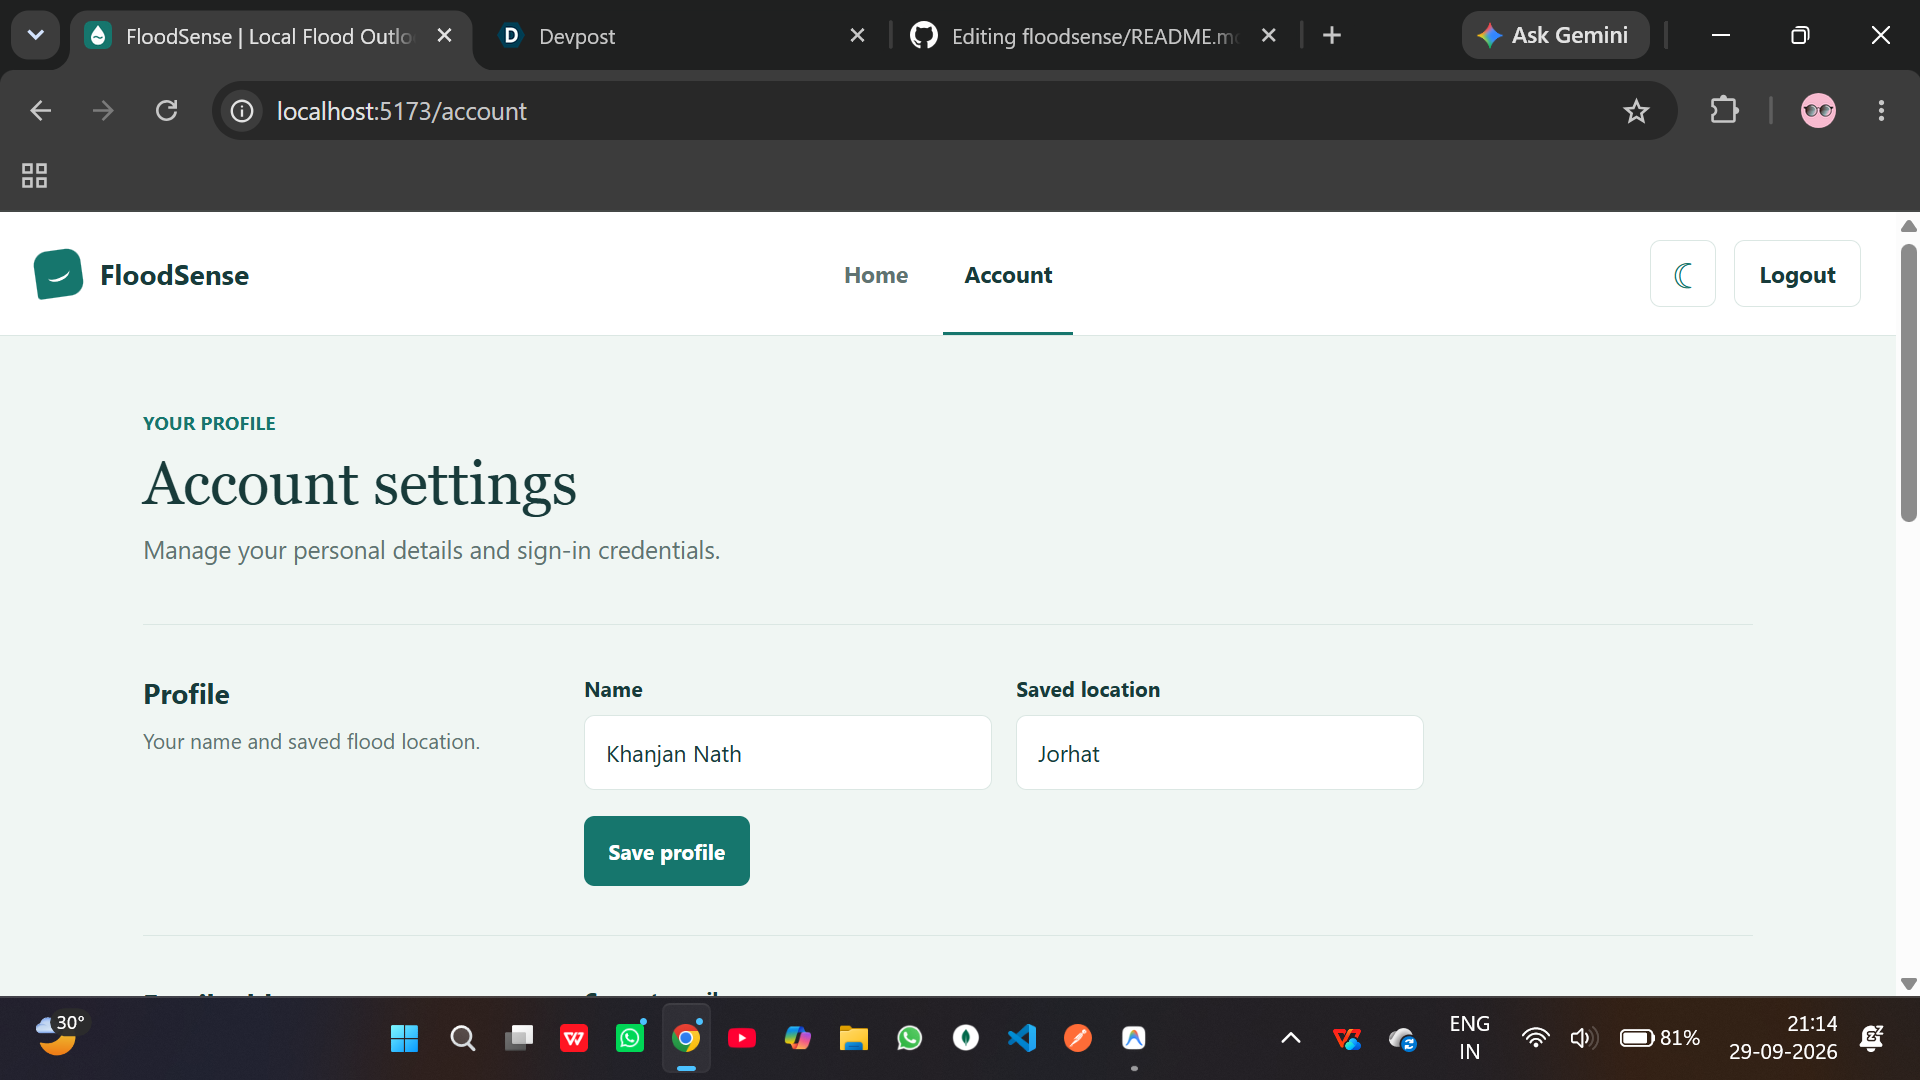
Floodsense Account settings
-
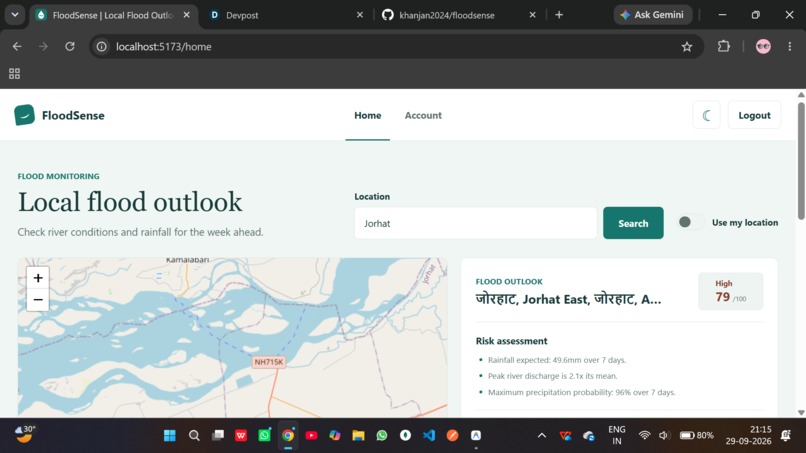
Floodsense Home Screen
-
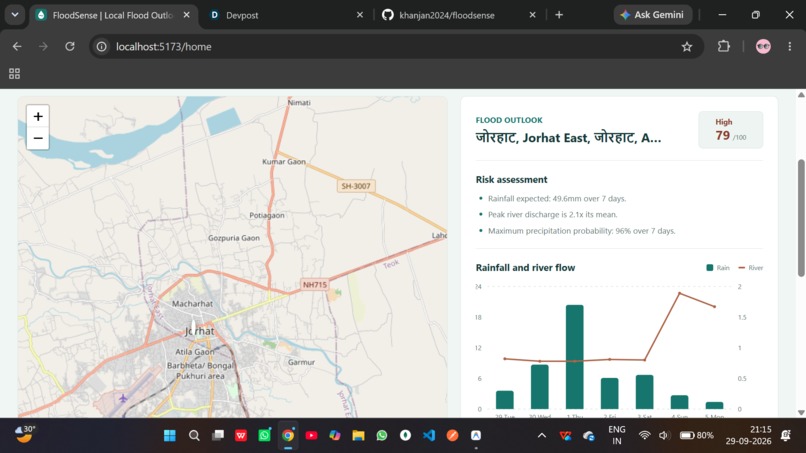
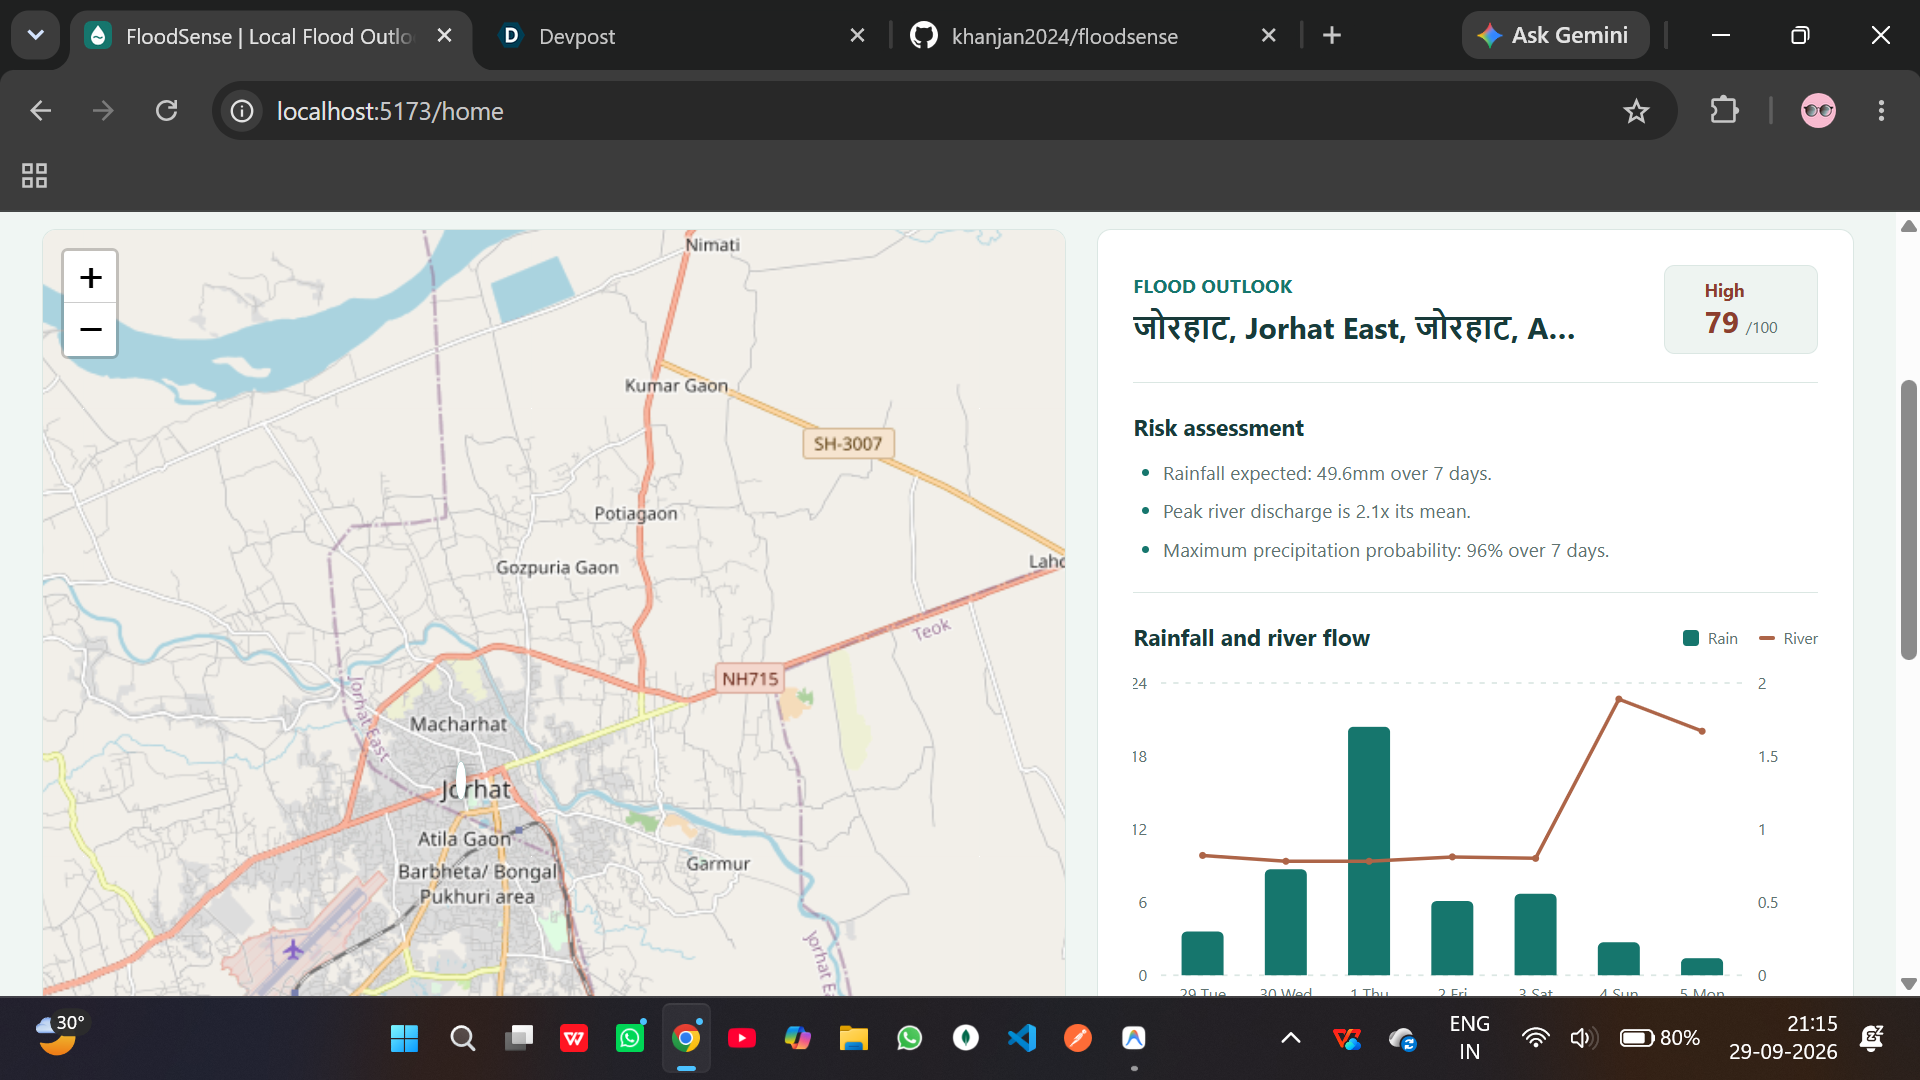
Floodsense Chart
Inspiration
Every monsoon season, torrential rain and swelling river basins across the Brahmaputra and Barak river networks trigger catastrophic flooding across Assam and Northeast India. Millions of people are displaced, essential transport links are severed, and families lose their homes, livestock, and livelihoods overnight.
Despite the recurring nature of these disasters, everyday residents and grassroots volunteers are left navigating two extremes:
- Oversimplified, regional advisories: General alerts issued at a broad district level that miss localized village-level surges.
- Impenetrable hydrological telemetry: Raw cubic-meters-per-second ((m^3/s)) discharge metrics and millimetric rain charts that are difficult for families to convert into urgent, actionable decisions.
We built FloodSense to democratize flood intelligence. Our mission is to bridge complex environmental data and everyday human action—giving families, farmers, and community leaders an intuitive 0–100 Flood Risk Score, visual 7-day outlooks, and clear safety checklists before floodwaters begin to rise.
🌊 What It Does
FloodSense is a hyper-local early warning and flood intelligence platform:
- 📍 Hyper-Local Search & Auto-Geolocation: Search any city, town, or village via OpenStreetMap Nominatim geocoding, or use single-tap device geolocation.
- 🧮 Explainable 0–100 Flood Risk Score: Synthesizes weather and river discharge forecasts into distinct risk tiers (Low, Moderate, High) accompanied by transparent, plain-language diagnostics (e.g., "Peak river discharge is 2.1x seasonal mean").
- 📊 Dual-Axis Hydrological Telemetry Charts: Interactive Recharts visualizations overlaying daily forecasted rainfall bars ((mm)) against river discharge trendlines ((m^3/s)).
- 🗺️ Interactive Geospatial Map: Dynamic Leaflet maps pinpointing the user's location against regional hydrology.
- 🛡️ Stage-Specific Safety Action Plans: Practical, step-by-step emergency instructions tailored to the calculated risk level (elevating grain stores, preparing go-bags, locating high-ground relief centers) aligned with disaster management guidelines (such as ASDMA protocols).
- 👤 Cloud-Synced Profiles & Preferences: Firebase Authentication and Cloud Firestore enable users to save their vulnerable home base and persist light/dark theme preferences across devices.
🛠️ How We Built It
We designed FloodSense with an emphasis on low-latency loading, high visual clarity, and accessible design:
1. Frontend & Visualizations
- React 19 & Vite 8: High-performance, modern single-page application architecture.
- Recharts: Composed charts with synchronized dual axes to display rainfall ((mm)) and river volume ((m^3/s)) on the same timeline.
- Leaflet & React-Leaflet: Lightweight, mobile-friendly interactive mapping powered by OpenStreetMap tiles.
- Design System: Custom CSS tokens supporting immediate, flicker-free light and dark mode toggling.
2. Environmental & Geospatial Data Pipeline
- Open-Meteo Flood API: Ingests live river discharge simulations powered by the Global Flood Awareness System (GloFAS).
- Open-Meteo Forecast API: Retrieves 7-day cumulative precipitation and daily probability data.
- Nominatim Geocoding API: Powers fuzzy location searching with built-in token debouncing.
3. Cloud Backend & Persistence
- Firebase Auth: Handles secure user authentication (email/password).
- Cloud Firestore: Persists default locations, coordinates, and theme preferences per user.
🧮 The Scoring Model & Formula
FloodSense computes a composite risk score on a scale from (0) to (100), evaluating total 7-day precipitation, river discharge surge ratio, and maximum rain probability:
$$ \text{Score} = \left(\min\left(\frac{\text{Precip}}{100}, 1\right) \times W_{\text{precip}}\right) + \left(\min\left(\frac{\text{Discharge Ratio}}{2.0}, 1\right) \times W_{\text{discharge}}\right) + \left(\min\left(\frac{\text{Prob}}{100}, 1\right) \times W_{\text{prob}}\right) $$
Where standard sensor weights are:
- (W_{\text{precip}} = 40\%) (normalized to a (100\text{ mm}) 7-day threshold)
- (W_{\text{discharge}} = 40\%) (normalized to a (2.0\times) surge over seasonal baseline)
- (W_{\text{prob}} = 20\%) (normalized to (100\%) rain probability)
Dynamic Weight Redistribution (Handling Missing River Data)
In elevated terrain or areas distant from mapped river branches, river telemetry may be absent. Instead of giving users a false sense of security with a deflated score, FloodSense dynamically redistributes the (40\%) river discharge weight proportionally:
$$ W_{\text{precip}}^{\prime} = 40 + \left(40 \times \frac{40}{40 + 20}\right) \approx 66.7\% $$
$$ W_{\text{prob}}^{\prime} = 20 + \left(40 \times \frac{20}{40 + 20}\right) \approx 33.3\% $$
⚡ Challenges We Ran Into
- Temporal & Spatial Telemetry Synchronization: The GloFAS river discharge model outputs forecasts on a coarse geospatial hydrological grid, whereas weather forecasts operate on high-resolution atmospheric models. Aligning these two asynchronous streams into a unified 7-day timeline required custom normalization logic.
- Defensive Scoring for Data-Sparse Basins: Many vulnerable rural communities do not have river gauge stations immediately adjacent to them. A naïve scoring system would register zero river flow and falsely report low flood risk. Developing our proportional weight-redistribution algorithm solved this dilemma.
- Geocoding Latency & Race Conditions: Typing fast in the location search bar could trigger rapid asynchronous requests to OpenStreetMap's Nominatim service. We built request cancellation tokens and debouncing to eliminate out-of-order search responses.
- Balancing Technical Rigor with Civic Accessibility: It was vital that our dashboard did not look like an academic research tool. We spent significant time crafting plain-language diagnostics and visual risk tiers so that a student, farmer, or emergency volunteer could immediately understand what steps to take.
🏆 Accomplishments That We're Proud Of
- Explainable AI/Logic: Built an algorithm where every score is backed by clear, human-readable rationale rather than a black-box percentage.
- Resilient Fallbacks: The platform maintains full utility across varying network conditions and telemetry availability.
- Responsive & Accessible UI: Designed an interface that works seamlessly on handheld mobile screens under poor daylight or high-contrast night settings.
📚 What We Learned
- Hydrological Modeling Fundamentals: Deepened our understanding of river discharge metrics, catchment basins, and how peak-to-mean surge ratios indicate impending overflow.
- Client-Side State & Cloud Coexistence: Mastered balancing Firestore cloud persistence with local storage fallbacks so user preferences render instantaneously without layout shifts.
- Empathetic Disaster Tech Design: Technology built for emergencies must prioritize clarity and calm over clutter.
🔮 What's Next for FloodSense
- [ ] SMS & WhatsApp Alerts: Integrating automated SMS dispatch for high-risk warnings, reaching communities without reliable smartphones or mobile data.
- [ ] Regional Language Localization: Adding native support for Assamese (অসমীয়া), Bengali (বাংলা), Hindi (हिंदी), and Bodo.
- [ ] Crowdsourced Hazard Verification: Enabling verified community scouts to report flooded roads, breached embankments, and emergency shelter status.
- [ ] Official State Gauge Integrations: Directly syncing real-time gauge levels from Central Water Commission (CWC) and ASDMA sensors.
Built With
- css3
- data-visualization
- firebase
- firebase-authentication
- gis
- glofas
- google-cloud-firestore
- gps
- html5
- javascript
- leaflet.js
- node.js
- nominatim
- open-meteo-api
- openstreetmap
- react
- react-leaflet
- react-router
- recharts
- responsive-design
- rest-api
- svg
- vercel
- vite

Log in or sign up for Devpost to join the conversation.