-
-
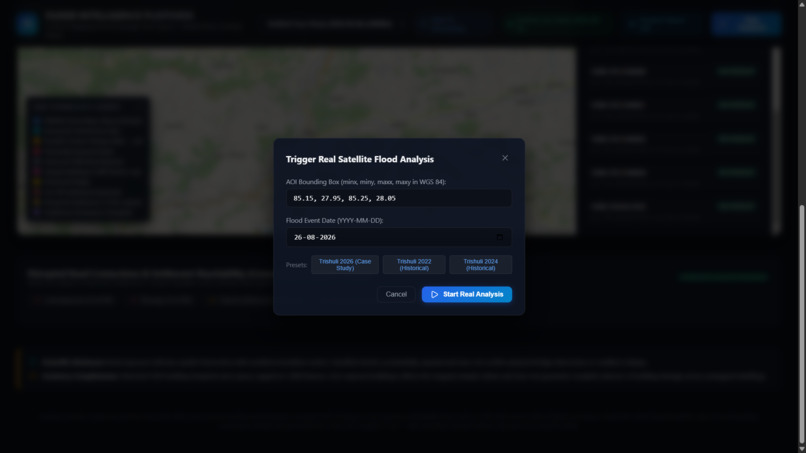
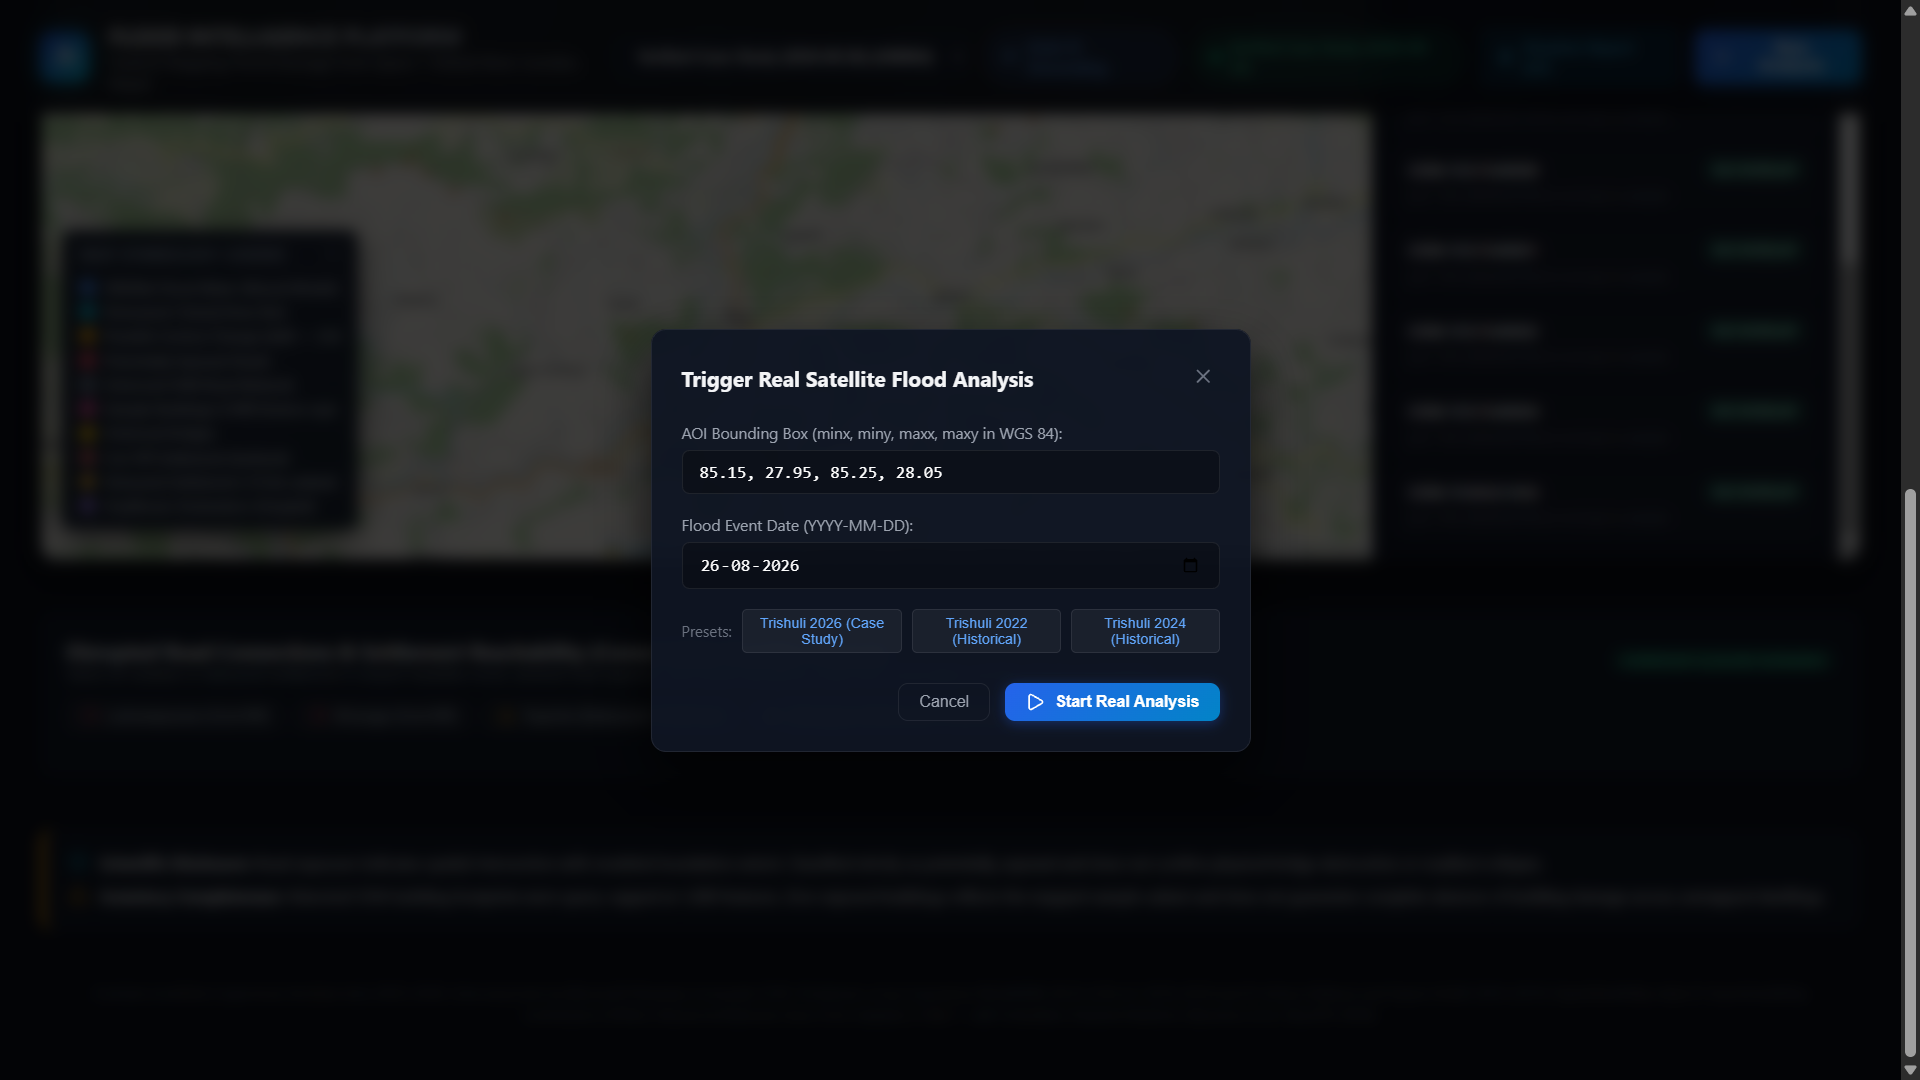
Getting started with a analysis
-
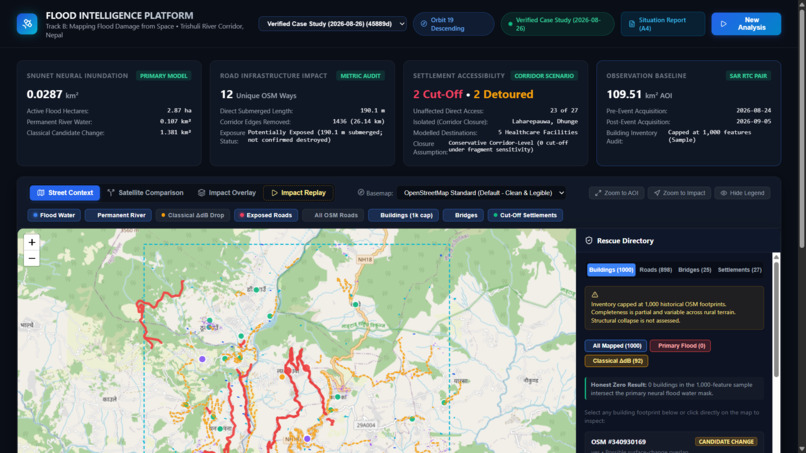
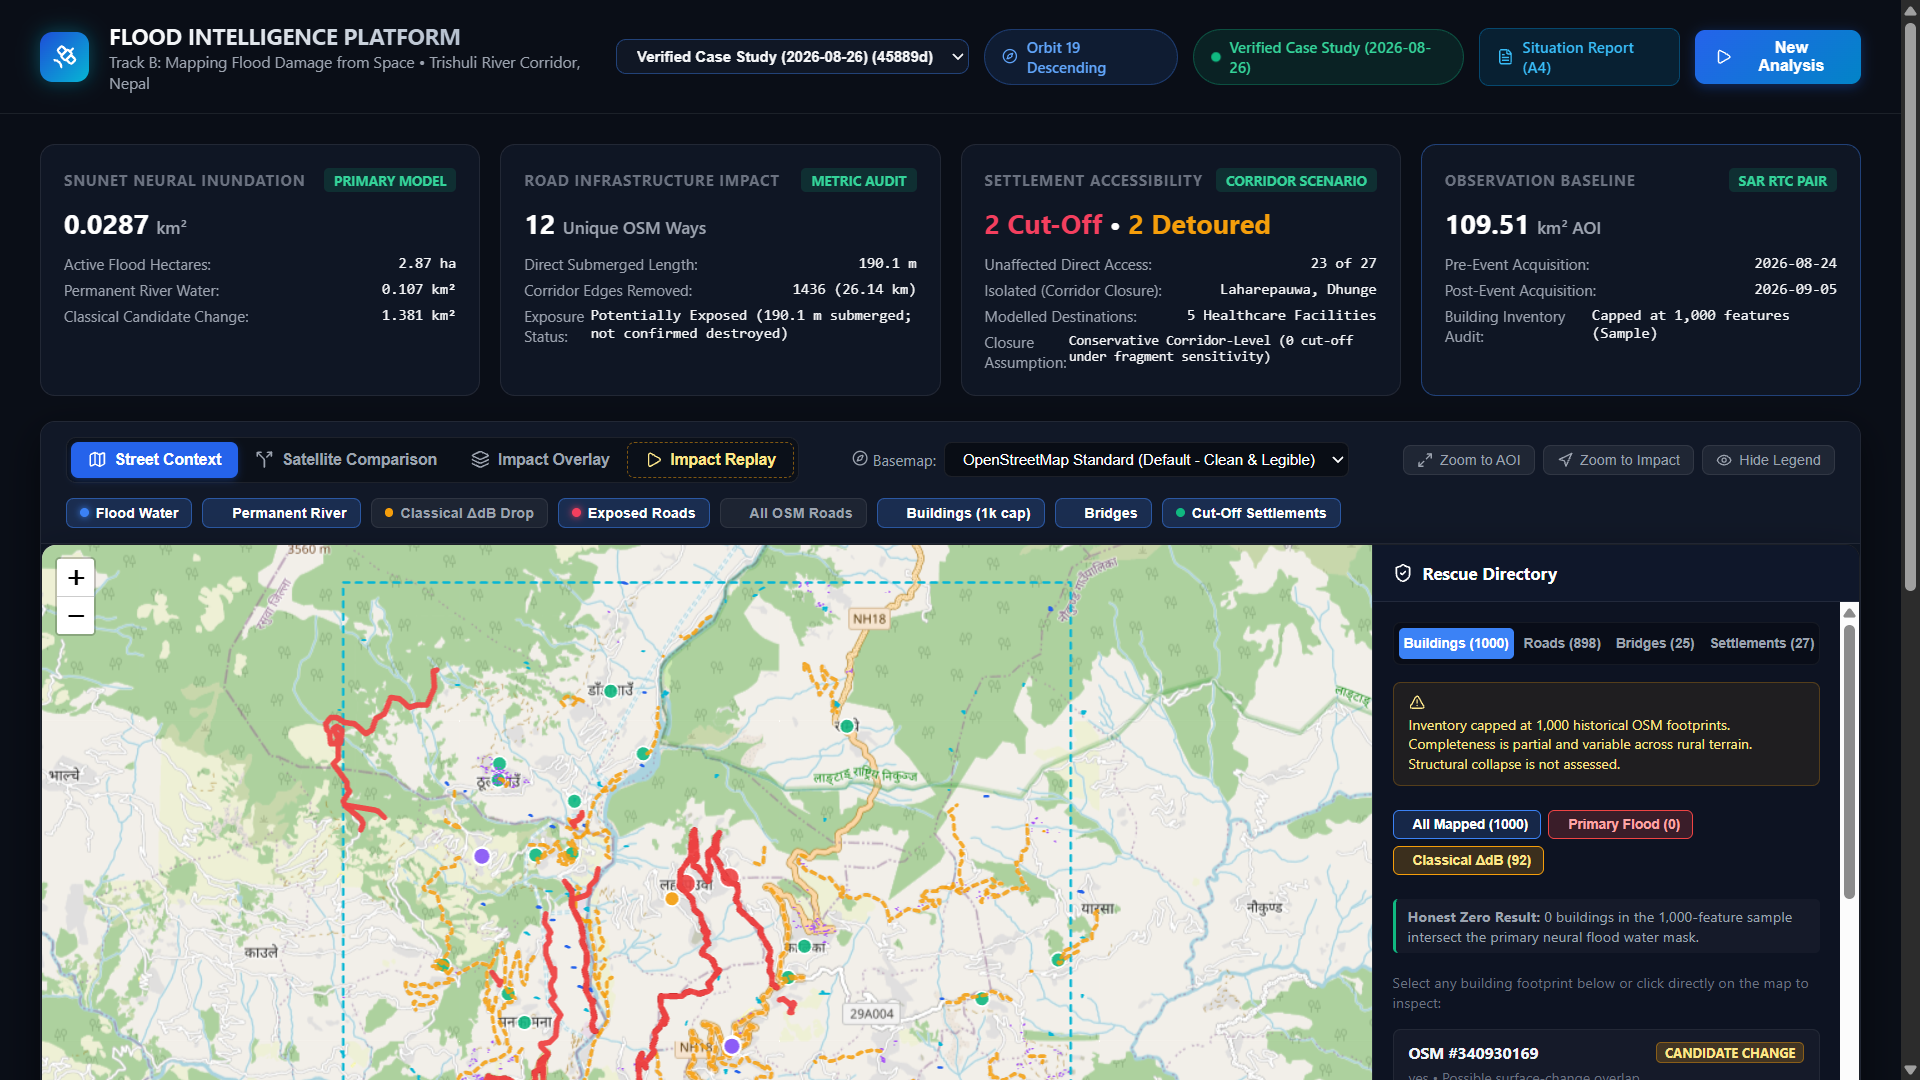
Interface after processing the analysis
-
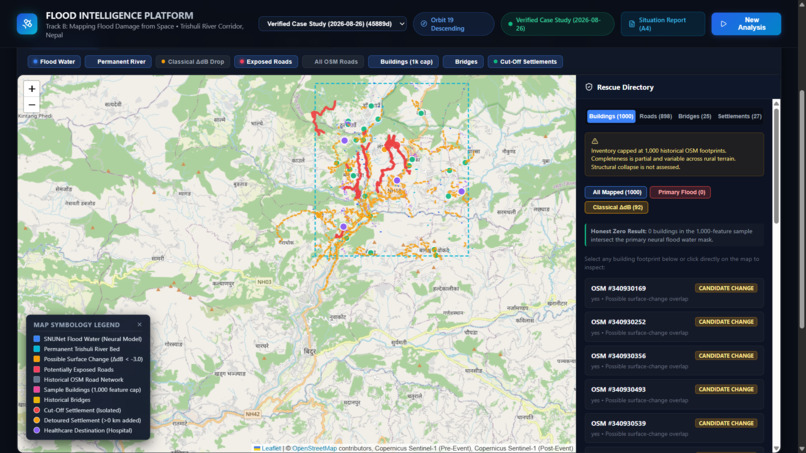
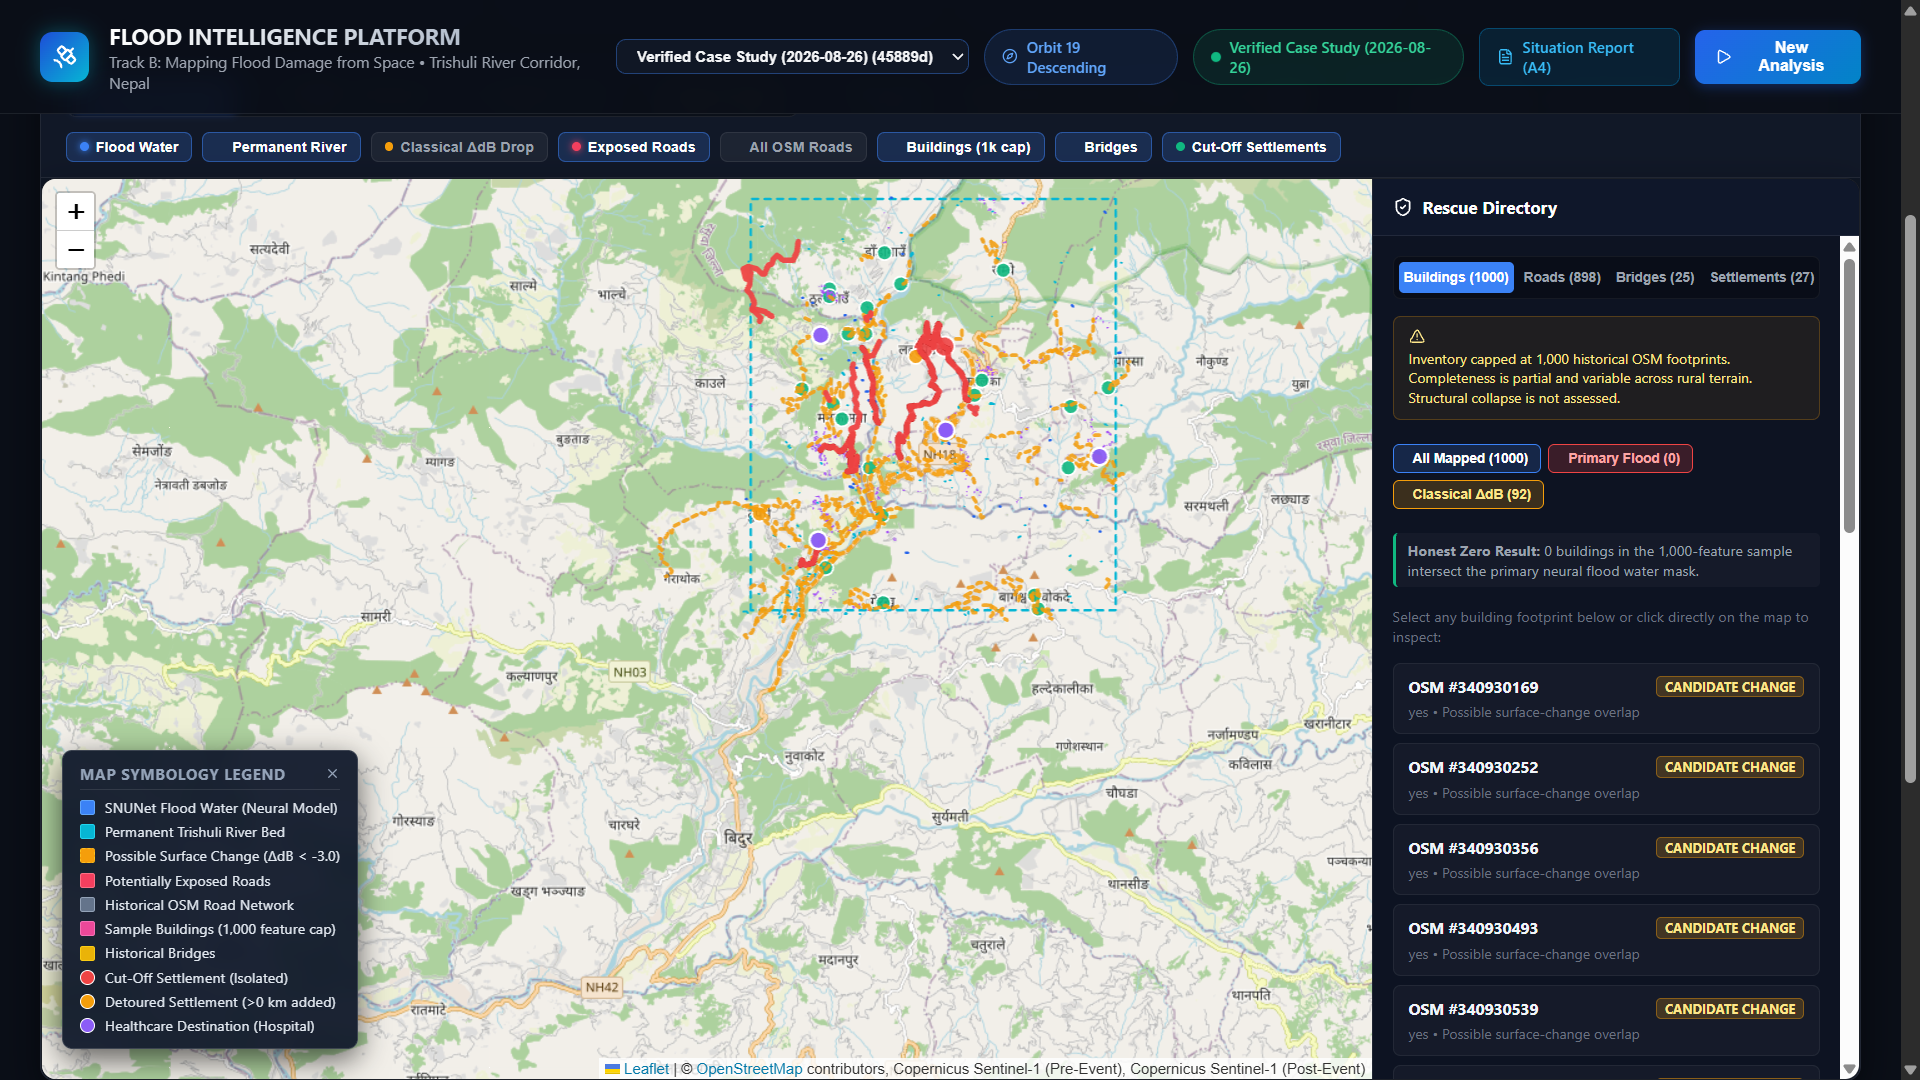
Real-time map plotting & review with certain parameters
-
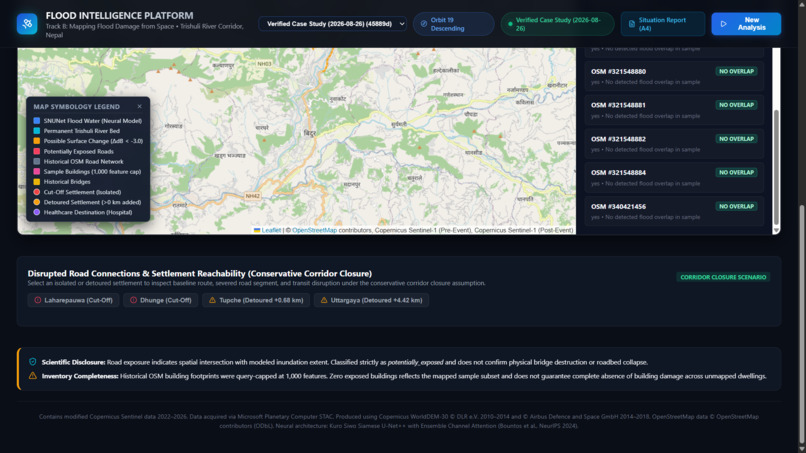
Risk summary for any point on the specified AOI
-
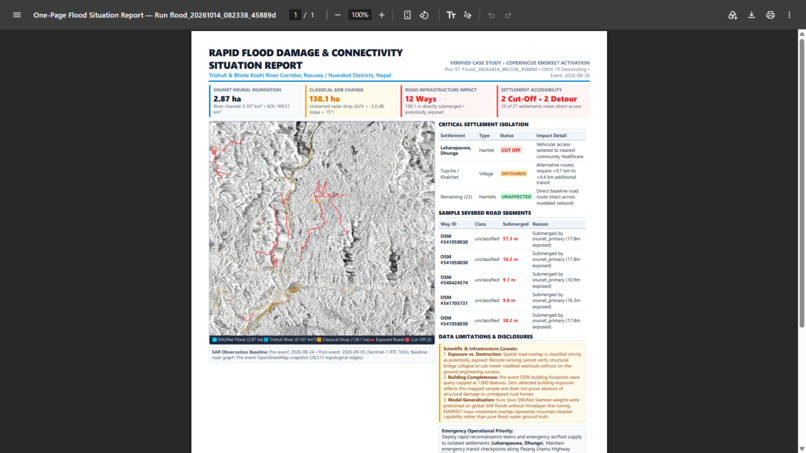
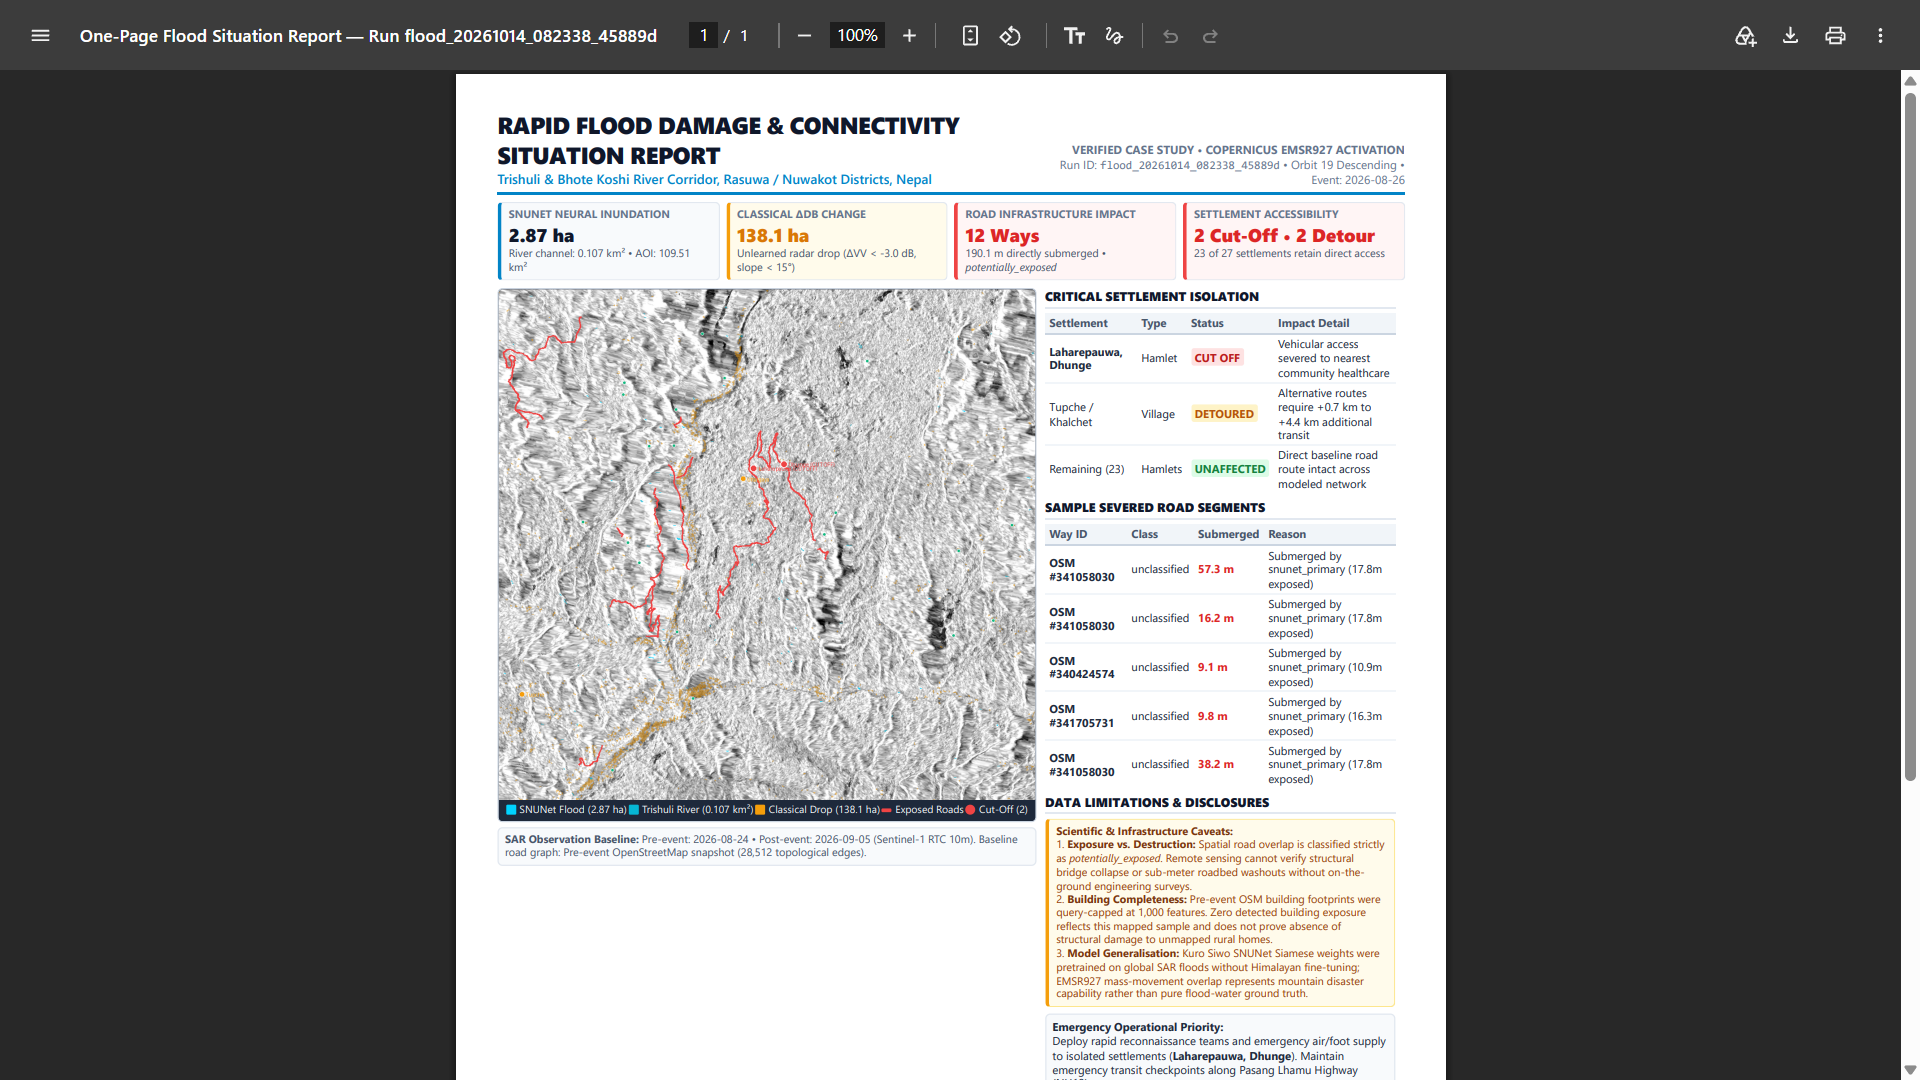
Detailed analysis report based on certain parameters
FloodLens: Satellite Flood Intelligence 🌊🛰️
Inspiration
When a major flood strikes, roads can become inaccessible, bridges may be exposed to damage, and entire communities can lose access to essential services. During these situations, rescue teams need more than satellite images—they need actionable information about where flooding may have occurred, which infrastructure could be affected, and which settlements may face disrupted road access.
We built FloodLens for the Multimodal AI Hackathon 2026, Track B: Mapping Flood Damage from Space, to explore how satellite imagery, artificial intelligence, and geospatial network analysis can turn remote-sensing data into an interactive flood-impact assessment.
Our goal was to connect three questions in one platform:
- Where did the flood hit? Identify modelled flood-water extent and areas of potential radar-observed change.
- What infrastructure may be affected? Overlay mapped buildings, roads, and bridges to identify potential exposure.
- Who could lose road access? Analyze the road network to estimate which settlements may experience disrupted vehicular connectivity to essential destinations.
What We Built
FloodLens is an interactive satellite-based flood intelligence platform with a React and Leaflet dashboard, a FastAPI backend, and a geospatial processing pipeline.
🛰️ 1. Satellite-Based Flood Mapping
FloodLens discovers compatible Sentinel-1 radar observations through the Microsoft Planetary Computer STAC API. The demonstrated Trishuli, Nepal case study uses observations from 24 August 2026 and 5 September 2026 around the 26 August 2026 flood event.
The application aligns radar observations and elevation data on a common analysis grid and provides interactive pre-event/post-event comparison.
It combines two complementary approaches:
- Neural flood segmentation: The pretrained SNUNet-ECAM model from the Kuro Siwo project distinguishes modelled flood water from permanent water and background.
- Classical radar-change analysis: A backscatter-change baseline with a slope filter identifies candidate areas of surface change for comparison with the neural output.
The dashboard lets users explore these outputs through map overlays and satellite comparison modes. The neural prediction and classical candidate-change layer remain separate because they do not represent exactly the same phenomenon.
🏘️ 2. Infrastructure Exposure Analysis
FloodLens combines its modelled hazard extent with OpenStreetMap infrastructure data to identify potentially exposed features.
Users can explore mapped building footprints, road segments, bridges, and settlements through interactive map layers. The goal is to help users understand where modeled hazard areas intersect infrastructure that may require further investigation.
These intersections represent potential exposure, not confirmed structural damage. The completeness of the results also depends on mapped infrastructure coverage.
🚧 3. Settlement Accessibility Analysis
Flood impact is not limited to inundated land. A settlement may face access problems even when the settlement itself is not flooded, if a connecting road becomes unusable.
FloodLens constructs a road-network graph from historical OpenStreetMap data and evaluates route accessibility to mapped healthcare destinations. It compares baseline and simulated post-disruption routes to identify potentially cut-off settlements and detours.
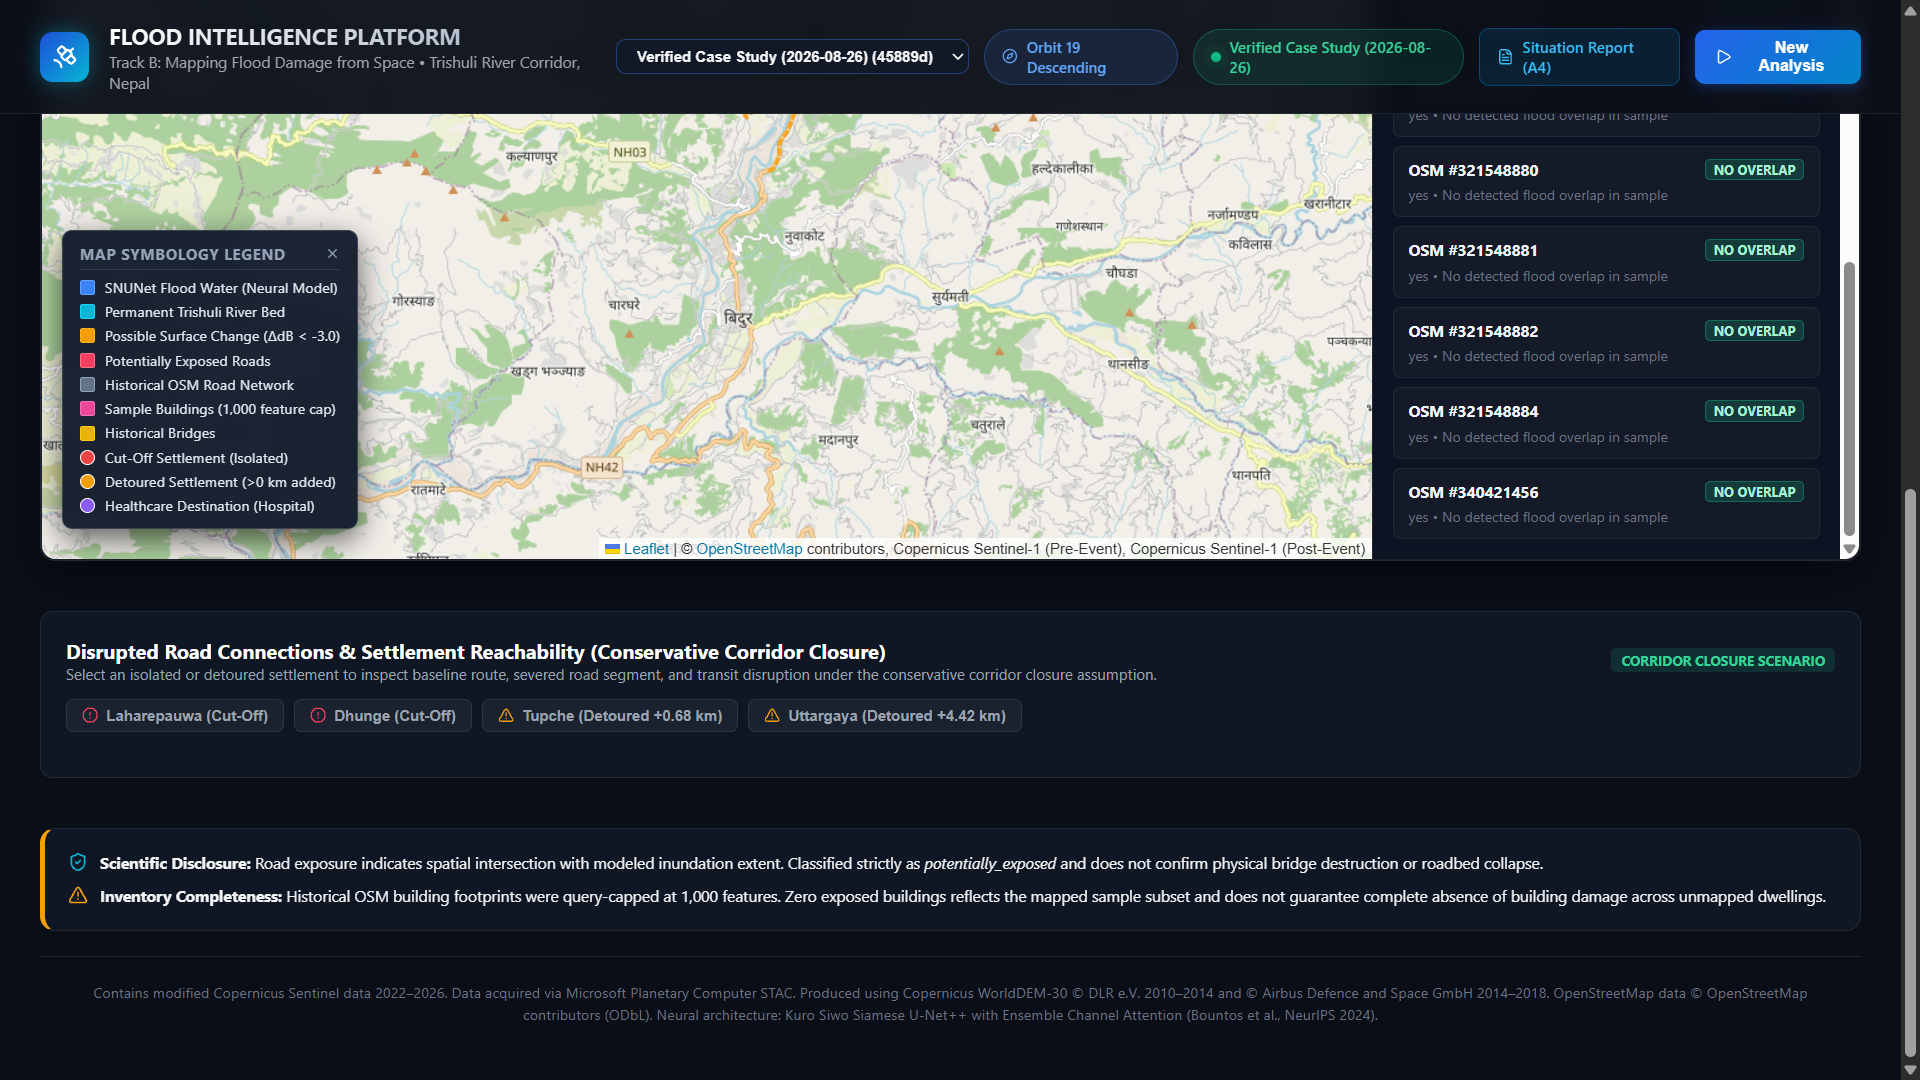
The current Trishuli case study reports two potentially cut-off settlements and two detoured settlements under a conservative corridor-level closure scenario. This scenario assumes that an entire mapped road way is closed if any part intersects the modelled hazard extent.
This is an explicit modelling assumption, not confirmation that the road was actually closed or that a settlement was isolated in reality.
🔎 4. Interactive Investigation and Reporting
The dashboard brings the analysis into an interactive interface where users can:
- Compare pre-event and post-event satellite observations.
- Toggle flood-water, permanent-water, and classical-change layers.
- Explore mapped buildings, roads, bridges, and settlements.
- Inspect selected locations using available radar measurements and geospatial explanations.
- Review settlement-accessibility results.
- Explore the available impact timeline and export a concise situation report.
The intent is to connect satellite-derived signals, infrastructure overlays, and network-level consequences in one workflow rather than presenting isolated maps or numerical outputs.
How We Built It
The platform combines the following components:
- Frontend: React, Vite, and Leaflet for the interactive dashboard and geospatial visualization.
- Backend: Python and FastAPI for analysis orchestration, APIs, inspection, and report generation.
- AI: PyTorch and SNUNet-ECAM, using official pretrained Kuro Siwo weights.
- Satellite data: Sentinel-1 radar observations queried through Microsoft Planetary Computer.
- Elevation: Copernicus DEM for terrain context and slope analysis.
- Geospatial processing: Rasterio, GeoPandas, and Shapely for raster processing, geometry operations, and vector outputs.
- Network analysis: NetworkX for road-graph construction, reachability, and route comparisons.
- Infrastructure data: OpenStreetMap, using a pre-event snapshot for the demonstrated 2026 case study.
The application stores the outputs and metadata of an analysis run so that its maps, infrastructure overlays, inspection results, and report can be explored together.
Challenges We Faced
Working with radar imagery in complex terrain: Mountainous landscapes and changing surface conditions make it difficult to interpret radar changes as flooding. We therefore kept the neural segmentation and classical radar-change baseline separate and exposed their outputs for comparison.
Distinguishing flood water from other surface changes: A radar-change candidate is not automatically confirmed flood water. We had to make the distinction between the modelled flood-water output and broader candidate changes clear in the application and its reporting.
Connecting hazard maps to road accessibility: Translating spatial intersections into settlement-access implications required a routable road graph and an explicit road-closure assumption. We documented the conservative corridor-level closure scenario because its results differ from a simulation that removes only individual graph fragments intersecting the hazard area.
Evaluating the model responsibly: We used the official pretrained Kuro Siwo SNUNet-ECAM checkpoint without local fine-tuning. The available Copernicus EMSR927 reference maps mass movement, including landslide debris and scouring, rather than providing direct ground truth for standing flood water. We therefore treat this reference as a cross-hazard spatial-overlap comparison, not as definitive flood-segmentation validation.
Building a usable end-to-end experience: Beyond model inference, the project required raster alignment, vectorization, infrastructure overlays, route analysis, map interactions, coordinate inspection, and report generation to work together.
What We Learned
We learned that an AI-driven disaster-mapping system is not just a segmentation model displayed on a map. Its usefulness depends on data provenance, spatial alignment, uncertainty, infrastructure coverage, routing assumptions, and the clarity with which the results are communicated.
We also learned the importance of separating measured observations, model predictions, and scenario-based conclusions. A potential road disruption should not be presented as a confirmed road closure, and a modelled flood extent should not be confused with verified field damage.
Limitations and Future Work
FloodLens is an educational research prototype for decision support, not a replacement for field verification or official emergency-response systems.
The model uses published pretrained weights without local fine-tuning for the demonstrated Himalayan case study. Sentinel-1 RTC products are used rather than running the complete raw Level-1 GRD preprocessing chain locally. Optical Sentinel-2 imagery was not fused into the active inference pipeline for the demonstrated event because the available scenes were heavily cloud-covered.
Infrastructure exposure depends on mapped data completeness, and the building inventory may be capped. Road-access results represent modeled vehicular connectivity and depend on the corridor-closure assumption. Actual road conditions, structural damage, and settlement isolation require independent verification.
Future improvements could include stronger event-specific validation against appropriate flood-water reference data, improved road-disruption scenarios, richer elevation-based downstream analysis, and additional operational data for emergency planning.
Built for the Multimodal AI Hackathon 2026
FloodLens — Satellite Flood Intelligence explores how satellite remote sensing, pretrained AI, geospatial analytics, and network analysis can support a more connected picture of potential flood impacts.
Data Attribution
Contains modified Copernicus Sentinel data 2026.
Produced using Copernicus WorldDEM-30 © DLR e.V. 2010–2014 and © Airbus Defence and Space GmbH 2014–2018 provided under COPERNICUS by the European Union and ESA; all rights reserved.
© OpenStreetMap contributors.
Flood segmentation model: Kuro Siwo: A Global Multi-Temporal SAR Dataset for Rapid Flood Mapping, Bountos et al., NeurIPS 2024.
Built With
- copernicus-dem
- fastapi
- flood-mapping
- geojson
- geopandas
- geospatial-analysis
- gis
- kuro-siwo
- leaflet.js
- machine-learning
- microsoft-planetary-computer
- networkx
- openstreetmap
- python
- pytorch
- rasterio
- react
- remote-sensing
- satellite-imagery
- sentinel-1
- shapely
- snunet-ecam
- stac-api
- vite

Log in or sign up for Devpost to join the conversation.