Inspiration
Singapore is the brightest country on Earth. One hundred percent of its population lives under skies too bright for the human eye to dark-adapt, and nobody there can see the Milky Way from their home. It also sits directly on the East Asian–Australasian Flyway, one of the most species-rich and most threatened migration routes in the world. Every October and November, migrating birds are drawn off course by artificial light and killed against glass they cannot perceive.
There is no map of where that happens. We went looking for one, found nothing, and realised the reason was more interesting than the absence.
What it does
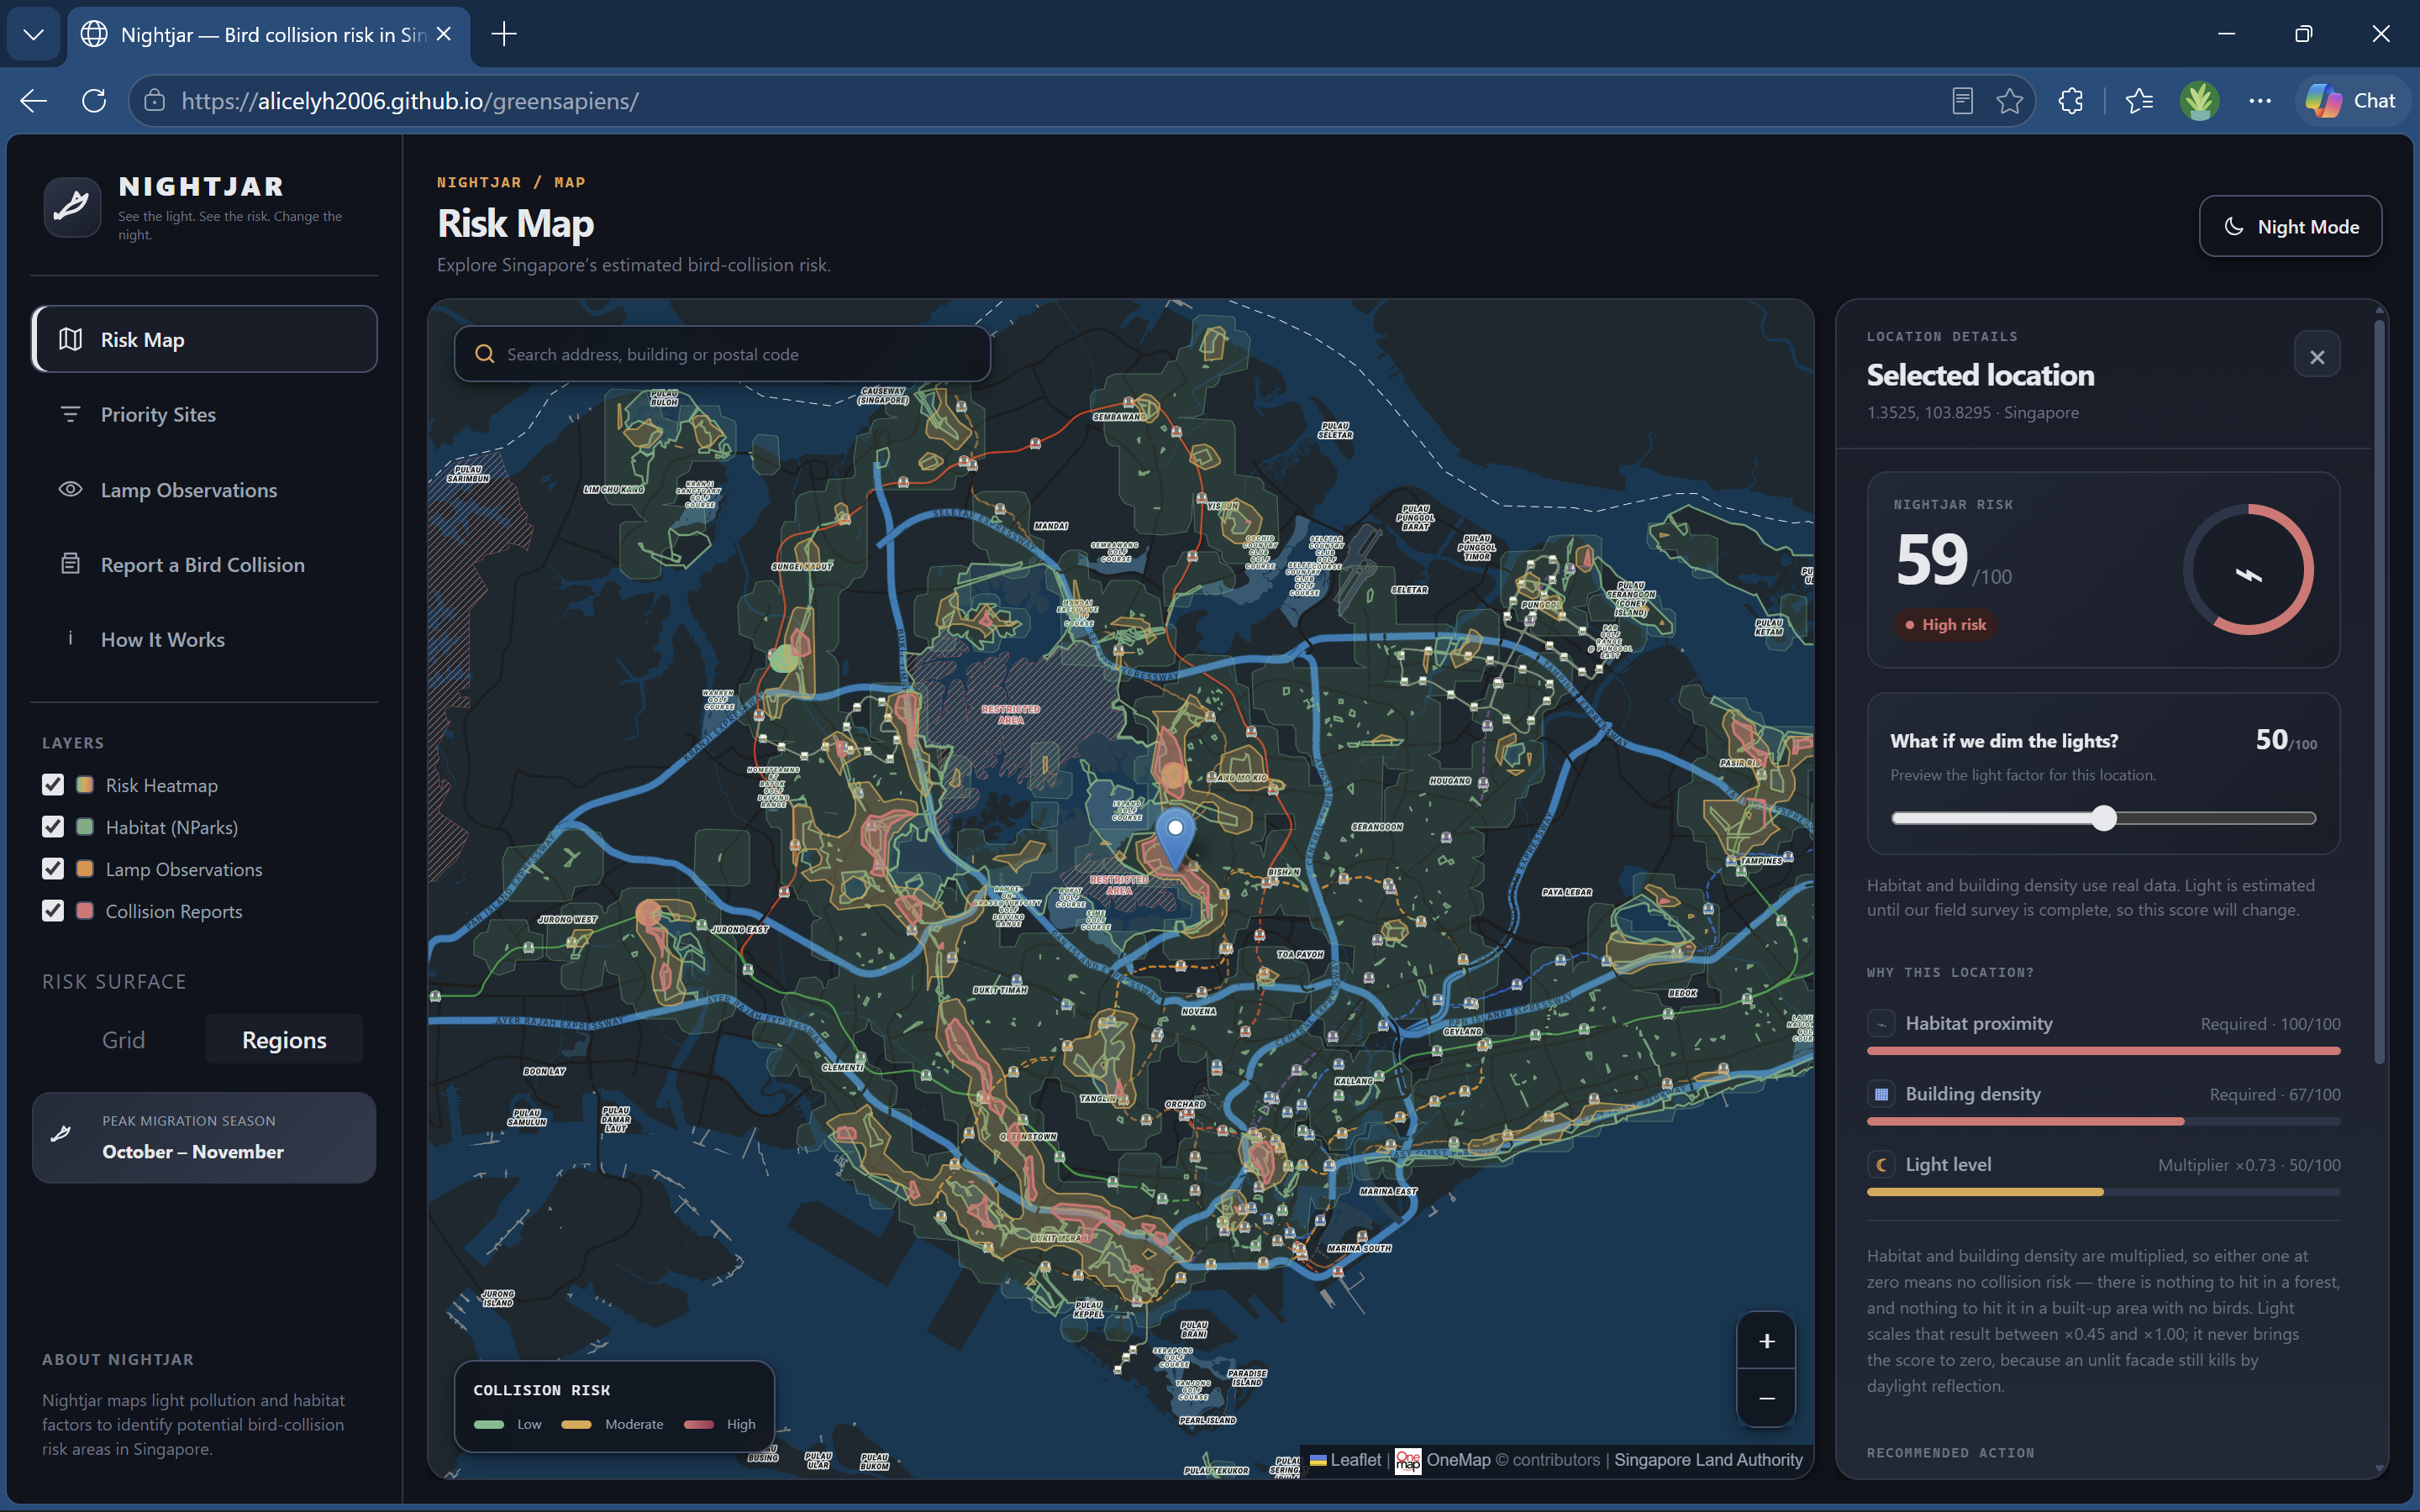
Nightjar scores any point in Singapore for bird-collision risk, from 0 to 100, and shows the three factors behind the number.
- Click anywhere on the map — you get a score, a risk band, and the habitat, light and building-density values that produced it, each with a plain-English note on how confident we are.
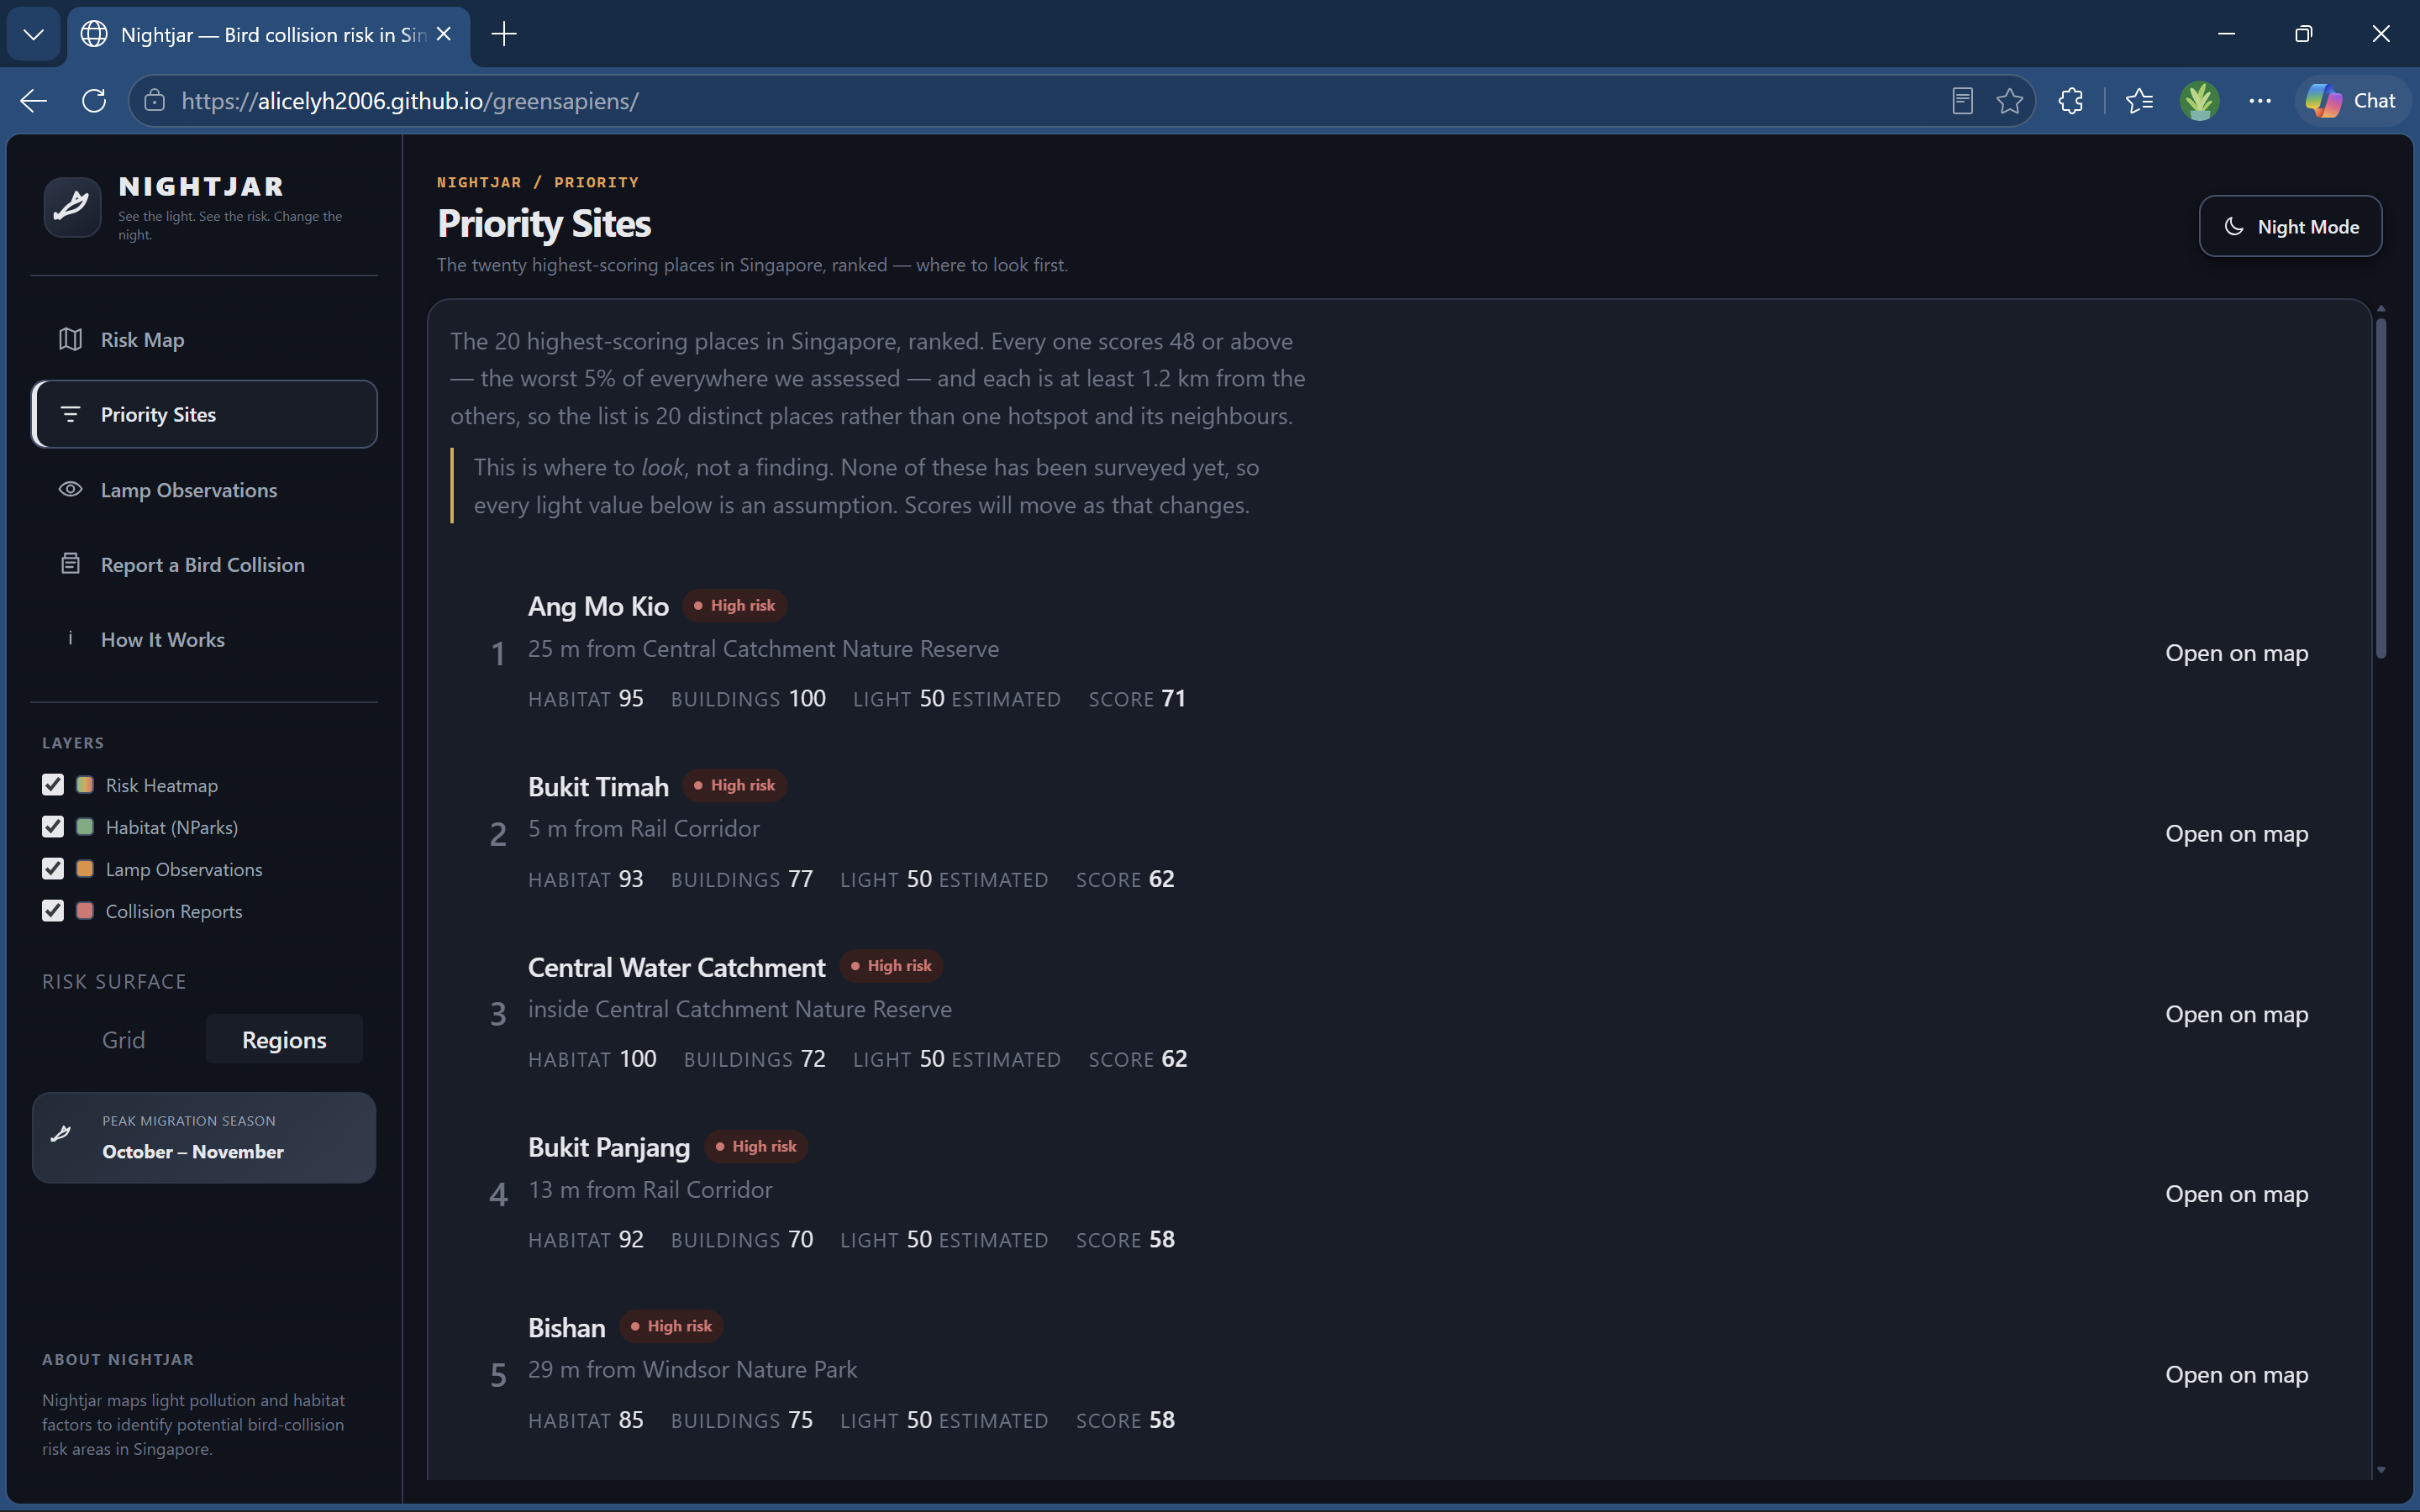
- Priority Sites ranks the twenty highest-risk locations on the island, titled by planning area so a person can actually find them.
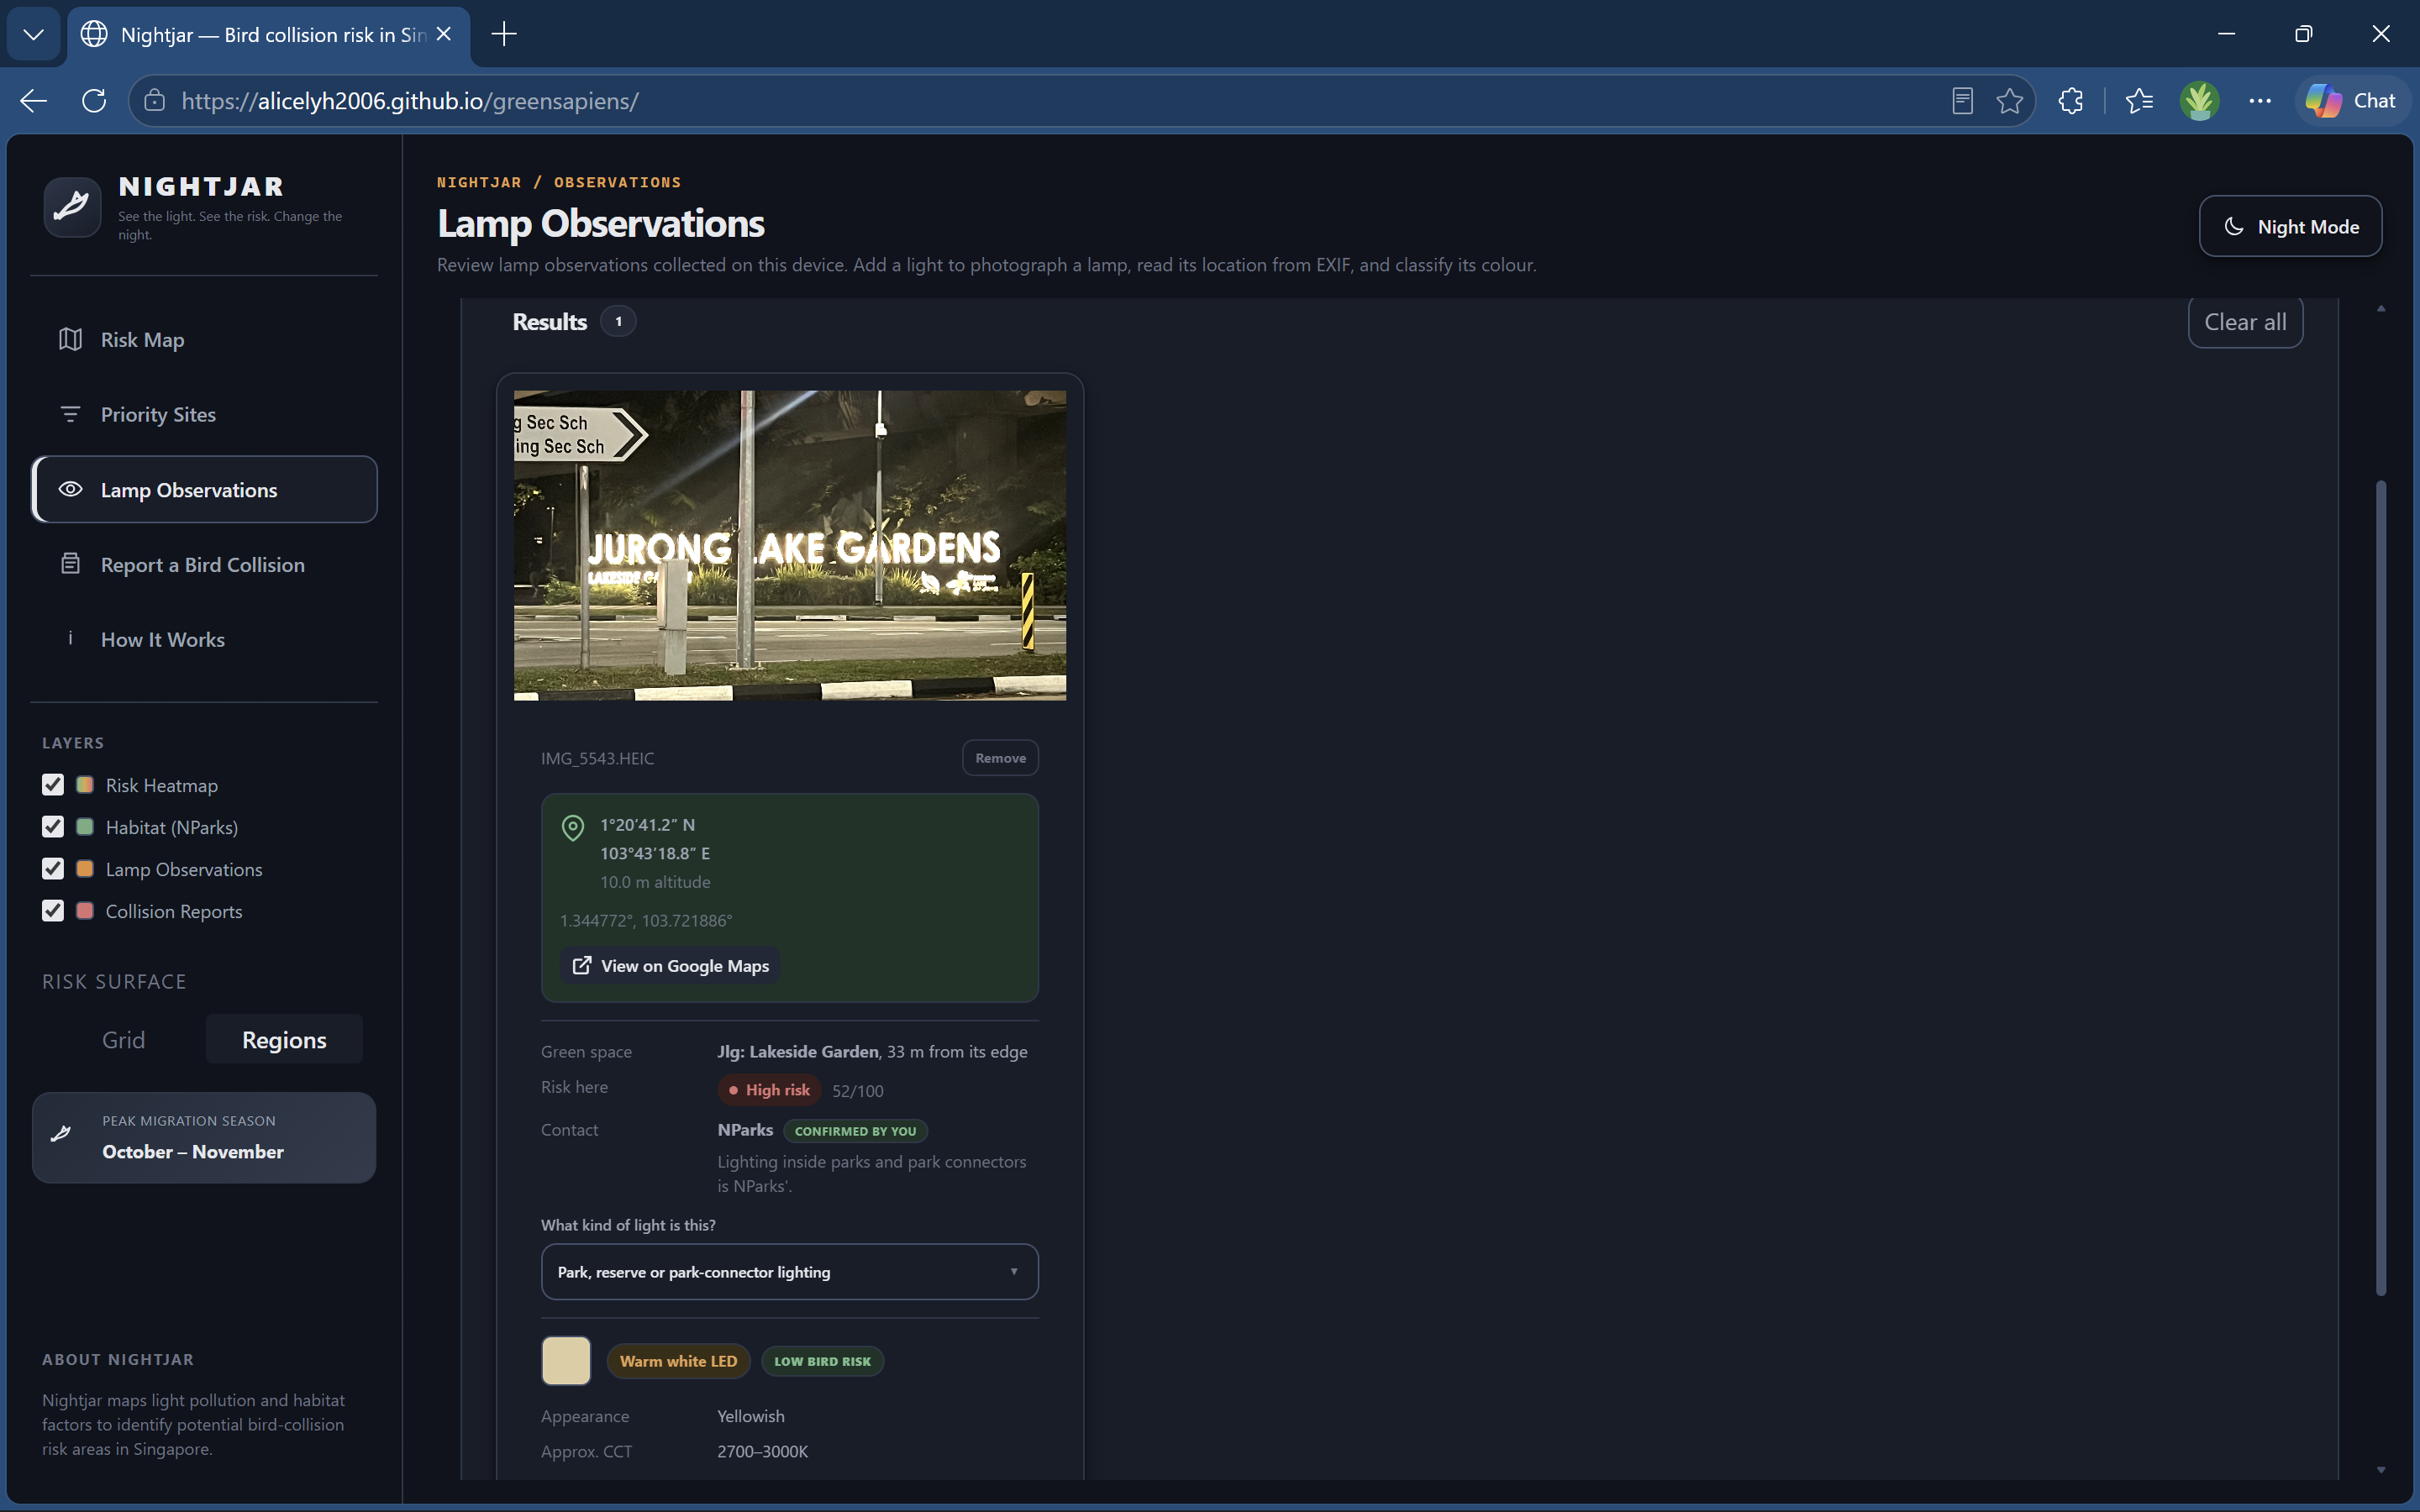
- Lamp Observations reads a photograph of a street lamp, estimates its colour, and places it from the photo's GPS — the crowd-sourcing path for the one factor that cannot be downloaded.
- How It Works documents the model, the sensitivity testing, and — at length — what does not work yet.
Everything runs in the browser. No backend, no accounts, no photo ever leaves the device.
How we built it
The model comes from Disentangling the biotic and abiotic drivers of bird–building collisions in a tropical Asian city with ecological niche modeling (Conservation Biology 38, e14255, 2024), built on seven years of community-science observations. Its central finding is that collision risk splits by taxa: migratory birds are hit where high building density meets nocturnal blue-rich light, resident birds near woodland cover.
We turned that into:
risk = sqrt(habitat × density) × (lightFloor + (1 − lightFloor) × light)
Multiplicative, not a weighted sum — habitat and density are both required, so somewhere with nothing to strike scores zero however bright it is. The square root is a geometric mean, needed because a plain product of two sub-1 values never reaches the risk bands.
Habitat is 461 NParks polygons including all seven nature reserves, simplified from 2.9 MB to 419 KB. Risk peaks at the green-space boundary and decays both inward and outward — deep inside a reserve there is nothing to hit, far outside there are no birds.
Density is 183,616 OpenStreetMap building footprints converted to estimated glass area rather than floor area, because glass is what birds strike. Storey counts come from OSM tags where present and land-use defaults elsewhere, with glazing fractions by building type.
Light is our own field survey. Seventeen lamps across two nights, each photographed, identified on the spot, and positioned by EXIF GPS, plus code or landmark. Where we have no coverage the app says so rather than guessing.
All geodata is precomputed offline and committed as static files, so nothing can fail live during judging. The only network call at runtime is OneMap geocoding, and it degrades to map-click if unreachable.
Challenges we ran into
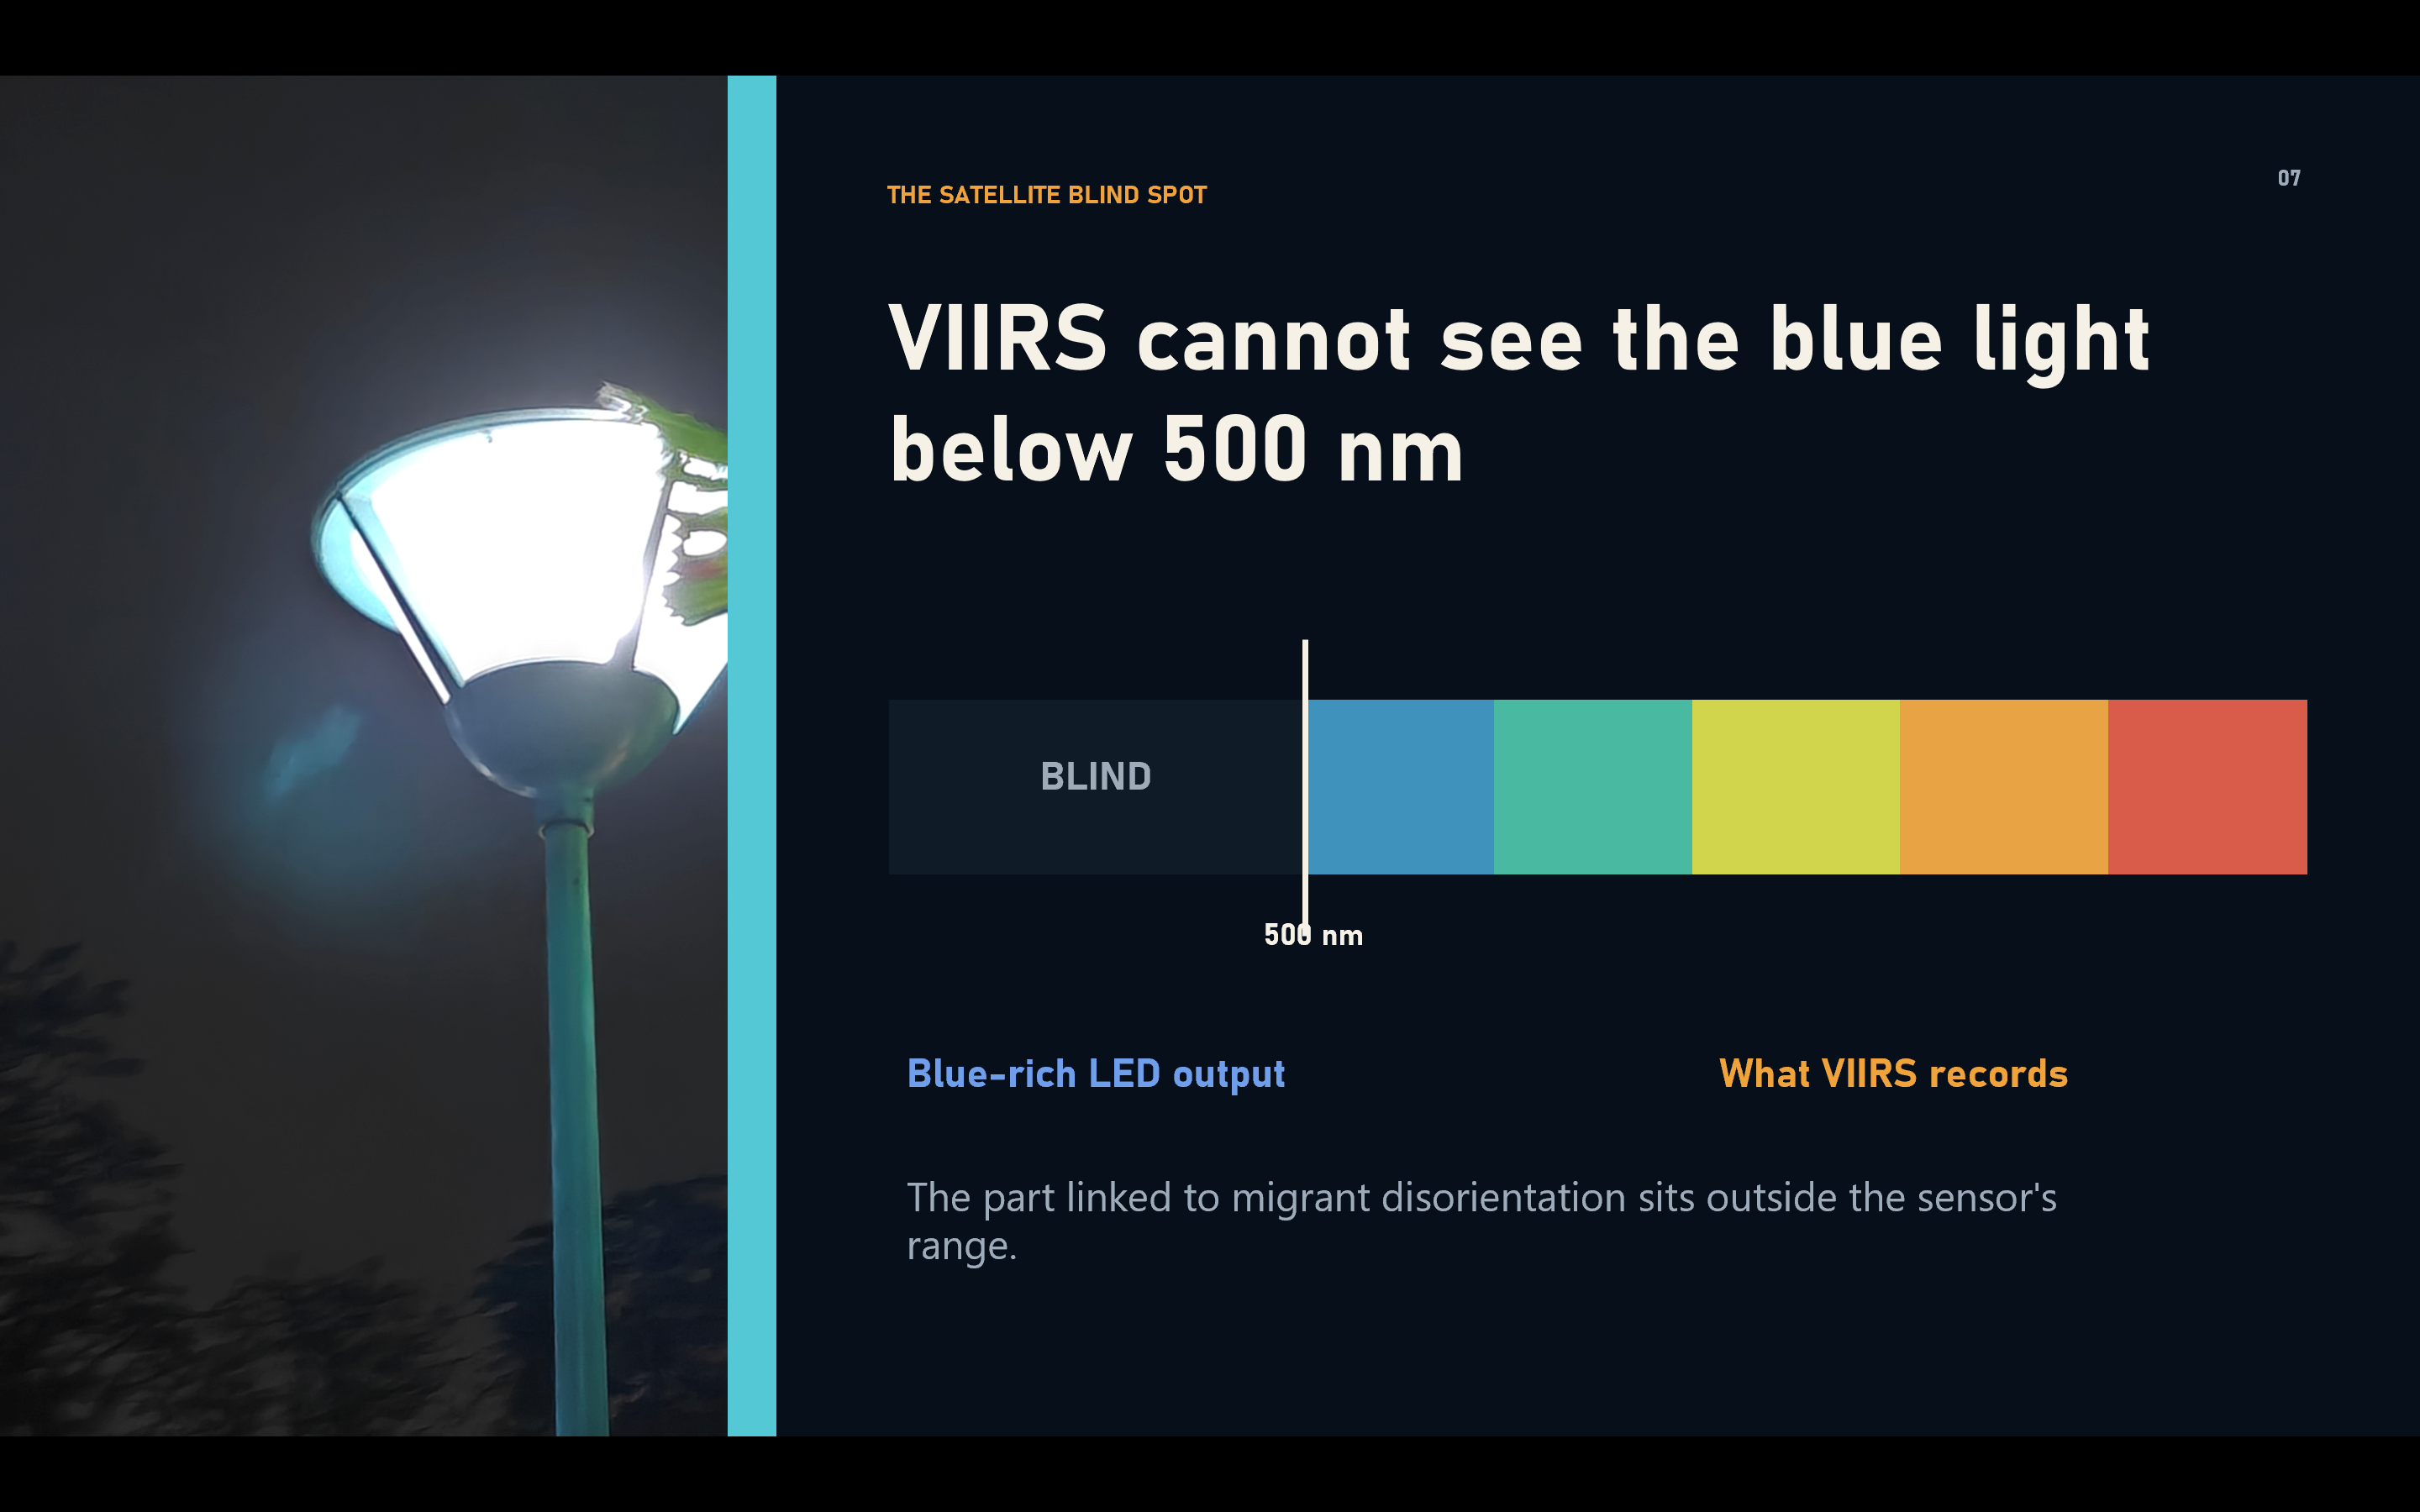
The satellite everyone uses is blind to the thing that matters. Every light-pollution map comes from VIIRS DNB, which records roughly 500–900 nm. It cannot see below 500 nm — exactly where white LEDs emit, and exactly the band that disorients migrating birds. When a city replaces sodium lamps with 4000 K LEDs, VIIRS registers a fall in emissions while the night sky actually grows bluer. There was no shortcut: the light layer had to be measured on foot.
Our own model told a town council to act on a forest with nothing in it. A mid-project merge silently replaced the multiplicative formula with an additive one and set the no-data light fallback to 1.0 — the worst case. Bukit Timah's interior, with a building density of zero, read 75 and "High risk". Two sanity-check locations caught it. We now keep a fixed set of expected scores and re-run them after any model change.
A 0.3-hectare playground outranked a 3,040-hectare nature reserve. The habitat lookup took the nearest green space rather than the most significant one nearby, so a tiny patch masked the reserve behind it. Our own survey site went from 25 to 76 once we took the maximum habitat value within the falloff radius instead.
Every photo from our first survey claimed to be in the Gulf of Guinea. A phone that never gets a satellite fix still writes the GPS tags, filled with zeroes. Our check for missing coordinates did not catch it, because the value at that point is the array [0, 0, 0], which is perfectly truthy. So the reading came through as 0°N 0°E, and the app did exactly what it was told: scored the location, found it outside Singapore, and reported a lamp as 11,529 km from the nearest park. All 28 photographs from that survey parsed this way. A coordinate of exactly zero is now treated as no reading at all.
Hexagons cannot tile a square grid. Our risk surface was drawn as hexagons over a square lattice, which leaves a gap around every cell and reads as a dot screen rather than a surface. Obvious in hindsight, invisible for a week.
Accomplishments that we're proud of
A classifier that knows what it doesn't know. We built a tool to read lamp colour from a photograph. It did not work, and we could have quietly dropped it. Instead we characterised the failure, fixed what could be fixed, and made the rest honest — it now declines to answer when it cannot tell, and says which two types it is between. Across all seventeen surveyed lamps it answers eleven, gets eleven right, and abstains on six. Every wrong answer it used to give became an admission.
Getting there corrected a mistake worth describing. The nine lamps from the first survey had been recorded by eye and never run through the classifier, although their photographs were still on disk. Putting them through doubled the sample and showed one boundary was badly placed: it sat at 0.388, chosen as the midpoint of an empty gap because we had exactly one cool-white fixture. Cool lamps in fact begin at 0.305. Refitting it was worth three more answered lamps and no new errors.
Ground truth we collected ourselves. Seventeen lamps is not many, but it is a dataset nobody else has, and it is the reason we can say anything about our own accuracy at all.
A methodology page that leads with the failures. Sensitivity analysis, out-of-sample checks, five explicit disclaimers, and a section called "What does not work yet". We would rather a judge find our limits from us than find them themselves.
What we learned
Rigorous method applied to the wrong data is worse than a crude method applied to the right data. Our clearest result. We tried to classify lamp colour properly — linearise sRGB, convert to CIE XYZ, take chromaticity coordinates, derive a correlated colour temperature with McCamy's approximation, classify against published lamp specifications. Textbook. It scored 1 out of 8, where a crude blue-channel ratio scored 6.
The reason is that a phone applies auto white balance before it writes the file. It decides the scene ought to look neutral and applies per-channel gains to make it so — removing most of the very cast we were trying to measure. Every fixture we photographed, warm and cool alike, returned 4,600–5,700 K. That is daylight: the temperature the camera normalised to. Doing colorimetry on a white-balanced photograph measures the white balance, not the lamp. The crude ratio only works because auto white balance does not fully succeed and a residue survives.
Thresholds have to come from your own data, not from the domain. Our lamp boundaries were originally taken from published colour temperatures. Those describe lamps; our inputs are white-balanced photographs of lamps, which is a different measurement. Refitting the boundary to our own labelled lamps fixed more than any algorithmic change did.
Fitting and validating on the same data proves nothing. Our boundaries are fitted to the same seventeen lamps we then score against, so "11 of 11" is calibration, not validation. We say so on the site rather than quoting the number as an accuracy result.
An honest abstention beats a confident guess. A classifier that always answers looks more capable and is worth less, because its confident wrong answers are indistinguishable from its confident right ones.
Version control is a modelling risk, not just a code risk. A silent auto-merge changed our scoring formula without a conflict, because the two sides had touched different lines. Nothing in the diff looked alarming. The output was scientifically wrong for two days.
Shipping both options beats arguing about one. We disagreed about how to draw the risk surface. Rather than one of us merging first, we shipped both behind a switch defaulting to the existing look, so the team could compare them on the live site.
What's next for Nightjar
- Validate the classifier on lamps it has not seen. Ten more, labelled by eye before anything runs. That turns calibration into a result.
- Lock white balance at capture, or shoot RAW. The only change that would make real colorimetry possible.
- More survey coverage. Seventeen lamps means most of the island is an estimate, and the map says so on every score.
- Partner with the Nature Society (Singapore) Bird Group, whose observation records are the kind of data that could validate the risk surface itself.
- Collision reporting. The form exists and stores locally; it demonstrates the concept. Real collision data would let us test the model instead of only reasoning about it.
Prior work
Built before the hackathon: nothing. The repository alicelyh2006/greensapiens was created empty and contained no code before the event window opened on 21 August 2026. Its first commit is dated 2 September 2026, well inside the window.
Built during the hackathon: all of it — the scoring model, every data pipeline, the map, the result panel, the lamp classifier, the capture flows, the methodology write-up, and the two field surveys on 10 and 19 September 2026.
Third-party inputs, none of them our work: the collision-driver findings (Conservation Biology 38, e14255, 2024); NParks green-space boundaries and URA planning areas via data.gov.sg; OpenStreetMap building footprints (ODbL); OneMap basemap and geocoding (Singapore Land Authority); and the open-source libraries listed under Built With.
Built With
- d3-contour
- data.gov.sg
- exif
- geojson
- github
- heic2any
- javascript
- leaflet.js
- onemap
- openstreetmap
- react
- react-leaflet
- turf.js
- vite


Log in or sign up for Devpost to join the conversation.