-
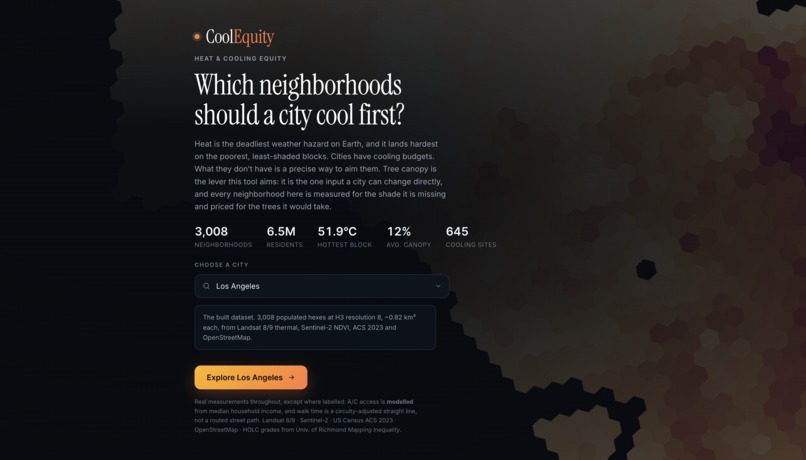
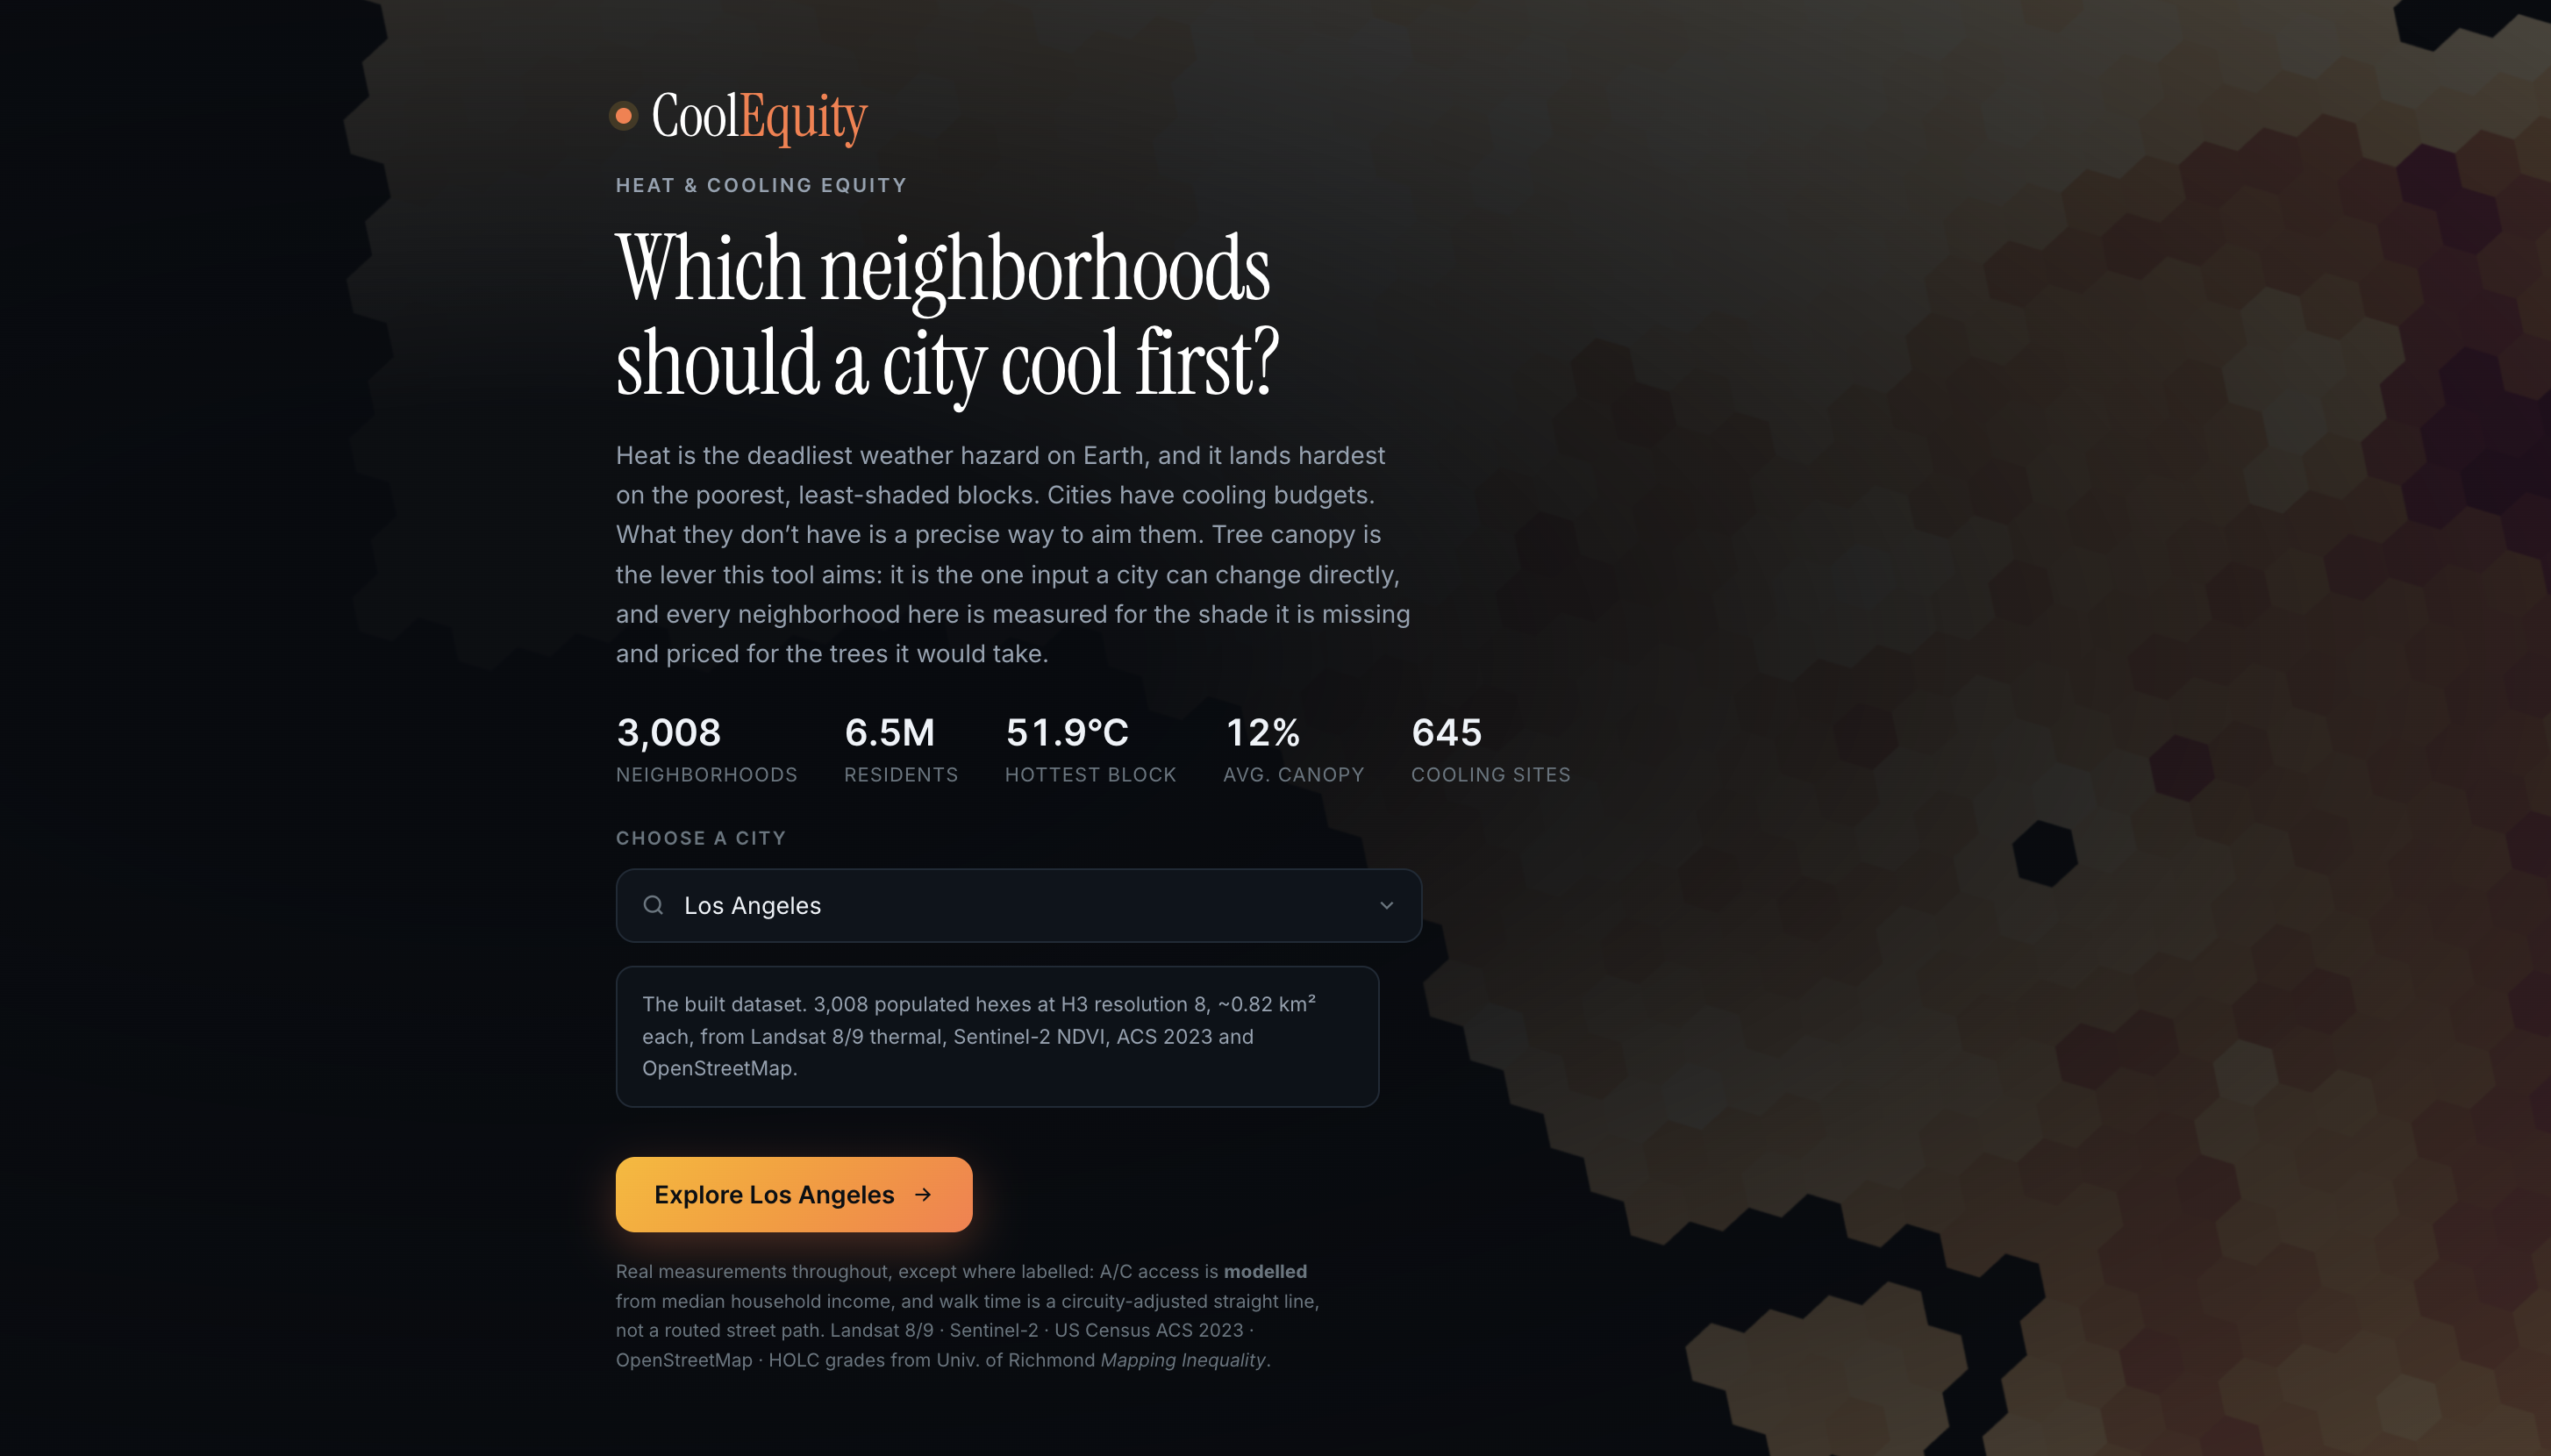
Homepage
-
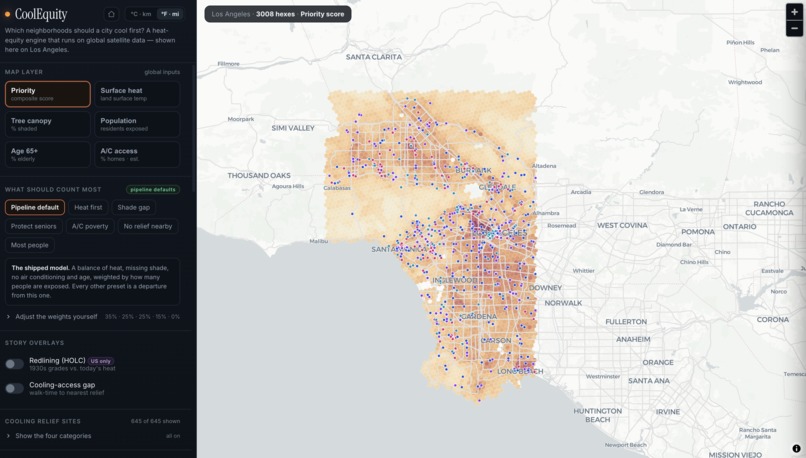
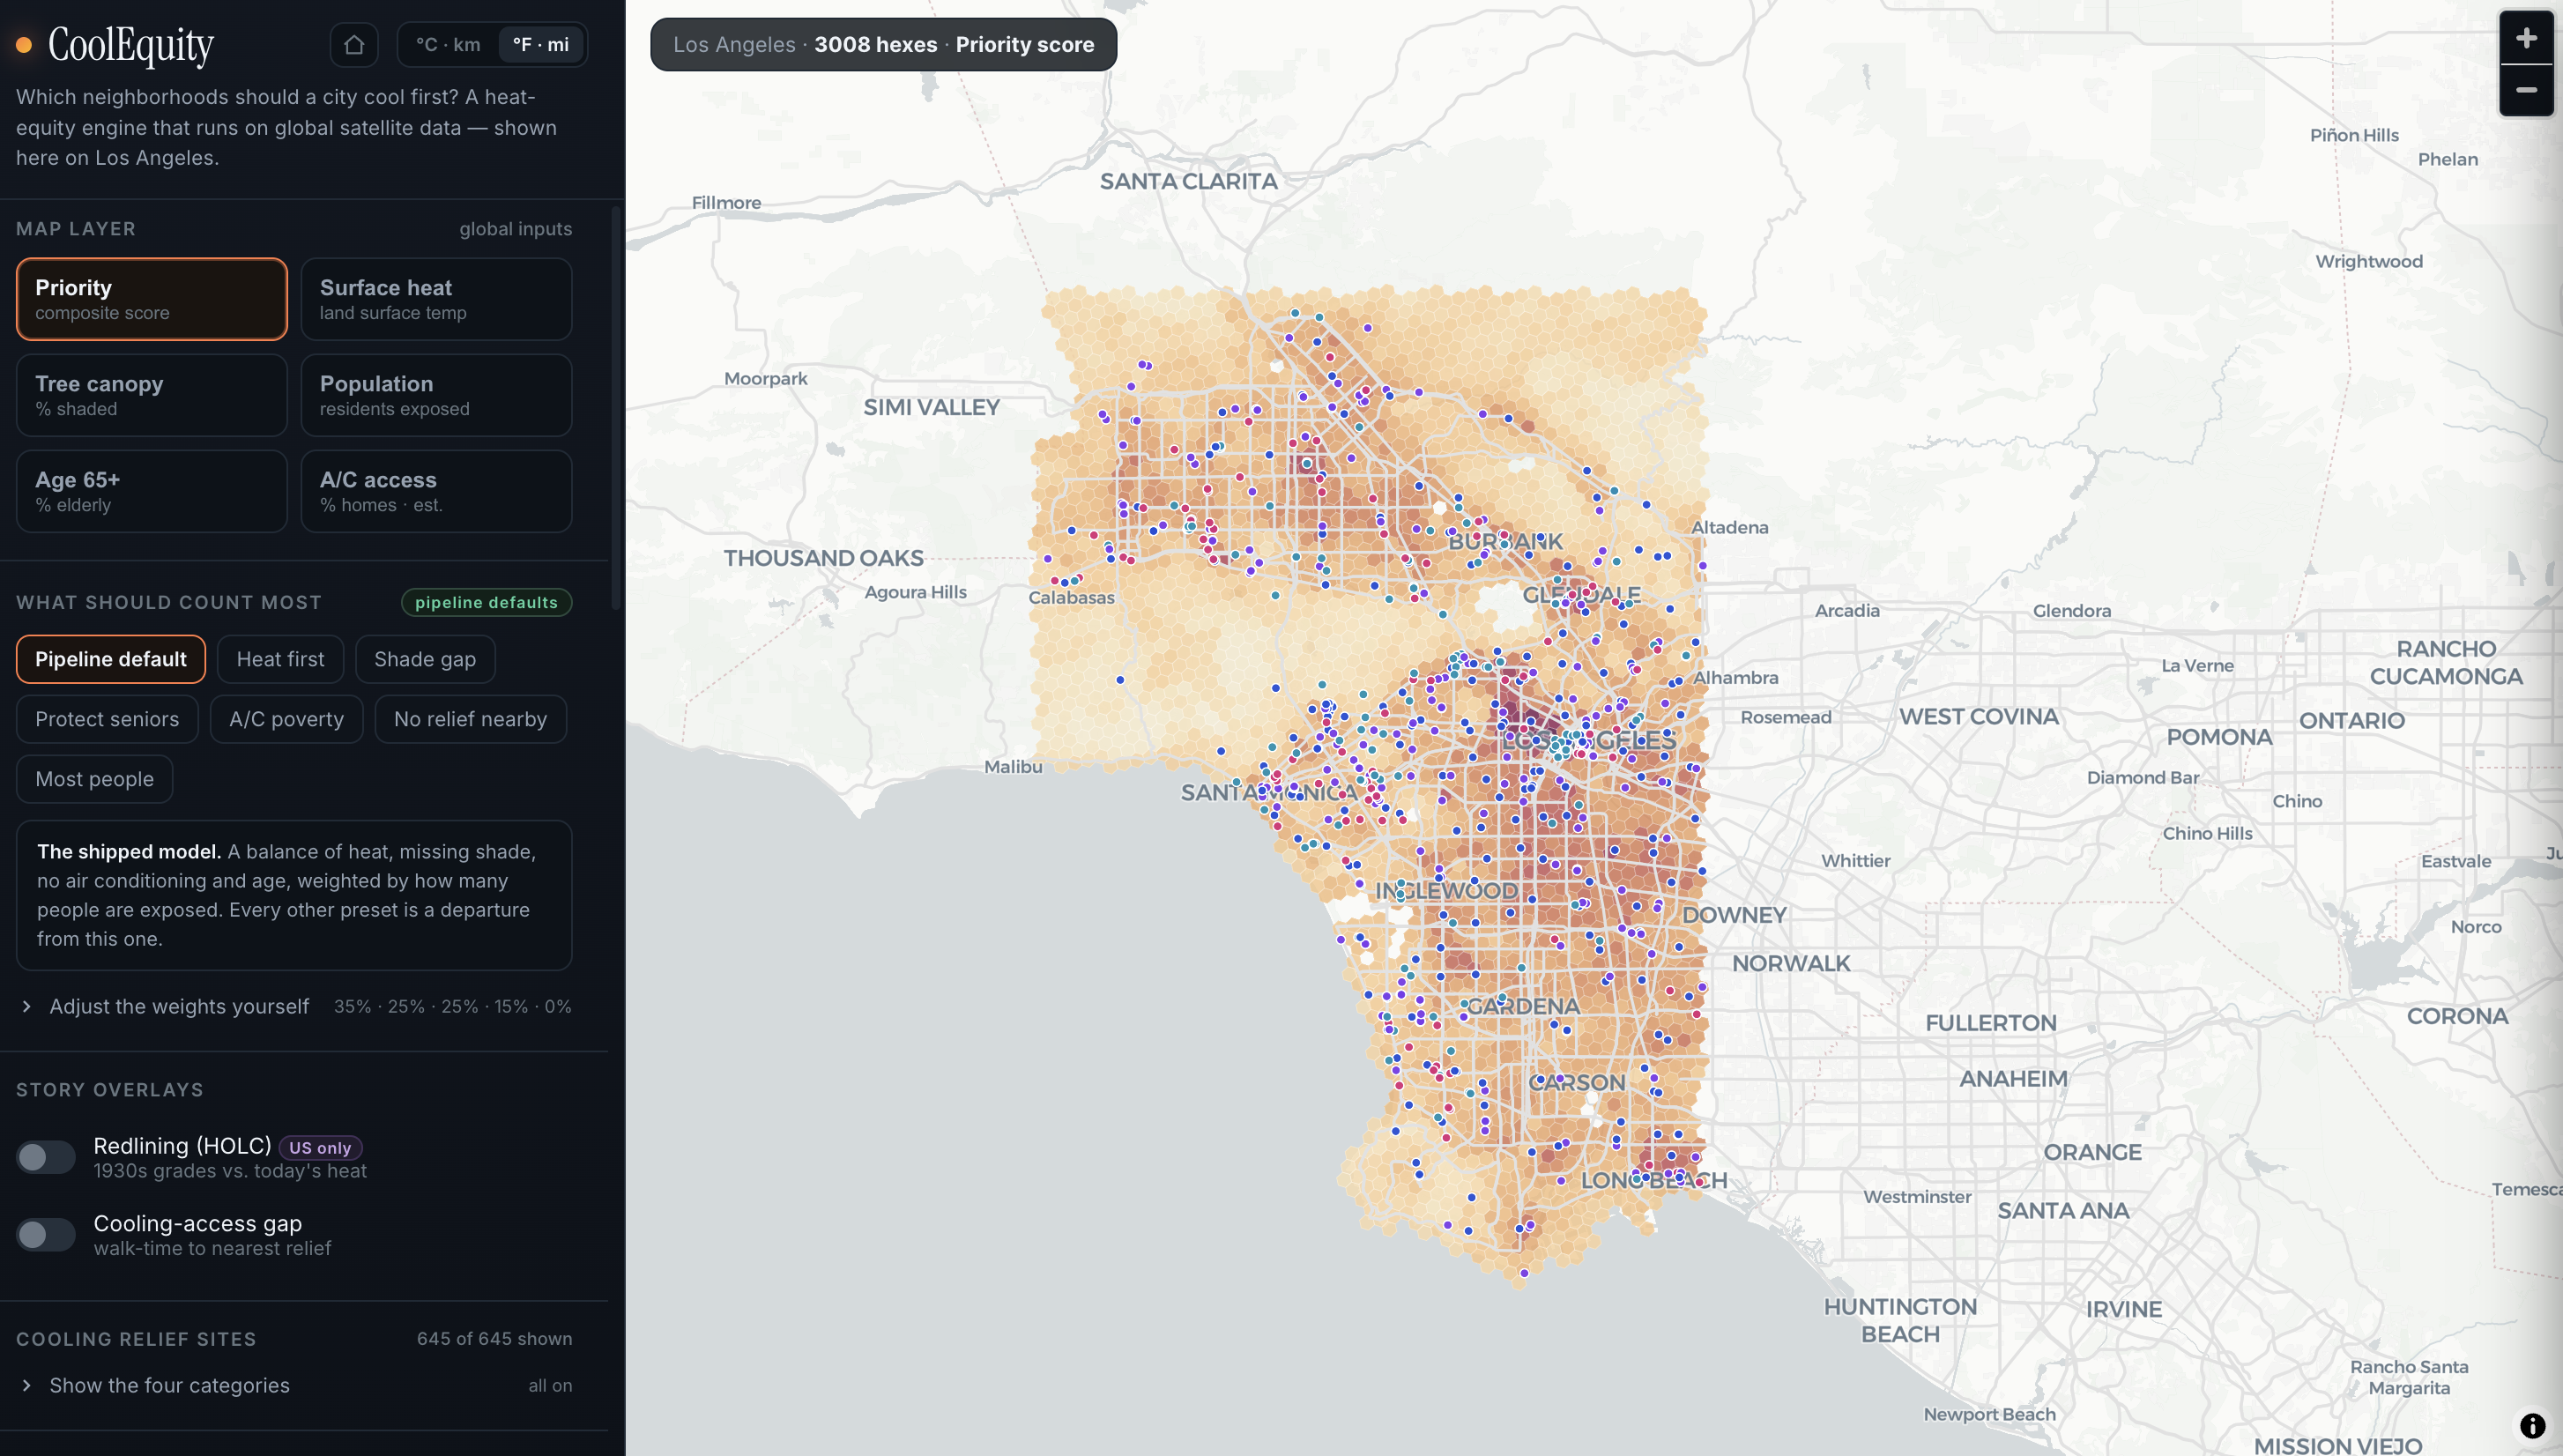
Map UI
-
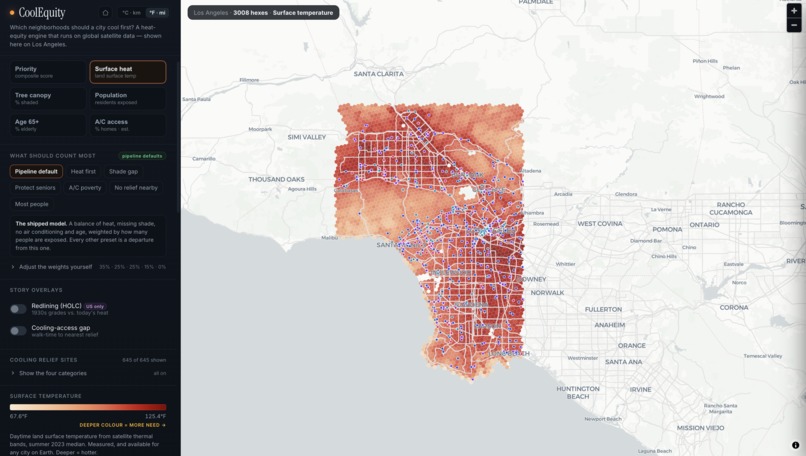
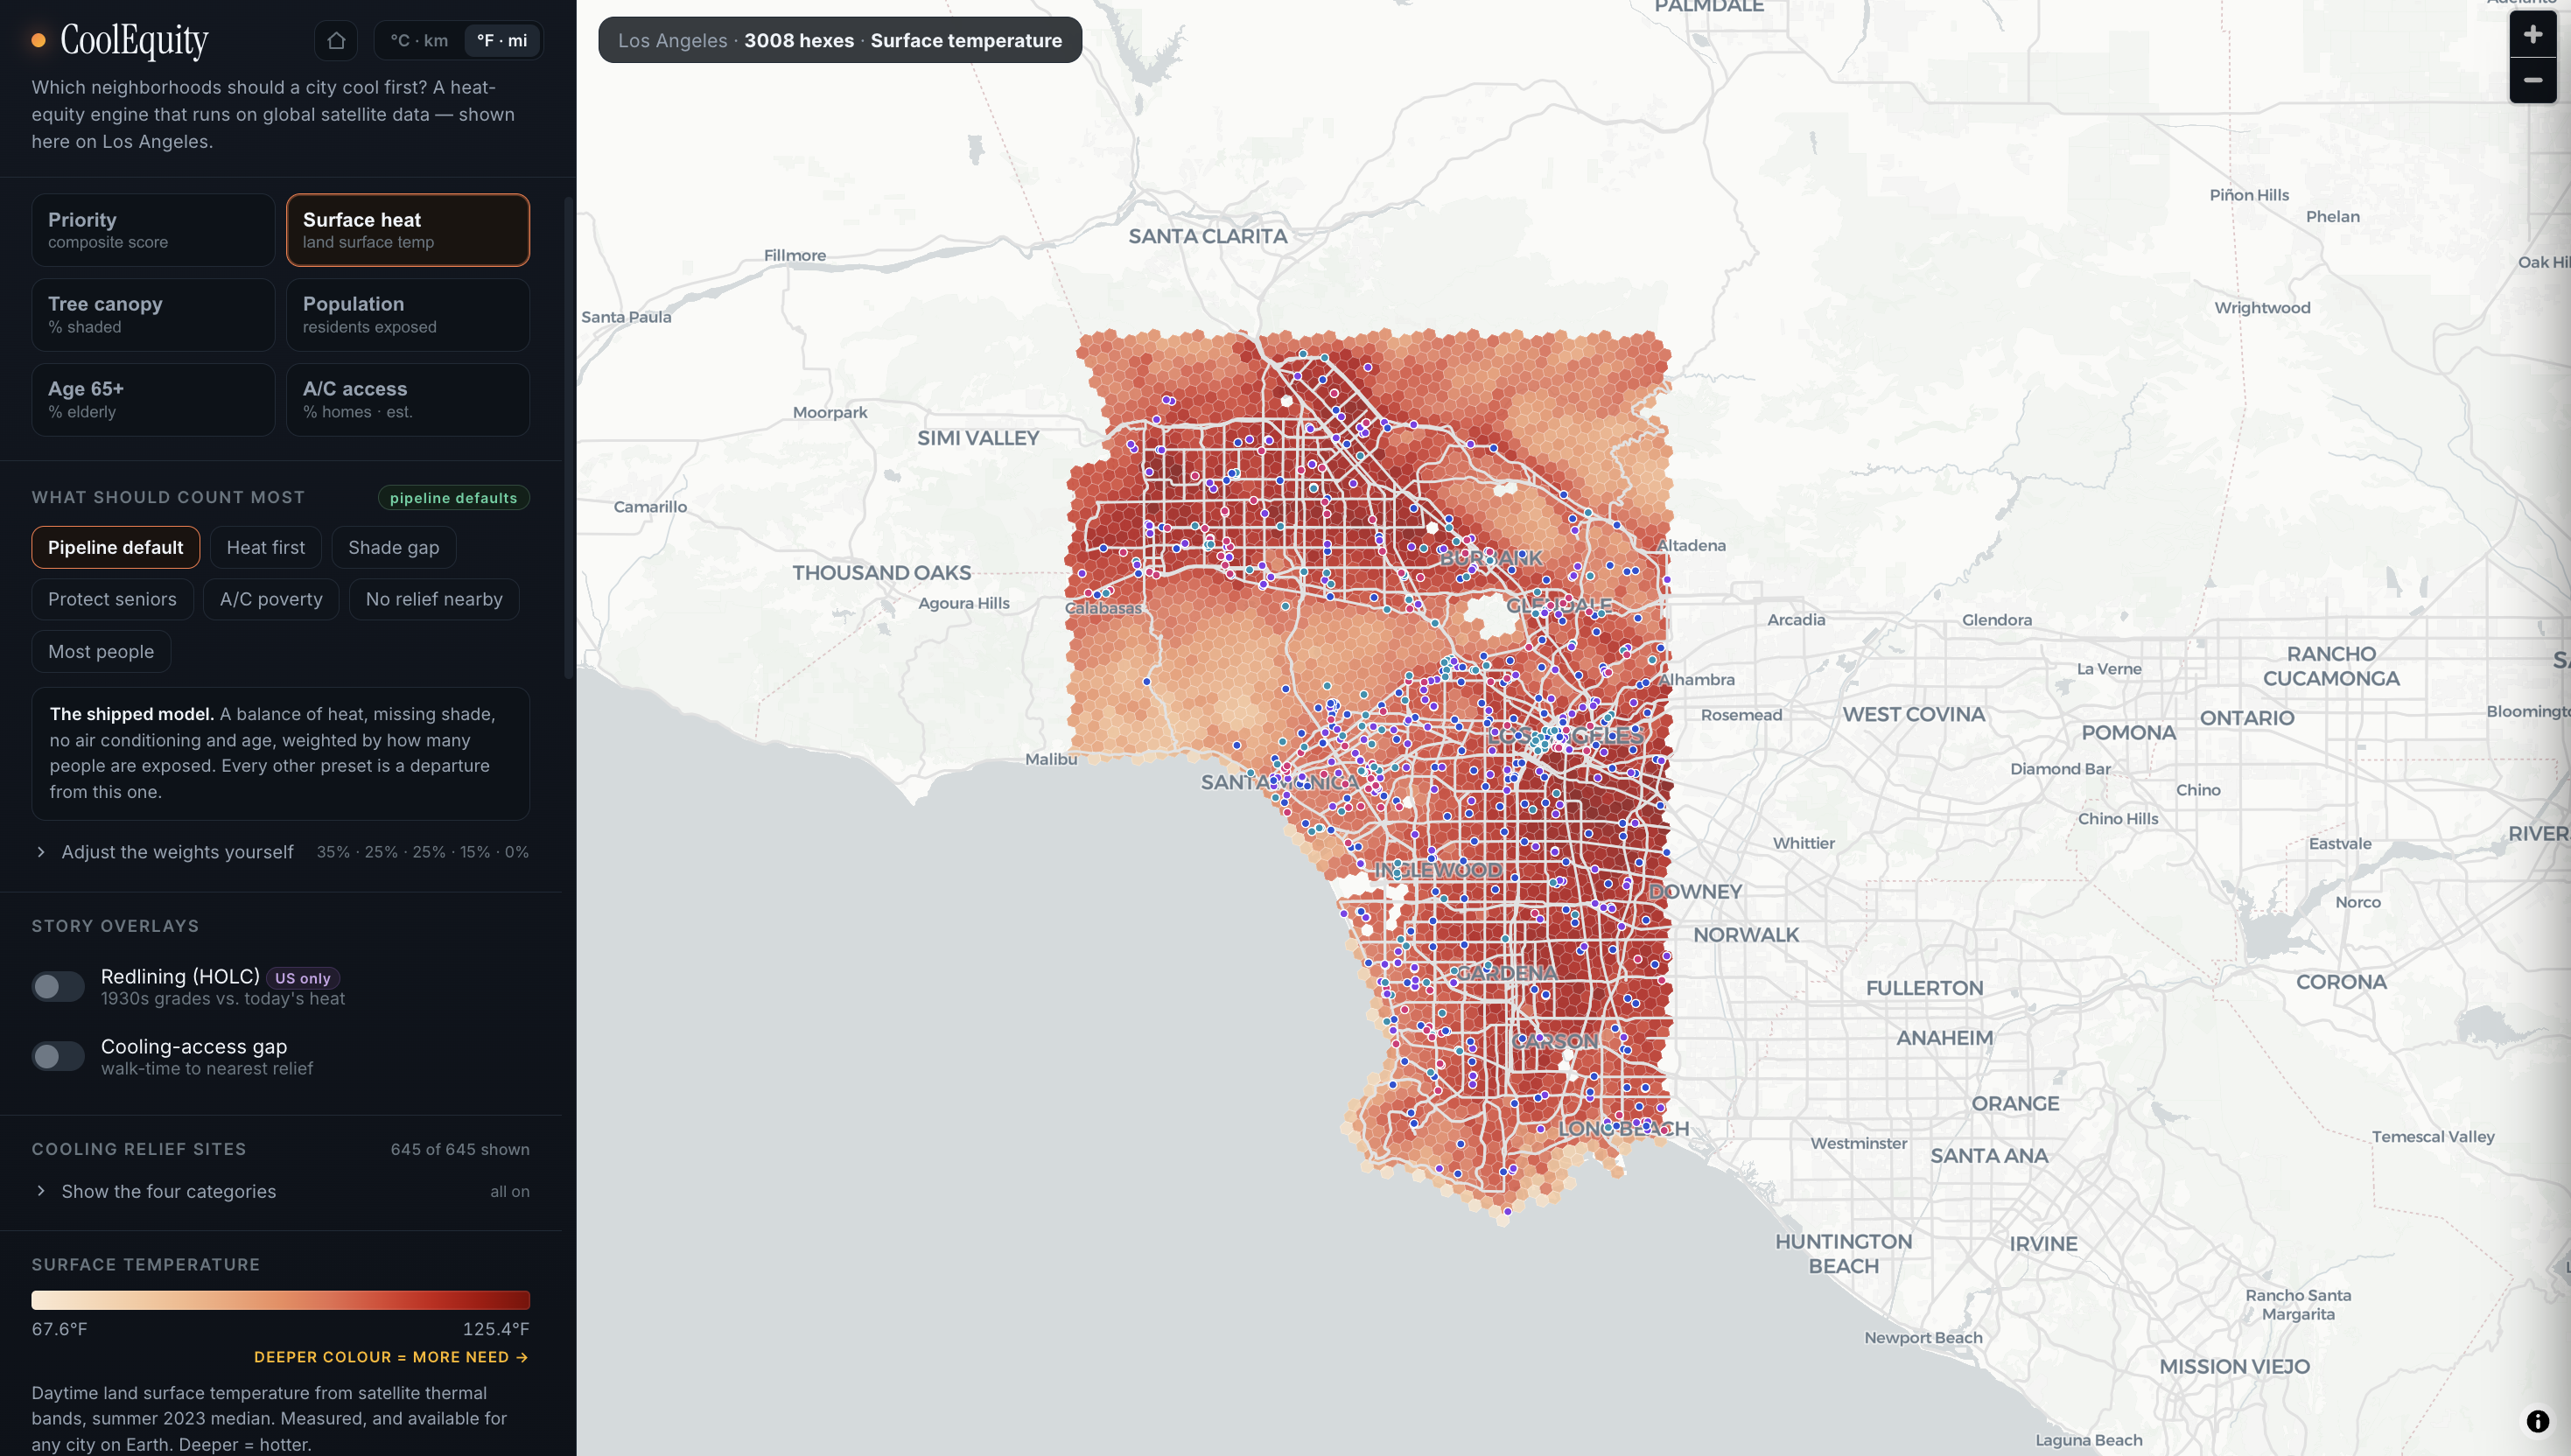
Toggle Map Layers
-
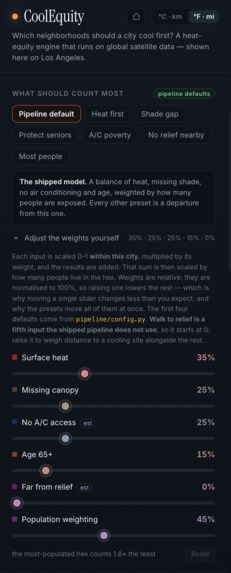
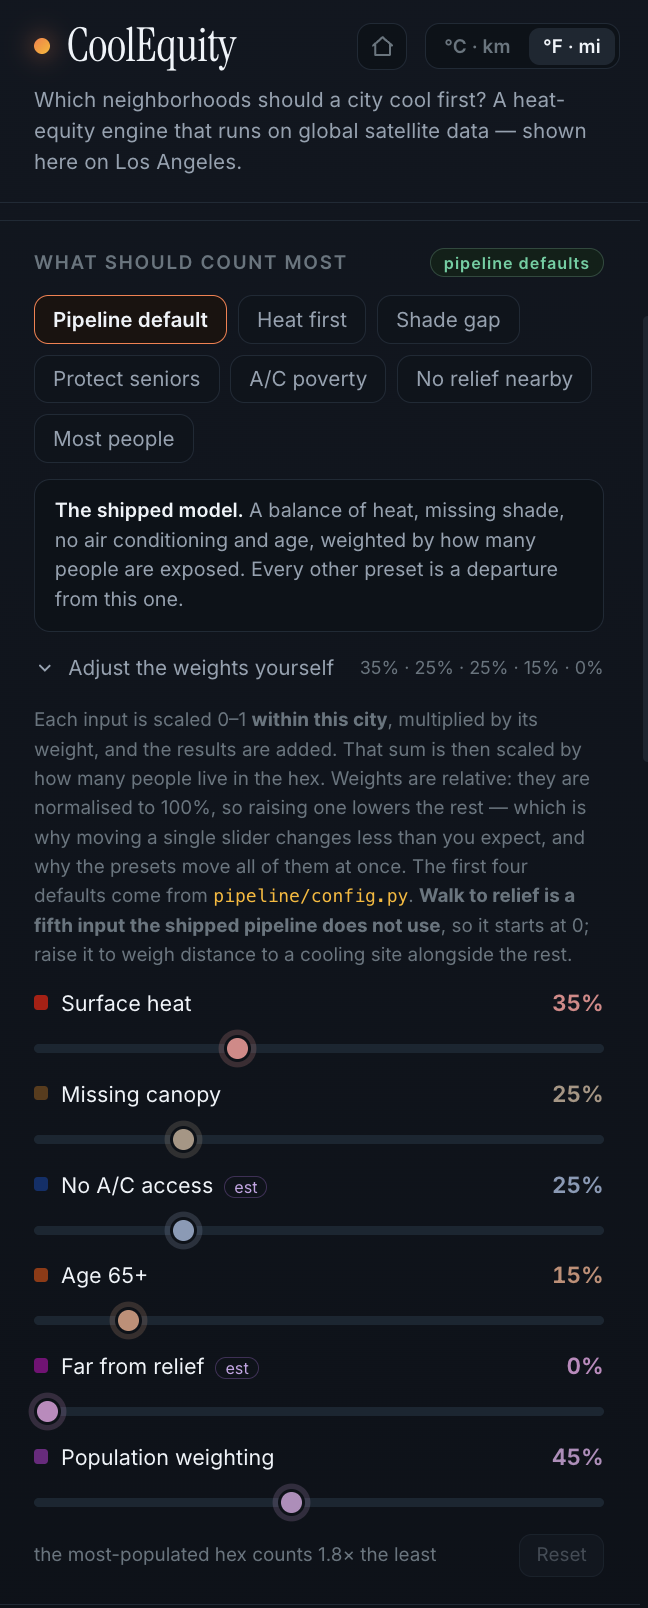
Tune priorities to reveal where investment is needed most
-
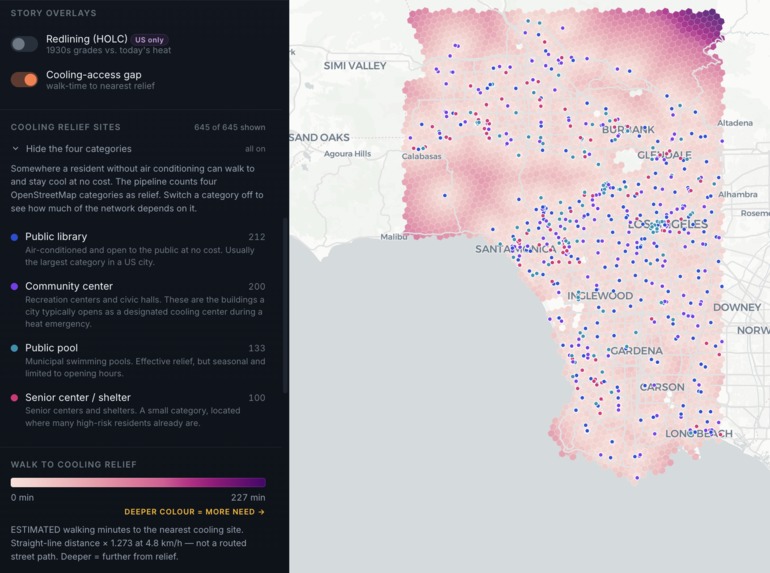
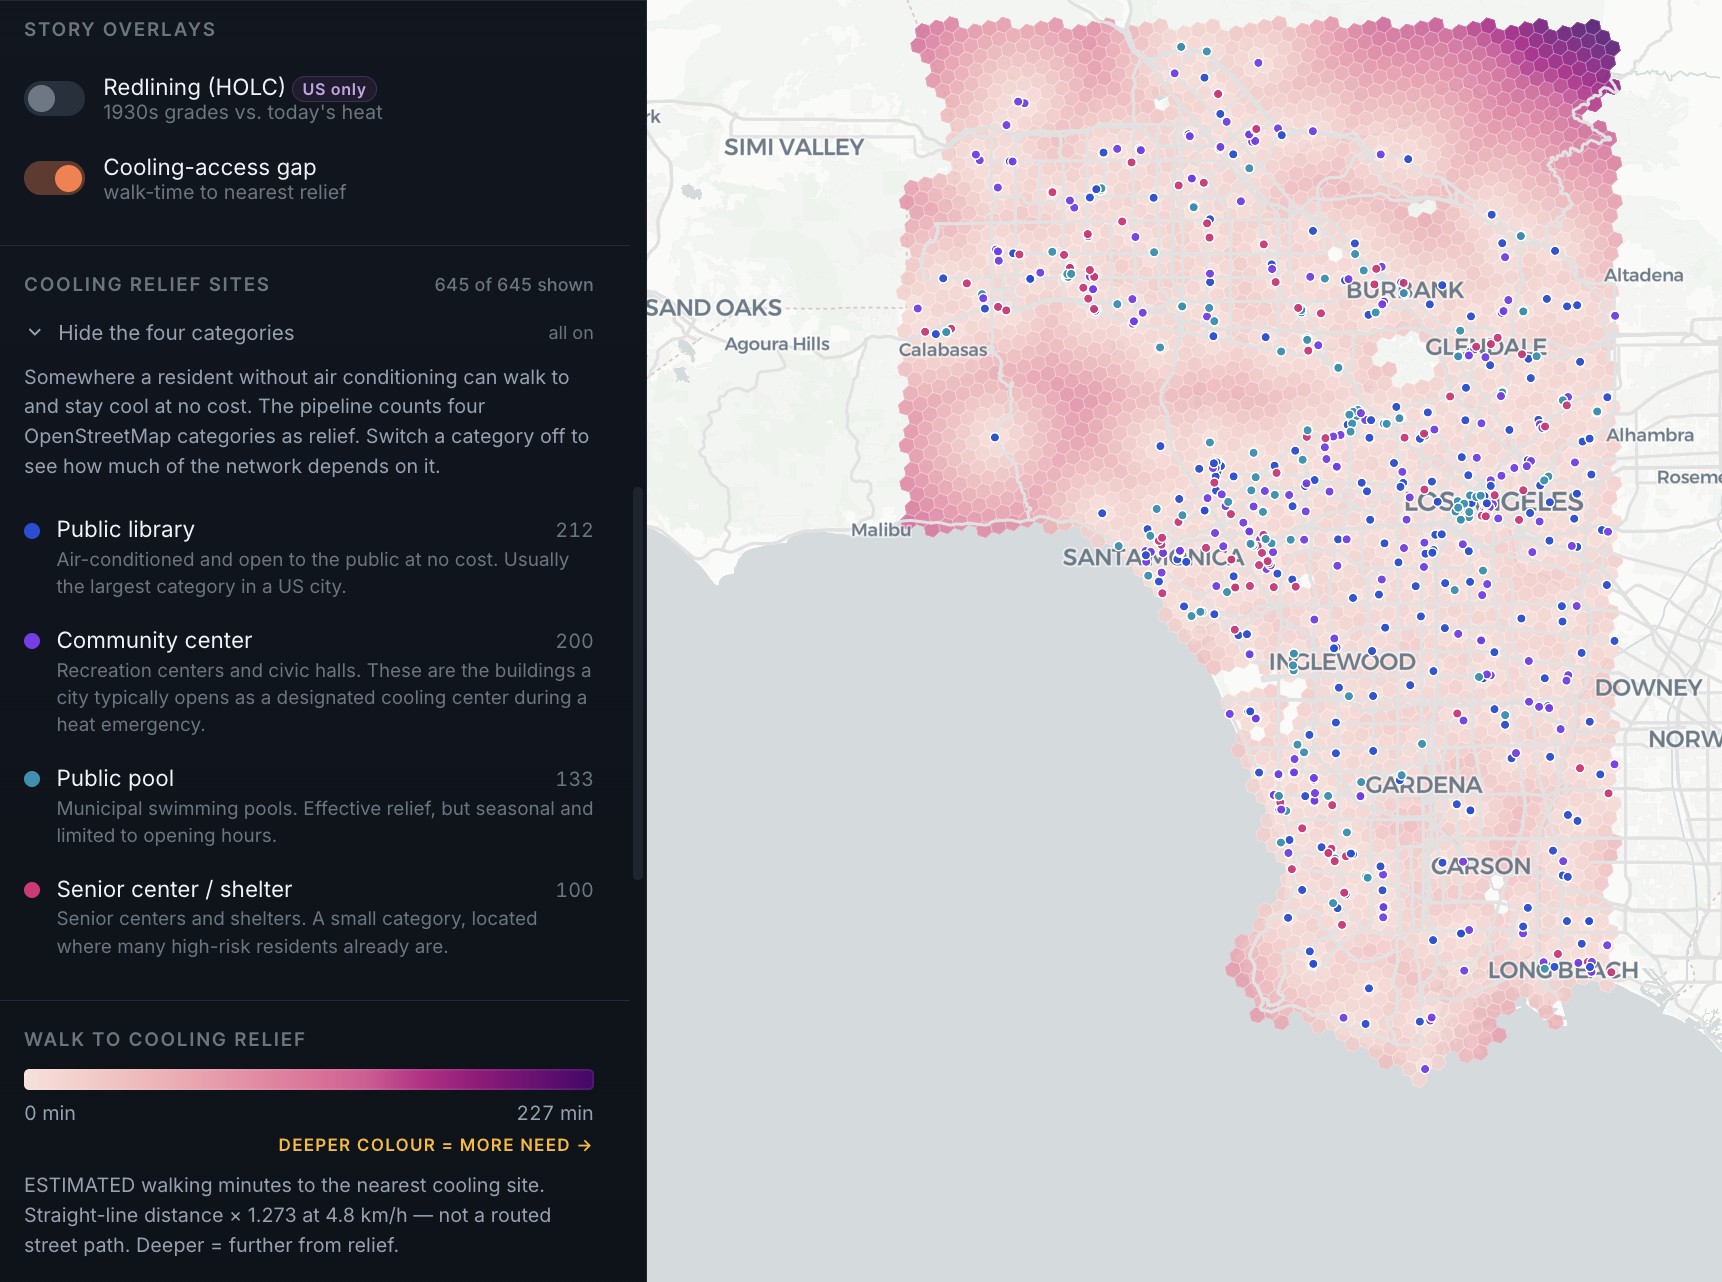
View distance from cooling centers
-
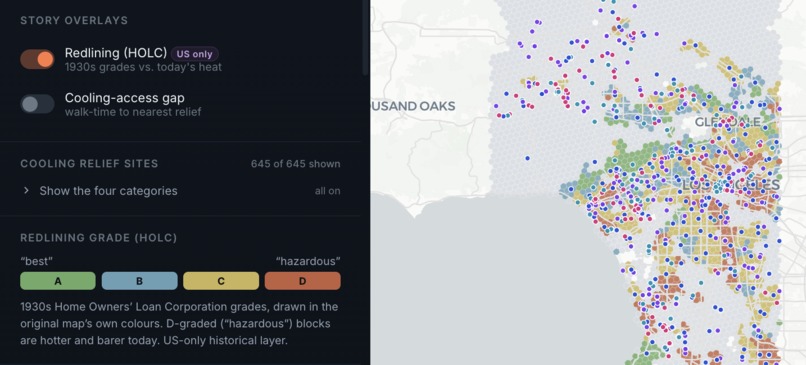
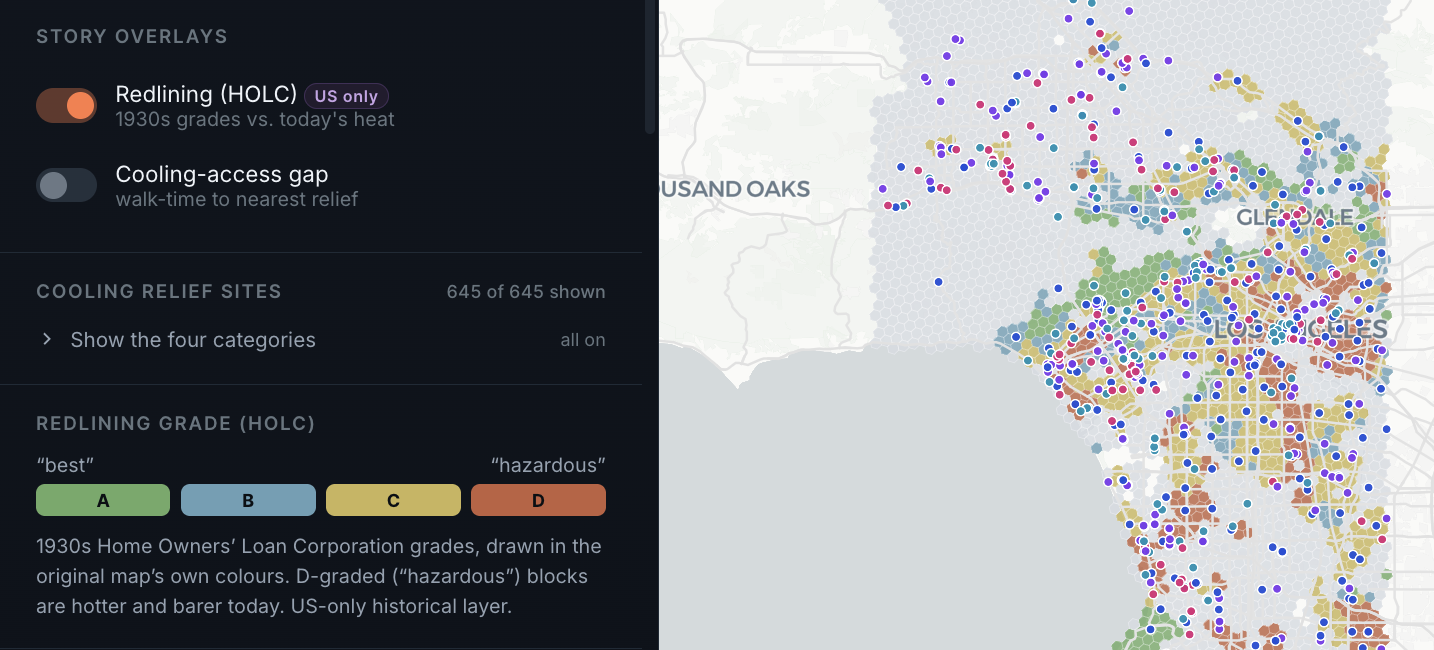
Compare historical data to present day
-
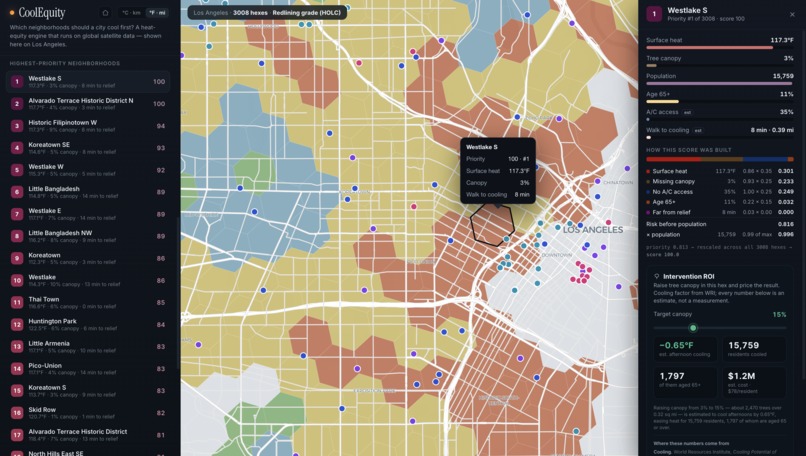
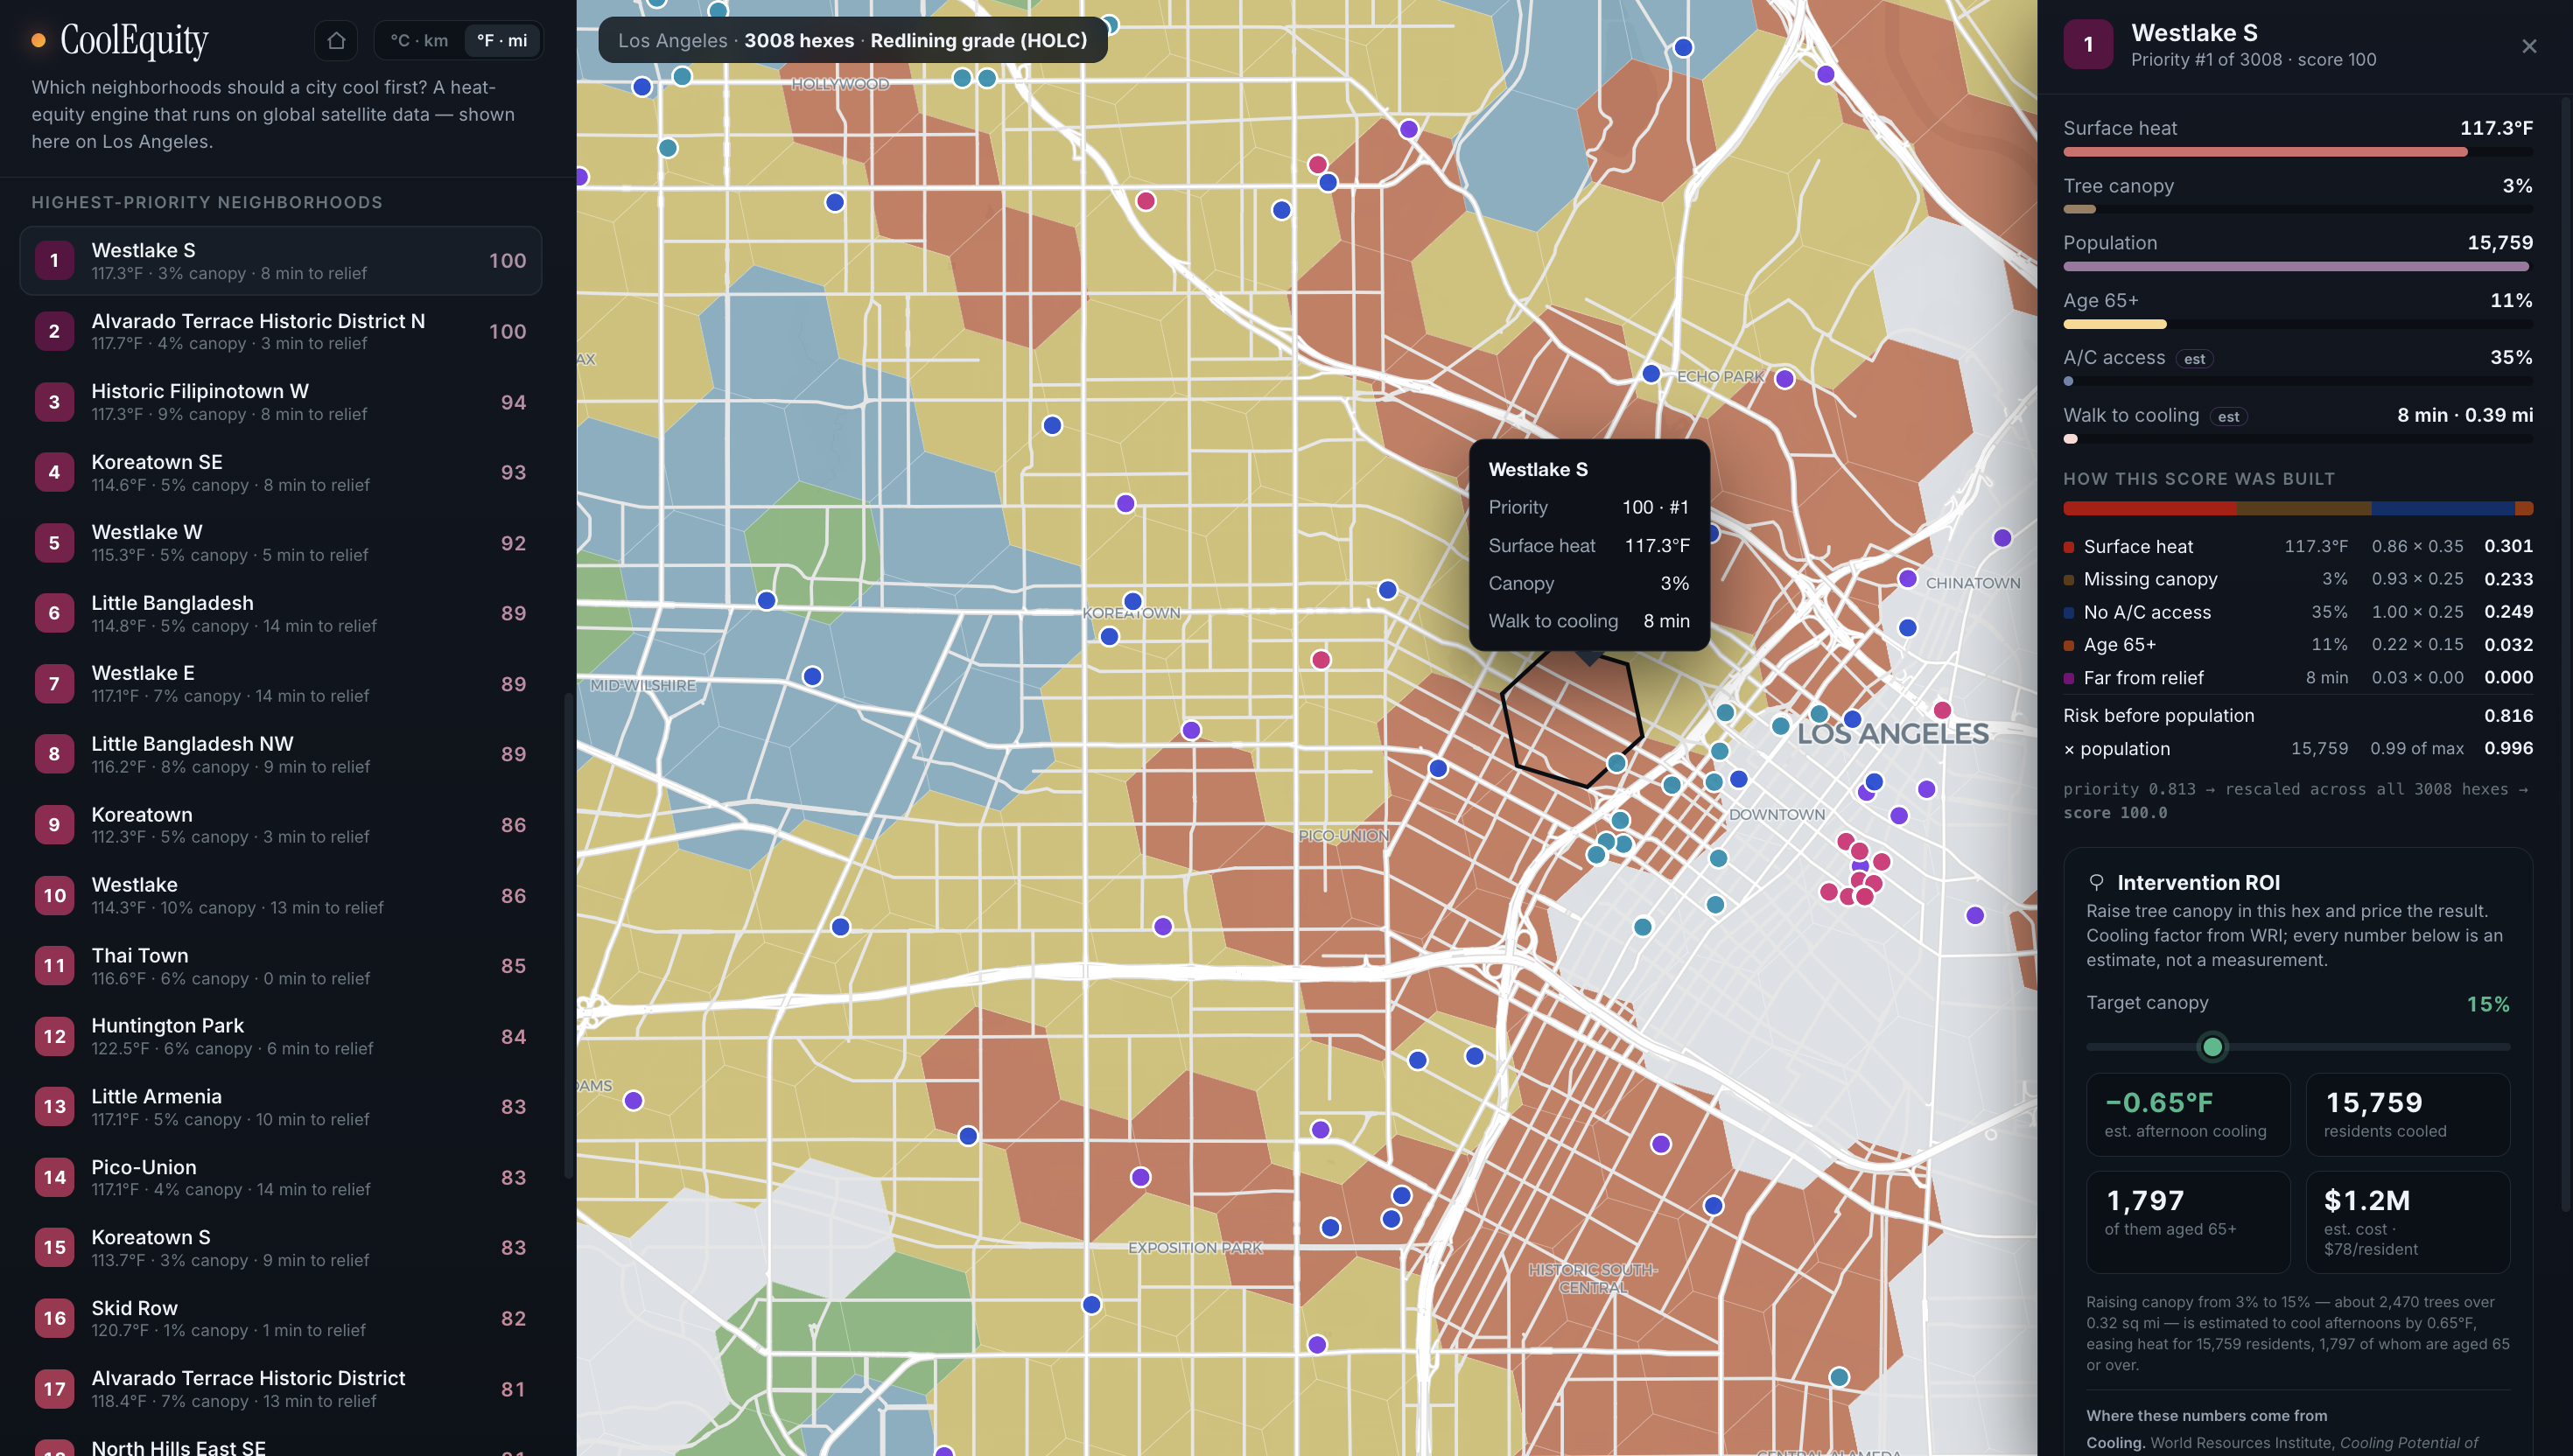
Get individual inputs for each neighborhood
-
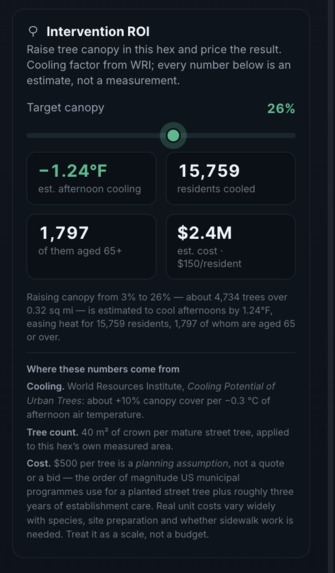
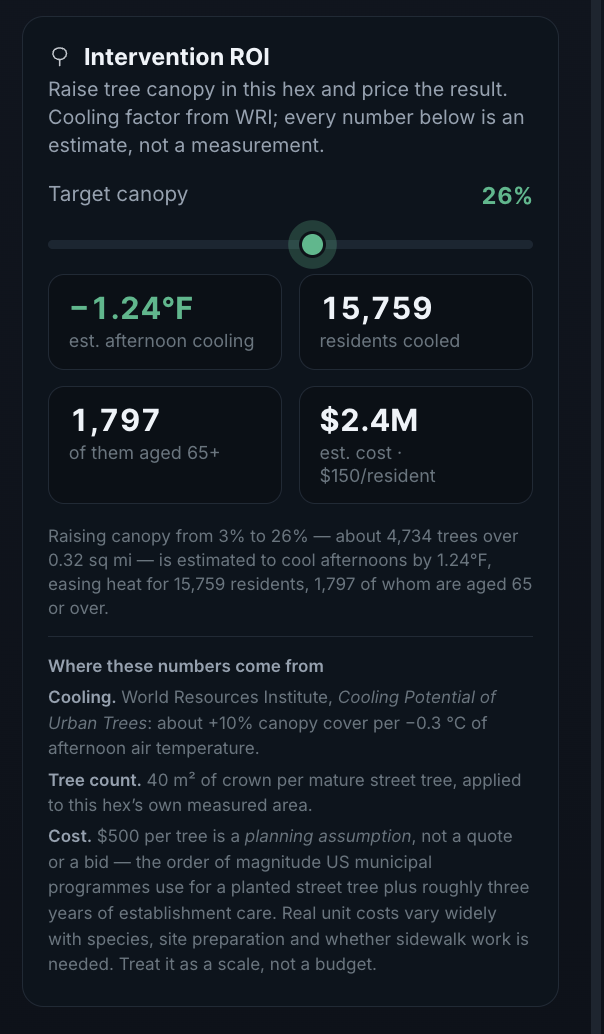
Model the potential impact of planting more trees
Inspiration
This summer, I took part in MIT Beaver Works’ Remote Sensing for Disaster Response program, which sparked my interest in using GIS and satellite data to address real-world problems. When I learned that heat is associated with an estimated 489,000 deaths worldwide each year, I realized how urgent this issue is—especially for communities with less shade and fewer resources to adapt. I created CoolEquity to combine my interest in GIS with my commitment to social good: helping underserved communities face extreme heat while encouraging cities to invest in trees and shade.
What it does
CoolEquity is a heat-equity mapper that prioritizes neighborhoods for cooling investment in a specific city. The LA map (which I prioritized for this hack) scores 3,008 H3 hexagons using satellite-measured land-surface temperature, satellite-derived vegetation, population, age, and a transparent socioeconomic A/C-access proxy. It also maps estimated access to potential cooling-relief sites and overlays historic HOLC redlining grades as context. Users can click any area to see the underlying inputs, how its priority score was calculated, and a tree-canopy planning scenario with estimated trees, cost, residents reached, and potential cooling impact. The model’s weights are interactive, so users can see how different policy priorities change the map.
How I built it
I built CoolEquity by creating a reproducible Python geospatial pipeline and a static MapLibre web app.
The pipeline: Generates an H3 resolution-8 analysis grid. Pulls summer 2023 Landsat 8/9 thermal imagery for land-surface temperature. Pulls Sentinel-2 imagery and calculates NDVI as a vegetation proxy. Masks clouds, creates seasonal median composites, and calculates zonal statistics for each hex. Area-weights ACS block-group population, income, and age data into the hex grid. Uses empirical-Bayes smoothing to prevent tiny-population areas from producing misleading age percentages. Finds nearby public amenities from OpenStreetMap and estimates walk time using a documented circuity adjustment. Joins HOLC polygons by majority area overlap. Produces a transparent, normalized priority score and static GeoJSON for the browser.
The front end runs without a backend. It vendors its map library and data locally, supports an offline map fallback, and recalculates rankings live when users adjust weights.
Challenges I ran into
A major challenge was bringing datasets with different formats, scales, and boundaries onto the same H3 hex grid. This involved overlaying satellite rasters, Census block groups, historic HOLC polygons, and OpenStreetMap amenities while filtering cloud-contaminated imagery, unpopulated areas, duplicate sites, and unreliable small-population percentages. Another challenge was choosing useful data without overstating what it could prove. The interface also needed to make a complex scoring model understandable quickly, using the map, rankings, and detail panel to show both the results and the assumptions behind them.
Accomplishments that I'm proud of
I’m proud of getting a working, interactive heat-equity tool built from real geospatial data. I’m also proud of working through the technical issues that came up along the way and ending with a tool that clearly shows why an area ranks highly, lets users explore different priorities, and estimates the potential impact of adding trees. Most importantly, I’m proud that it has real potential to help make cooling investments fairer.
What I learned
Building CoolEquity taught me how to combine different geographic datasets into one analysis: area-weighting Census block-group data into H3 hexagons, overlaying HOLC polygons, and joining OpenStreetMap amenities to the same grid. I learned how to make a weighted score a policy choice, as factor weights can change which neighborhoods rank first, so I made those decisions transparent and interactive. I also gained experience processing Landsat thermal imagery and Sentinel-2 NDVI, including cloud masking, seasonal composites, and raster-to-hex statistics. Debugging generated code pushed me to check the data behind every result and be clear about what was measured versus estimated.
What's next for CoolEquity
Next, I want to replace the A/C proxy with locally validated housing, utility, or survey data; verify cooling-relief sites for hours, capacity, cost, accessibility, and actual air conditioning; and add routed walking access instead of a distance-based estimate. I also want to add plantable land and parcel constraints so intervention estimates become site-aware. Finally, I plan to adapt the pipeline for additional cities using local demographic data and locally meaningful equity overlays, expanding CoolEquity into a global heat-equity tool.
Built With
- geojson
- geopandas
- html/css
- javascript
- landsat
- maplibre
- numpy
- openstreetmap
- pandas
- planetary-computer
- python
- rasterio
- sentinel-2
- shapely

Log in or sign up for Devpost to join the conversation.