Inspiration
Cities receive thousands of service requests, but a list of complaints doesn’t show where work is concentrated, which repairs might be urgent, or how crews could reach them. We wanted to explore how a map and transparent dispatch rules could help an operator make those tradeoffs visible, while recognizing that complaint volume alone does not measure community need.
What it does
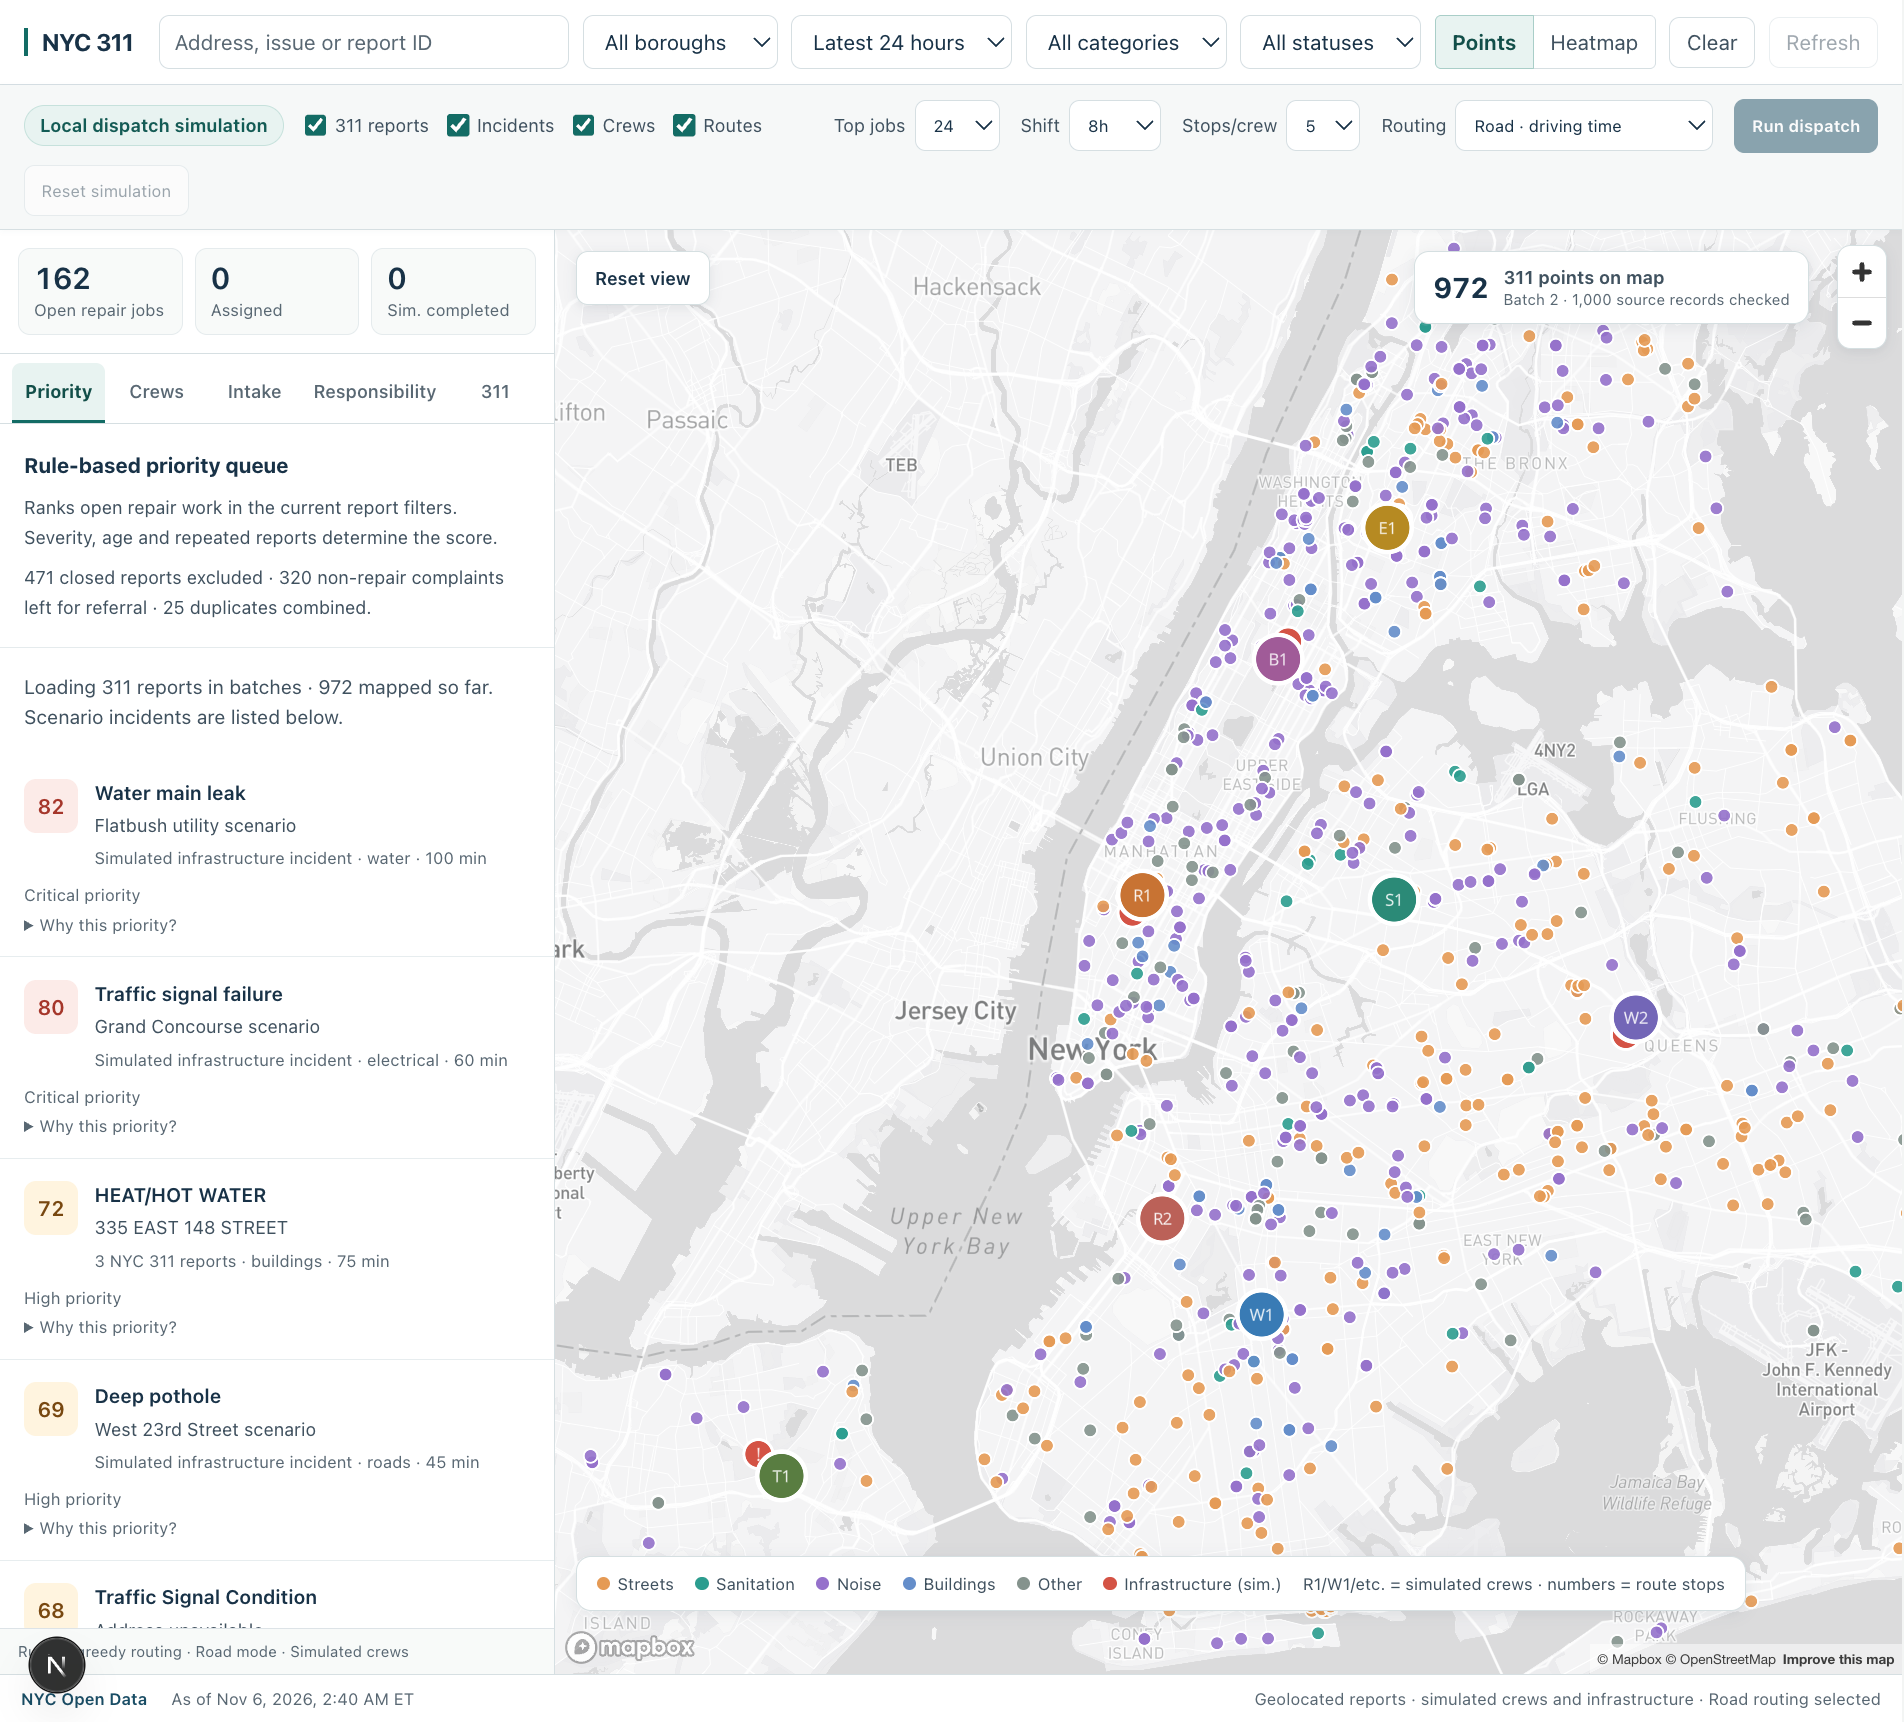
CityScope 311 maps recent NYC 311 reports with valid location coordinates. Operators can filter by borough, date range, category, and status, and view reports as points or a heatmap.
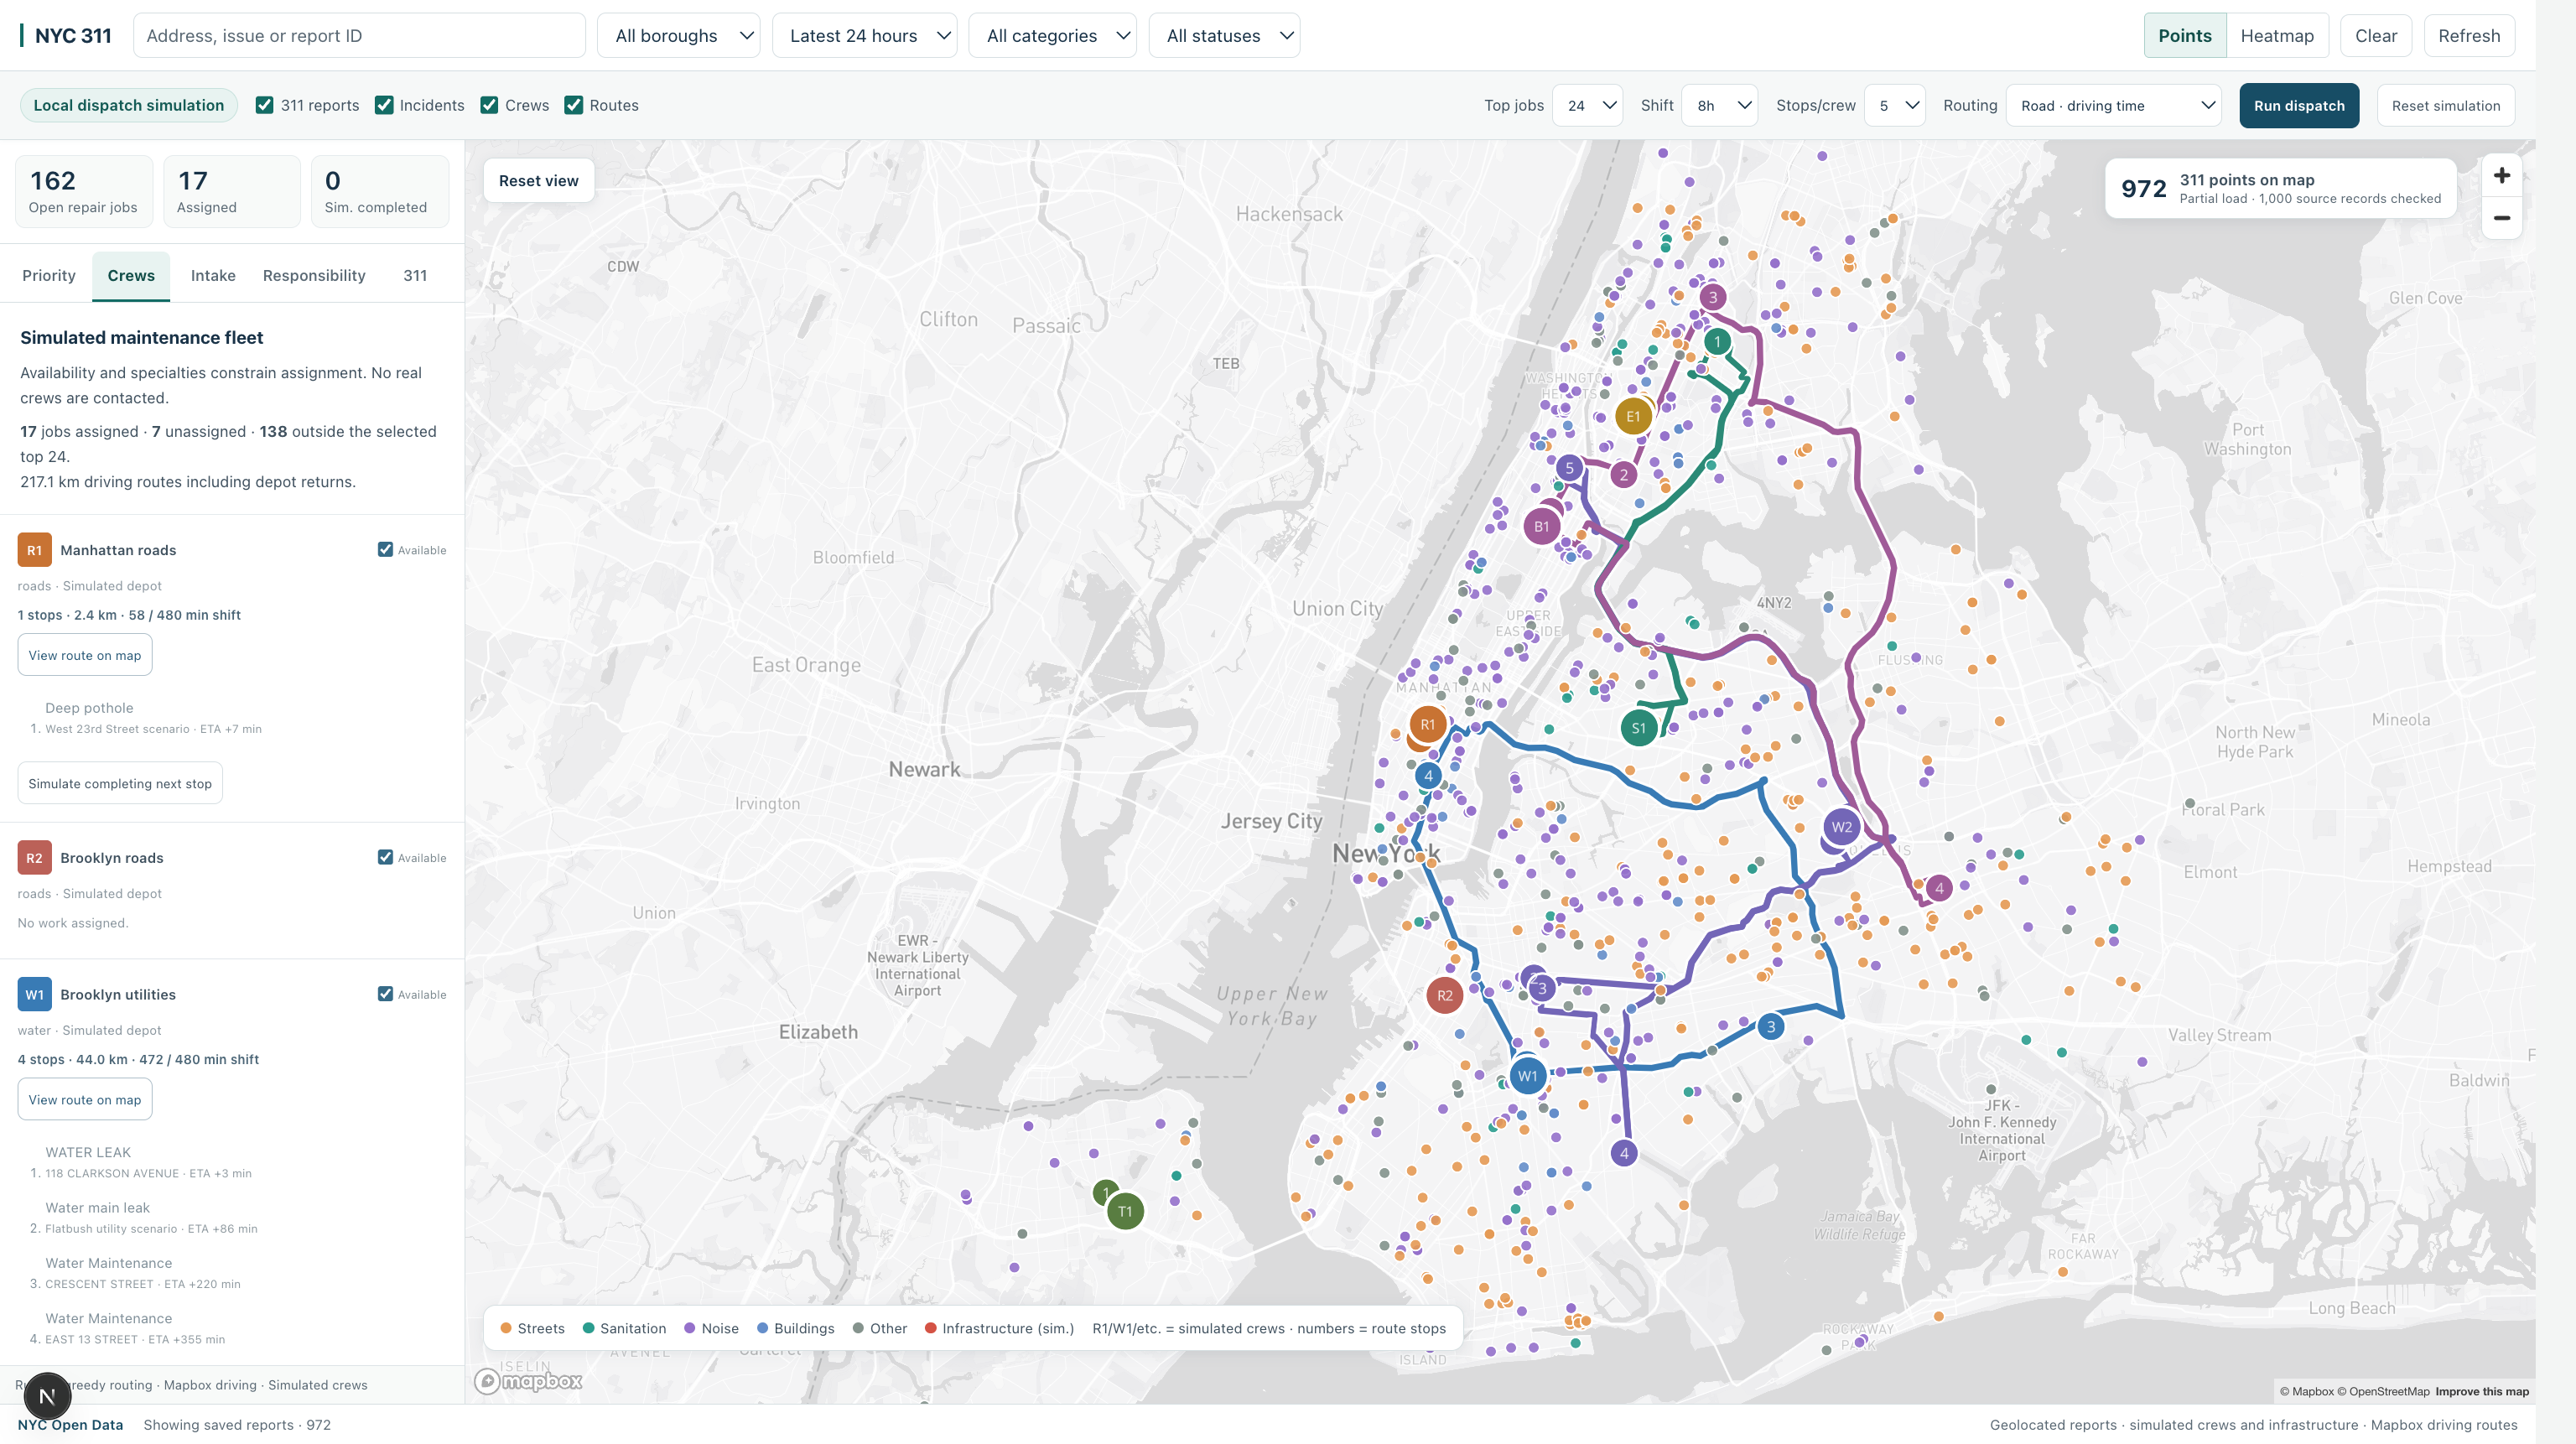
A rules-based priority queue ranks repairable work using severity, age, and repeated reports at a site. Operators can run a dispatch simulation that assigns jobs to available crews based on their specialties and shift limits, then builds routes using road travel times and geometry.
The tool also includes simulated infrastructure incidents and crews, an optional local AI intake that proposes a classification for operator review, and a responsibility panel showing planned coverage and unassigned work by community board.
How we built it
We built the interface with Next.js and React, using Mapbox GL JS for the map. The app fetches public NYC 311 records from NYC Open Data, checks coordinates, and loads results in batches so points can appear while more records are fetched.
Dispatch logic groups similar reports at the same site, scores repairable jobs with visible rules, and assigns them to compatible simulated crews. For road-mode routing, Mapbox Matrix provides travel times and Directions provides route geometry. The optional AI intake uses a local Ollama model when available; a separate rules-based suggestion is available too.
Challenges we ran into
The public 311 feed can be slow or temporarily unavailable, and not every record has a usable location. We had to make loading progress visible and distinguish plotted reports from the source records checked.
Routing also involves more than drawing lines: crews have different specialties, jobs take time to complete, and a route has to fit within a shift. We made the simulation’s assumptions visible so estimated plans are easier to interpret.
Accomplishments that we're proud of
We brought public complaints, infrastructure scenarios, simulated crews, and road routes into one map. We’re proud that the priority queue explains its scores and that operators can review an optional intake proposal before adding it to the simulation. The responsibility view also surfaces waiting and unassigned work alongside neighborhood coverage.
What we learned
A useful operations tool needs to explain its assumptions, not just show a score or route. We also learned that public complaint data reflects reporting activity, which can vary across neighborhoods. A map of reports can support exploration, but it cannot establish which communities have the greatest need.
What's next for CityScope 311
We’d like to connect additional infrastructure datasets, improve reporting on incomplete and unlocated records, and evaluate coverage using appropriate population and service-need measures. We’d also like to add more realistic crew and repair constraints, and test the tool with people who work in city operations.
Built With
- geojson
- javascript
- mapbox-directions-api
- mapbox-gl-js
- mapbox-matrix-api
- next.js
- nyc-open-data
- ollama
- openstreetmap
- react
- socrata-api
