-
-
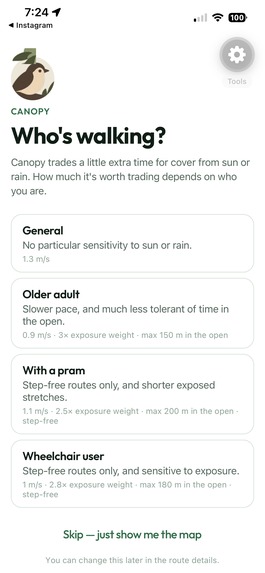
Home Screen
-
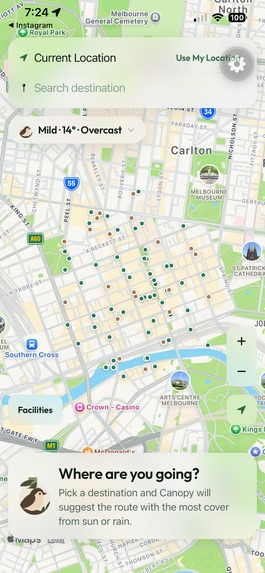
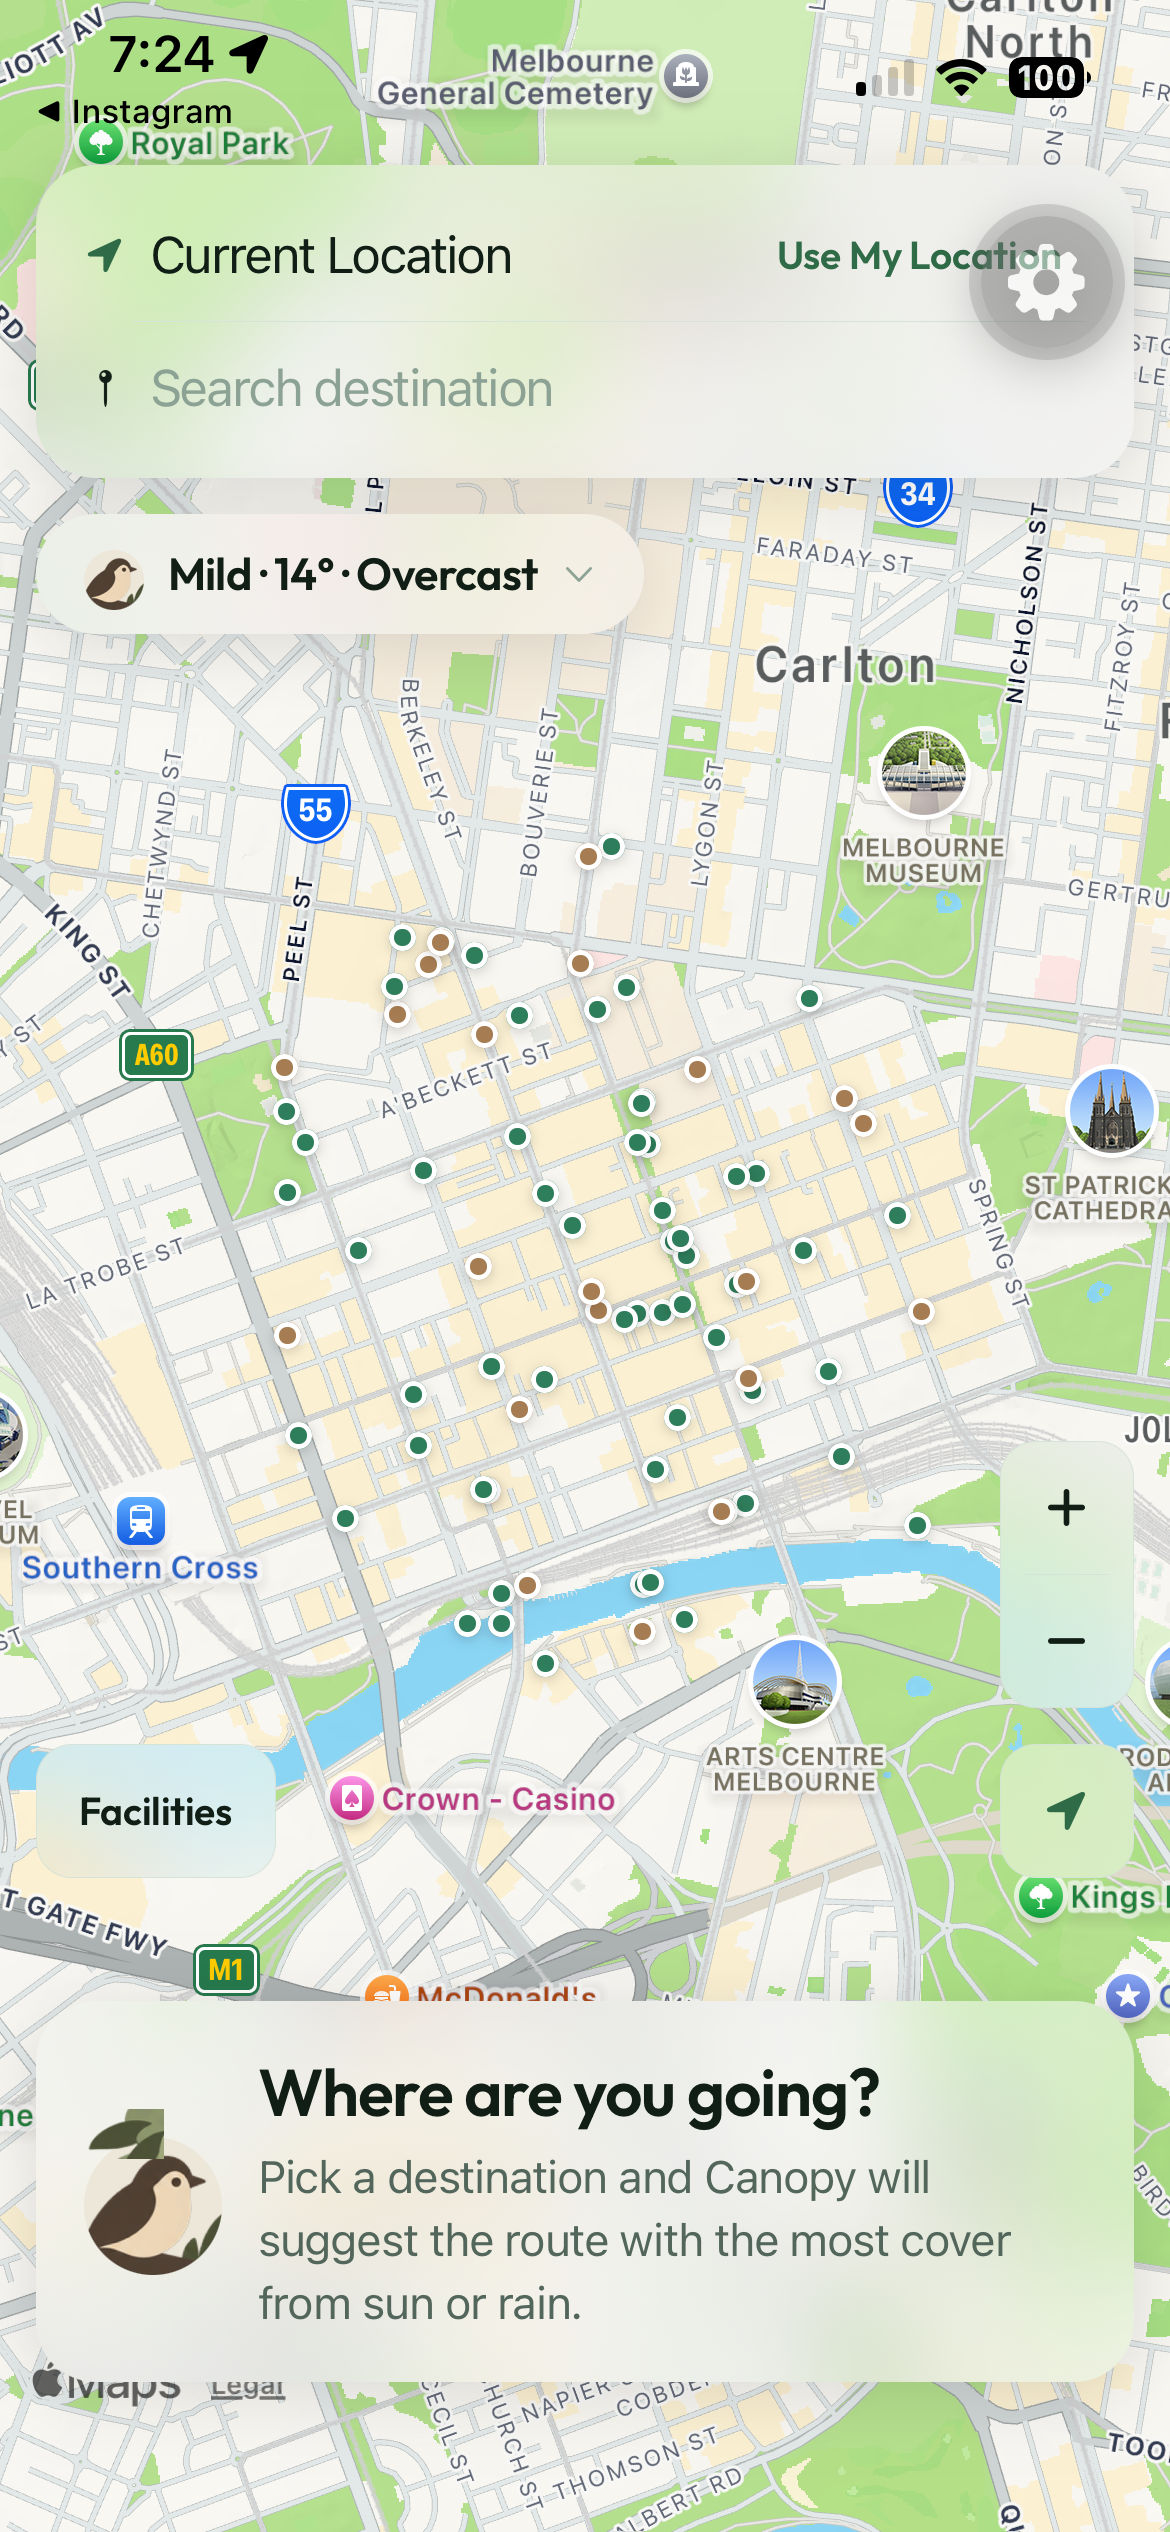
Map
-
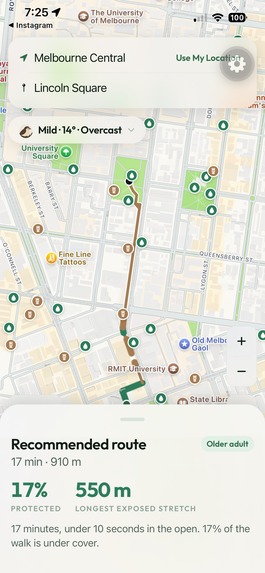
Routing
-
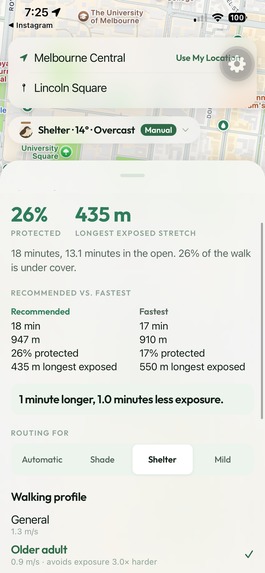
-
Inspiration
It's a hot summer day. It's 40 degrees outside, and you need to get from your apartment to work. It's only a 10 minute walk, but the sun is relentless, so driving feels like the easier option. Everyone else has the same idea, traffic builds up, and you still end up late. More cars mean more heat and emissions in a city already struggling with extreme temperatures. But what if you could have walked instead, not directly under the sun, but along a route chosen to keep you as covered as possible? That became the starting point for Canopy. Melbourne already has two kinds of cover: trees, and the awnings, verandahs and arcades woven through much of the CBD. People use them instinctively, choosing the shady side of the street in summer or staying close to shopfronts when it rains. Most navigation apps, however, give you the same route regardless of weather. We wanted to build a map designed around the experience of actually walking through the city.
What it does
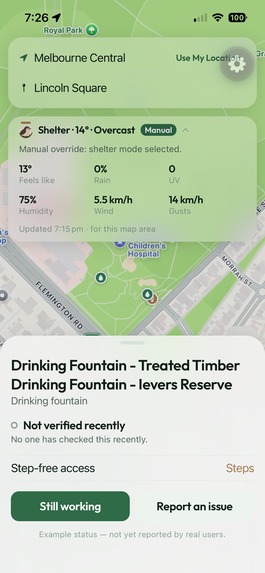
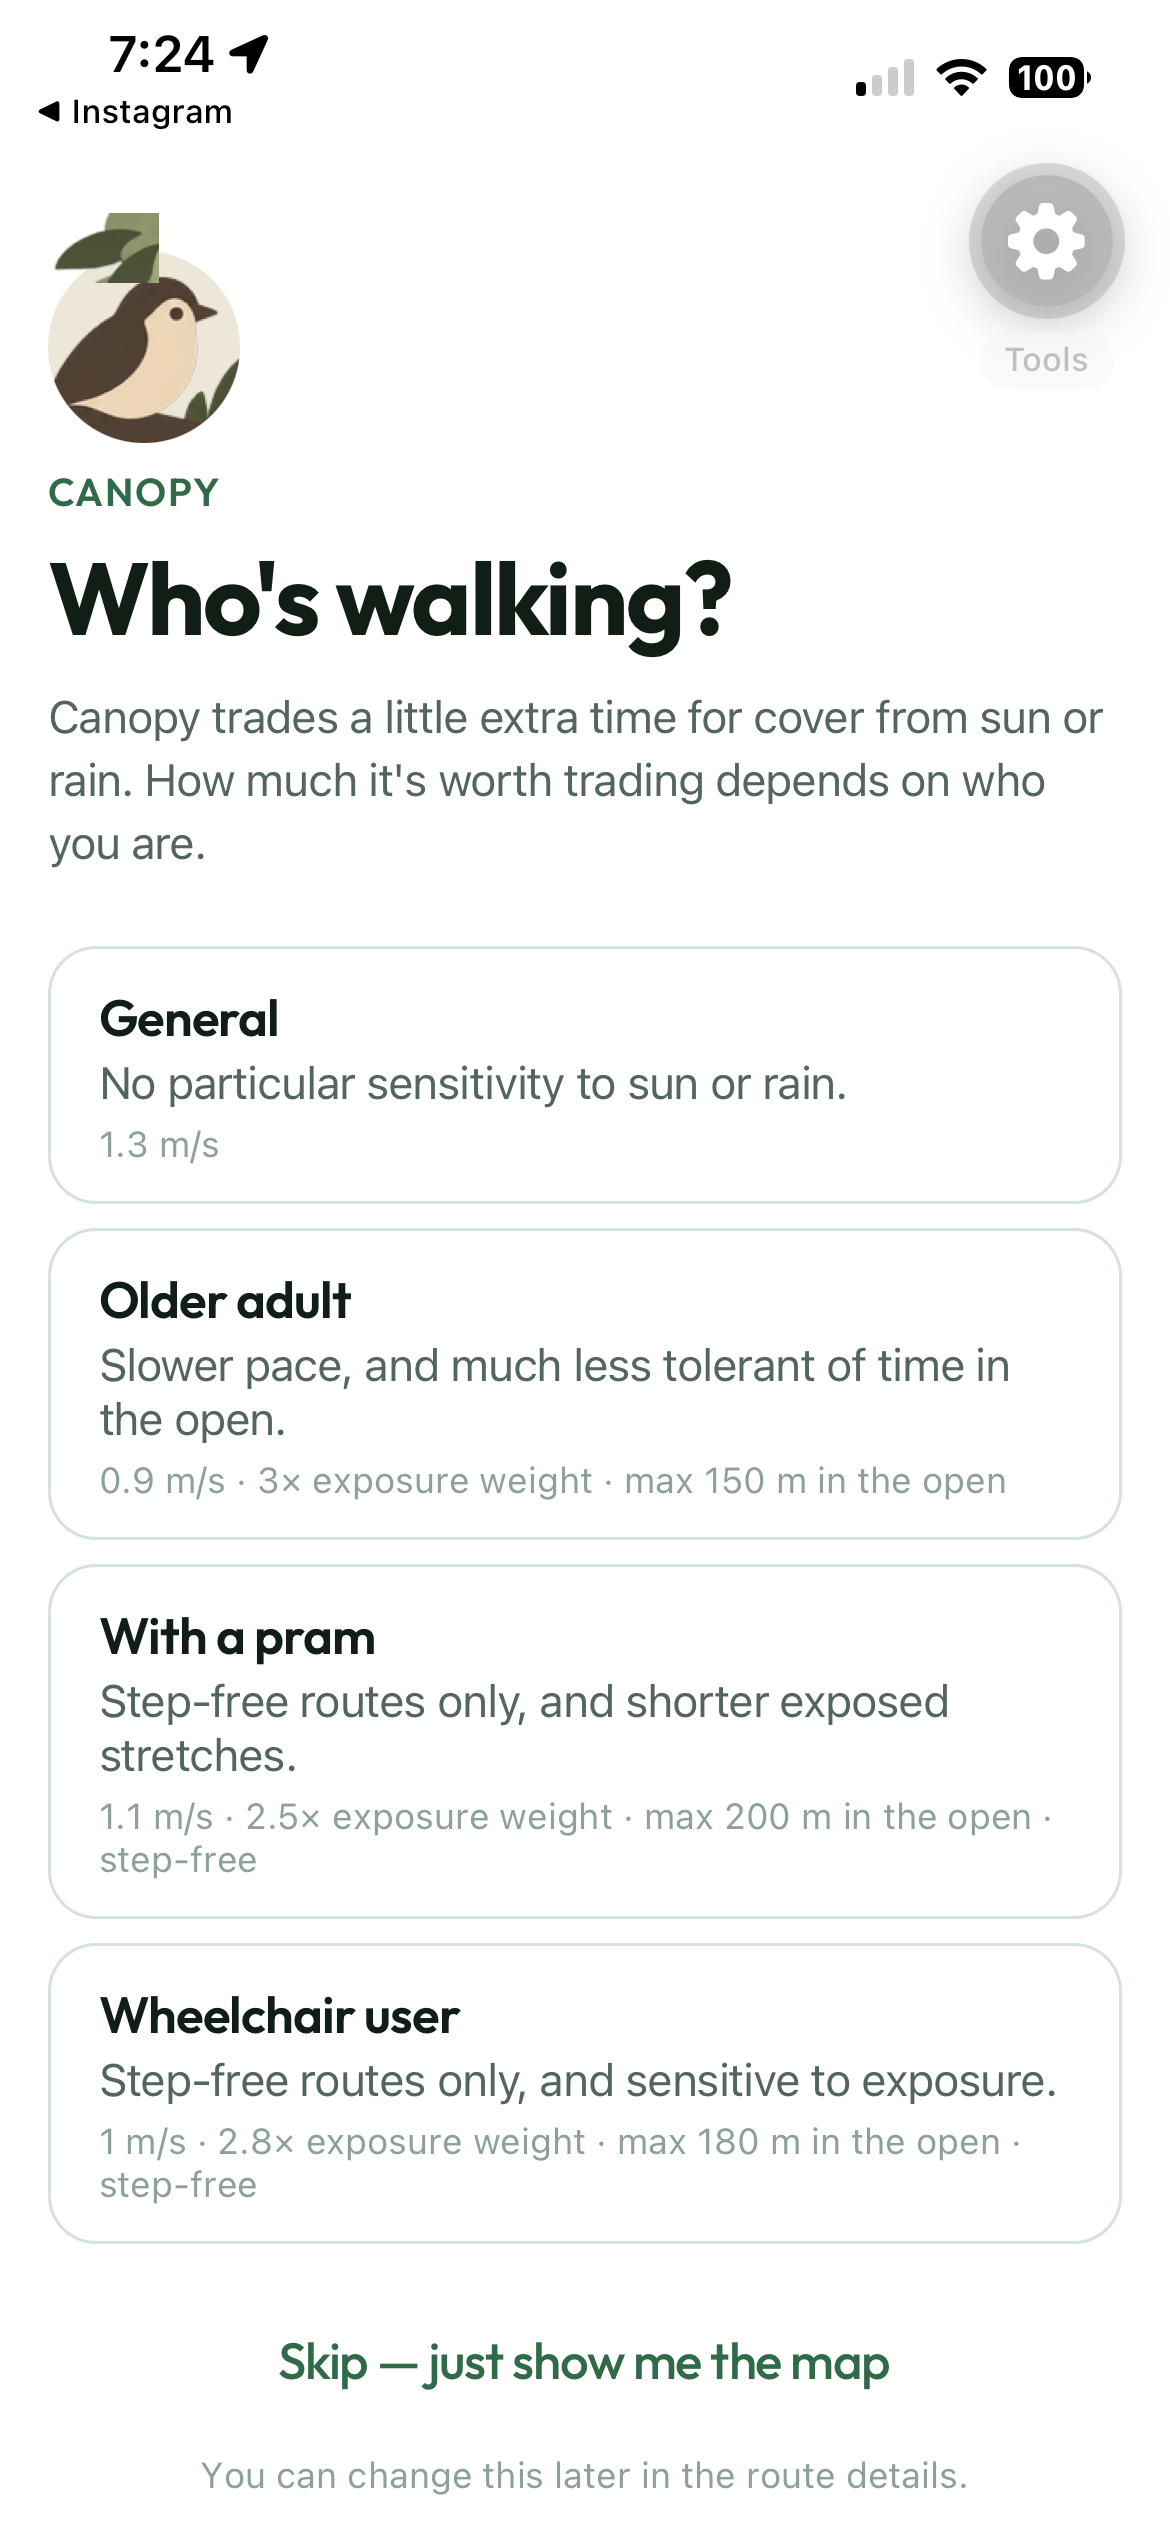
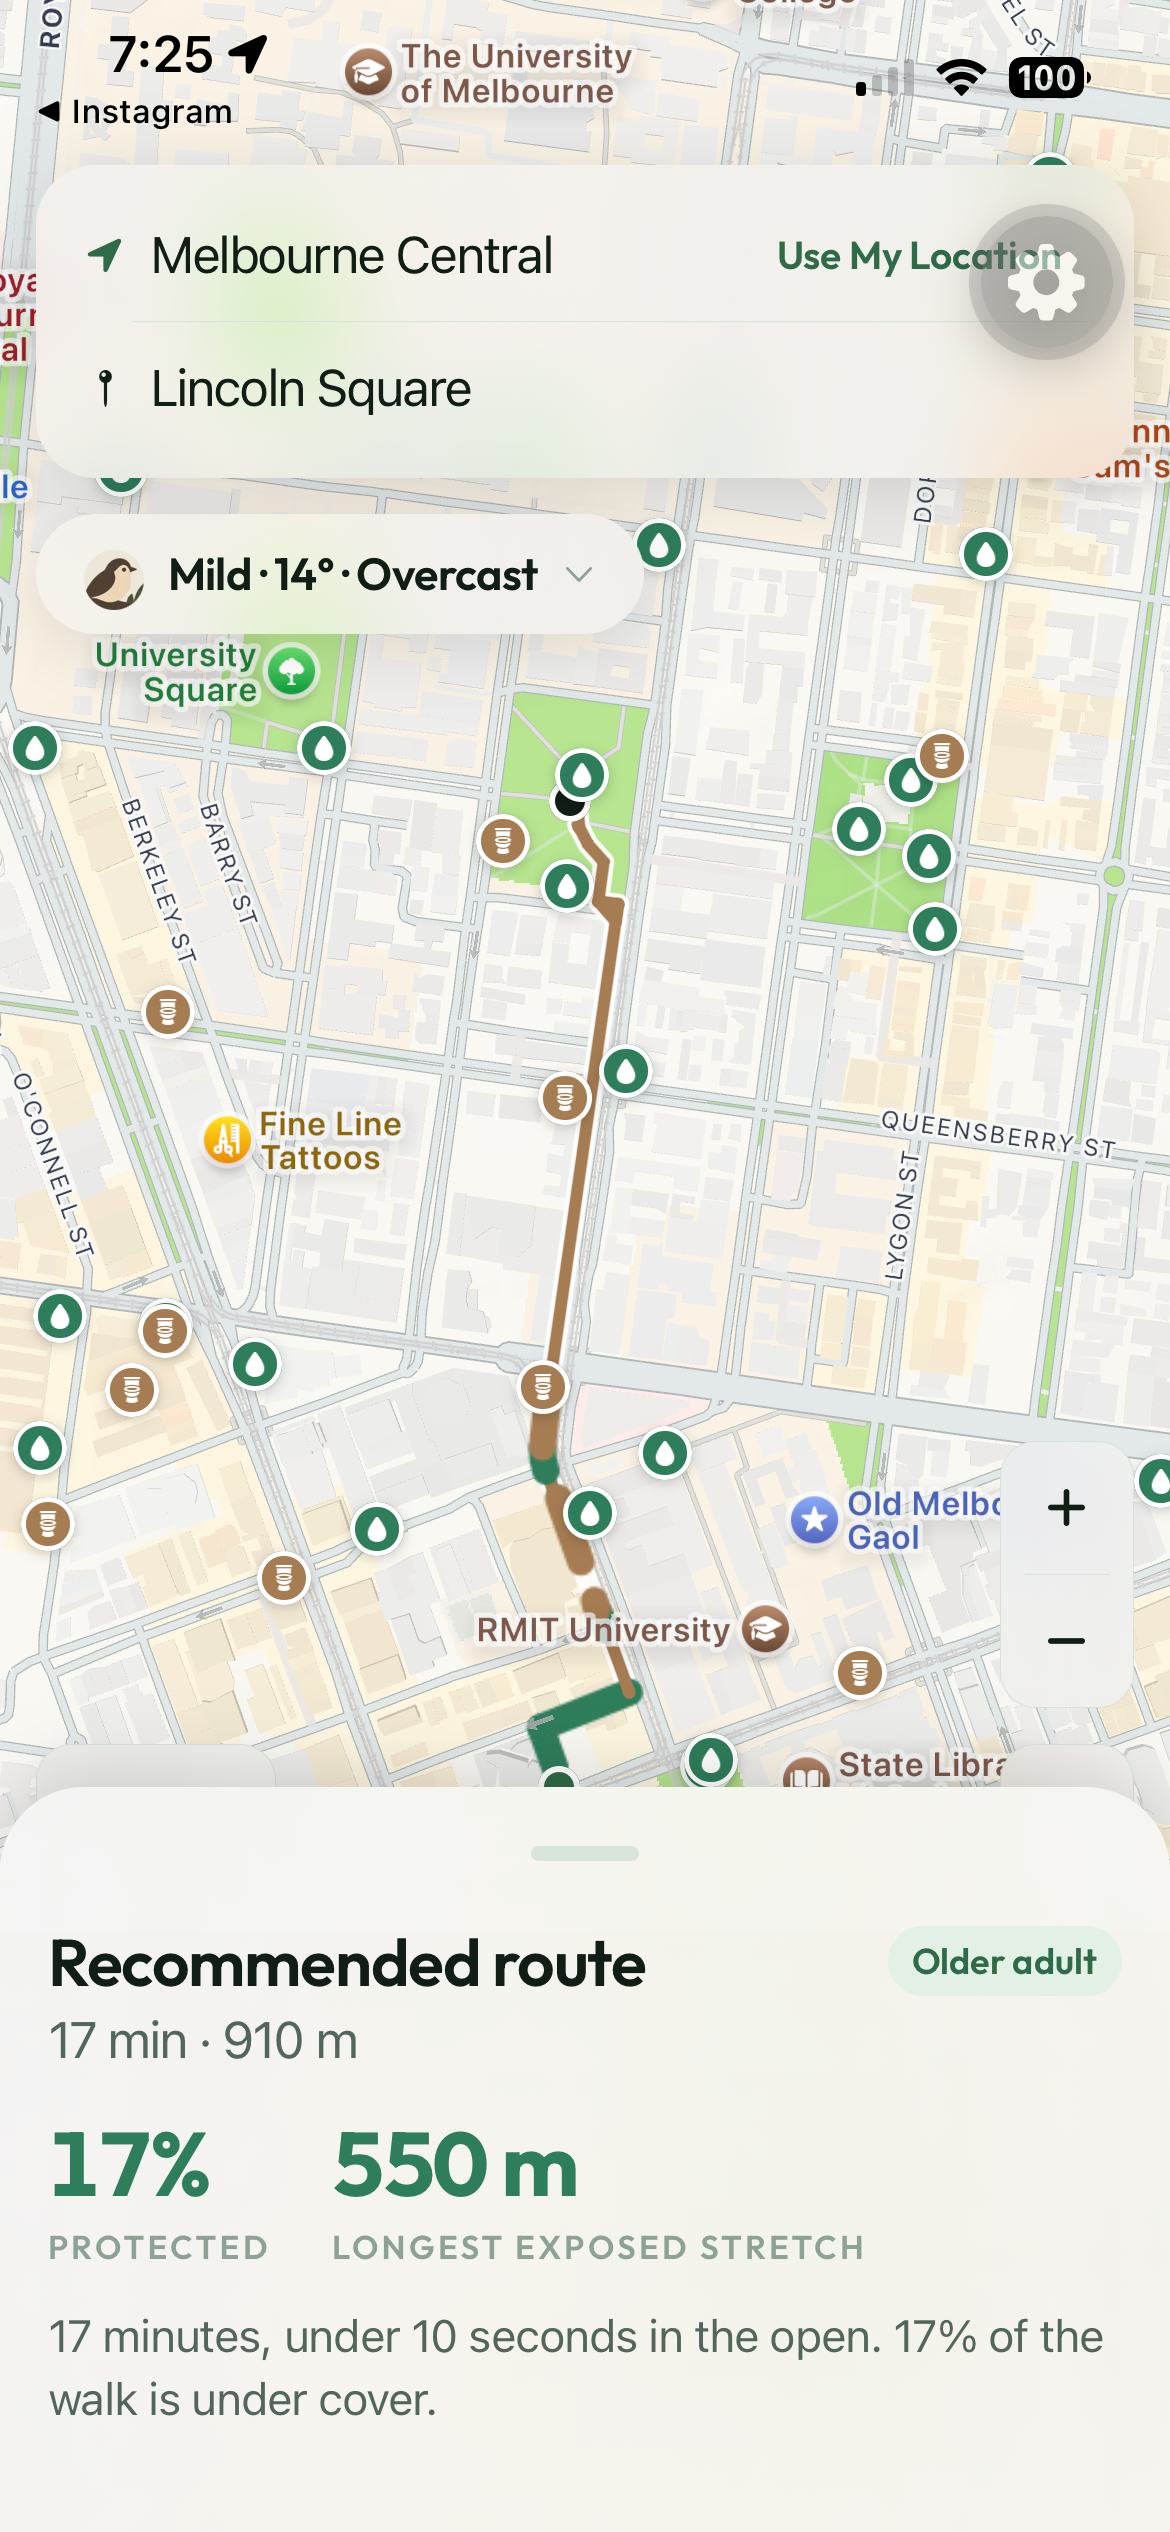
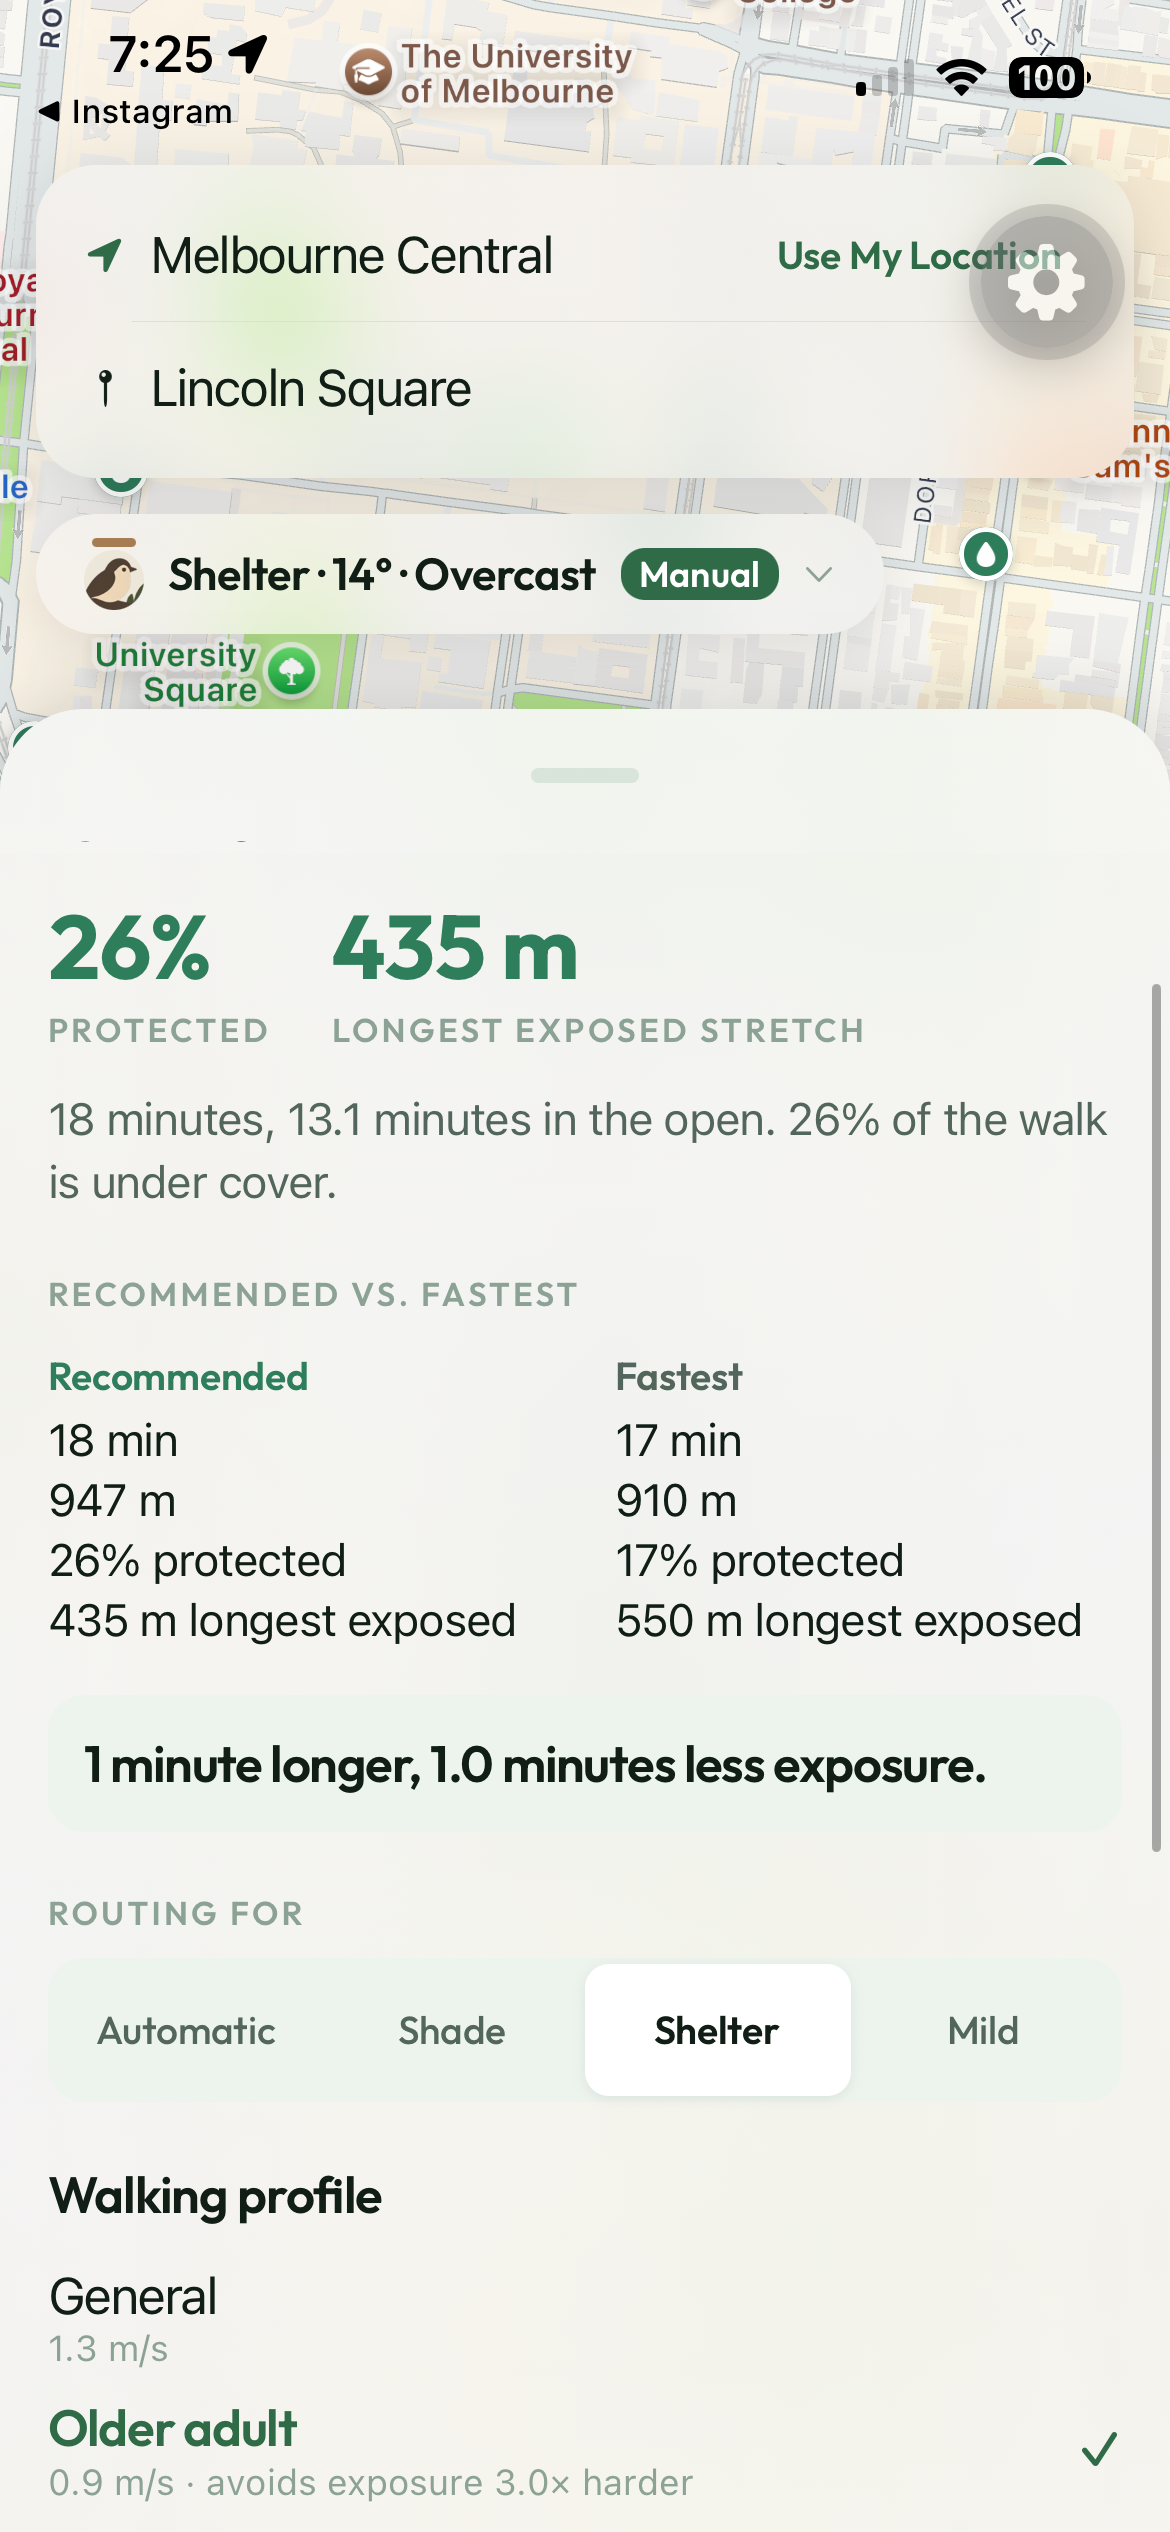
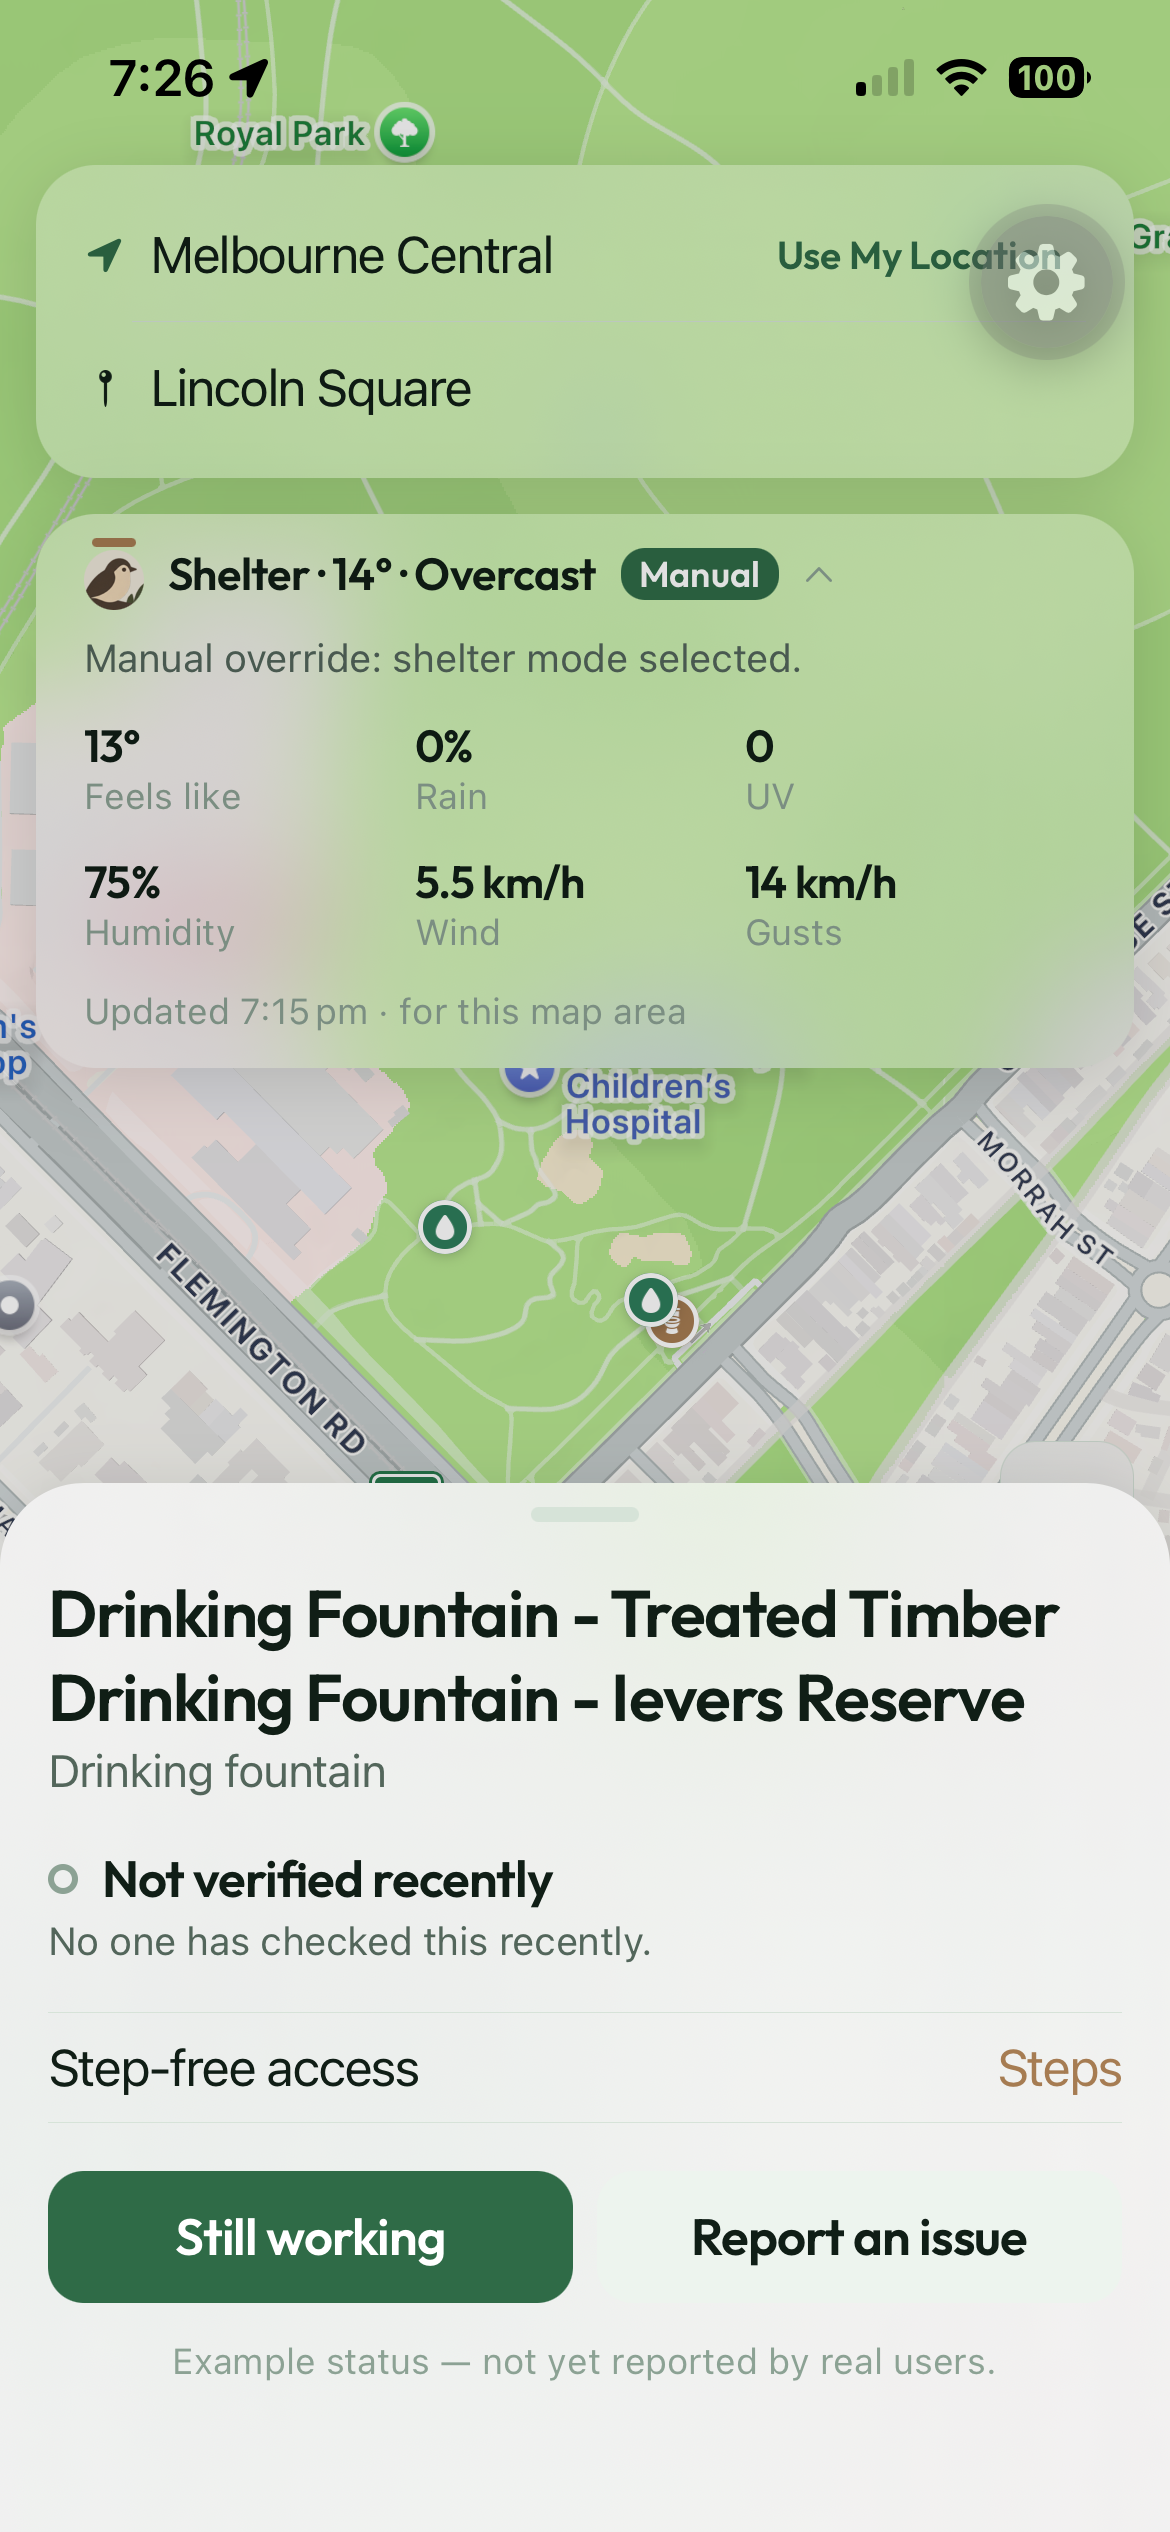
Canopy is a walking router for Melbourne CBD that considers weather exposure, not just travel time. You enter a destination, choose who is walking, and Canopy compares a recommended route against the fastest one. Depending on current conditions, it can prioritise shade, shelter, or speed. The app is useful for different people. A runner might want a drinking fountain, a wheelchair user may care about accessible routes, and someone walking to work may want to minimise UV or find rain shelter. Under the hood, the routing engine uses a cost function:
$$ \text{cost} = \text{travel time} + \text{exposure penalty} $$
This allows a meaningful tradeoff, recommending a route that takes a few extra minutes but keeps you covered for much longer. The map also distinguishes between directly mapped cover and inferred cover, so uncertain data isn't treated as confirmed.
How we built it
We split Canopy into a heavy offline geospatial pipeline and a lightweight routing runtime. The offline pipeline takes data from OpenStreetMap and City of Melbourne open datasets, building a walking graph with 39,752 edges and 13,820 nodes. For shade, we used tree canopy data and building footprints, calculating solar cover at different hours using sun positions and projected shadows. For directly mapped covered walkways, we used OpenStreetMap. Rain and sun are handled differently. Trees provide shade but aren't reliable rain shelter, so rain routing prioritises overhead structures. At runtime, a FastAPI backend runs Dijkstra's algorithm. The mobile app is built with Expo, React Native, and TypeScript, using Apple Maps on iOS and Leaflet on web. We built the project around free, publicly available data sources, so we didn't rely on API keys or paid services.
Challenges we ran into
We initially thought routing would be the difficult part. It turned out Dijkstra was the easiest. The real challenge was getting reliable geographic data and making the app behave when external services failed. Melbourne's covered infrastructure is only partially mapped in OpenStreetMap; some awnings were missing. We chose to make carefully labelled inferences, carrying information about whether cover was mapped, inferred, or mixed all the way to the app. Overpass was another major challenge. Large queries could time out, so we restructured them, used mirrors, and built a place index to serve stale data when Overpass was unavailable. We also found bugs that produced believable but wrong results: a timezone issue caused UV to read as zero, and shadows could point the wrong way. The mobile interface had problems with too many markers and cluttered controls, so we removed the large POI layer and kept controls more compact. Cross-platform support also required dealing with different map implementations.
Accomplishments that we're proud of
We are happiest that the project has one central routing model rather than separate systems for every situation. We are also proud of being honest about incomplete data by distinguishing inferred cover from directly mapped infrastructure. The offline pipeline was a major achievement, making the app responsive and allowing easy experimentation. We also put significant work into failure handling so the app degrades sensibly instead of breaking.
What we learned
The biggest lesson was that external geographic data is messy, and its most dangerous failures are often silent. Many hard bugs produced plausible but wrong results. We learned to test assumptions about the real world, not just code execution. We also learned to move expensive computation offline and to design around weakest dependencies using fallbacks and stale data. On the frontend, we learned that mobile UI is about limited space, and sometimes the solution is to remove or shrink features.
What's next for Canopy
The most obvious next step is expanding beyond the Melbourne CBD. The current project is deliberately scoped to an area where we could process and verify the data within the time available. Expanding further would also mean reconsidering some of the assumptions we made about Melbourne's CBD infrastructure. We would also like to improve the accuracy of the model through real-world calibration, as many thresholds are sensible defaults rather than values measured through field testing. Another important direction is accessibility, such as enforcing a maximum continuous distance in direct exposure for users who need that constraint. We would also like to add more public amenities, including air-conditioned spaces as refuges during extreme weather. A longer-term idea is a virtual preview of the route using street-level imagery. There is also potential to identify gaps in urban cover, showing where trees or shade structures would make the biggest difference. Canopy does not solve heat or weather exposure, but for a small part of Melbourne it tries to answer a simple question: if you have to walk through the city, what is the better way to do it?
Here is the required disclosure section you can add to your Devpost submission. It covers AI‑assisted development (including Claude Code) and lists all pre‑existing libraries and datasets used.
AI Disclosure
We used AI‑assisted development in the following ways:
- Claude Code (Anthropic) assisted with code generation, debugging, and writing test cases.
Pre‑existing libraries, assets, and datasets used:
Libraries: FastAPI, Pydantic, OSMnx, NetworkX, Shapely, PyProj, React Native, Expo, MapLibre GL JS, Leaflet.
Datasets: OpenStreetMap (walking network, covered ways), City of Melbourne tree canopy polygons (2021), City of Melbourne building footprints with heights (2023), City of Melbourne public toilets and drinking fountains, Open‑Meteo weather API, Nominatim geocoding service.
All datasets are freely available and openly licensed; full attributions are in ATTRIBUTION.md in the repository.
Thanks for taking the time to look at our submission!
Built With
- applemaps
- docker
- expo.io
- fastapi
- geopandas
- httpx
- leaflet.js
- nominatim
- numpy
- open-meteo
- openstreetmap
- osmnx
- overpass-openstreetmap
- pandas
- pvlib
- pydantic
- pyproj
- pytest
- python
- react
- react-native-maps
- shapely
- typescript
- uvicorn

Log in or sign up for Devpost to join the conversation.