-
-
Landing Page
-
Model description
-
Map interface
Project Overview
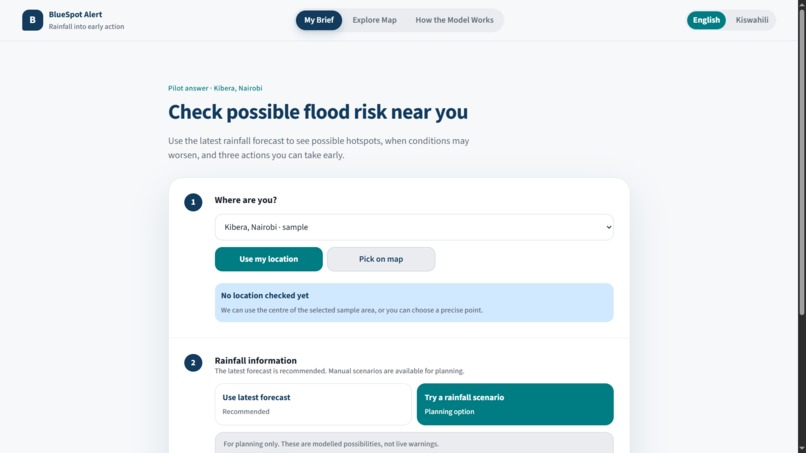
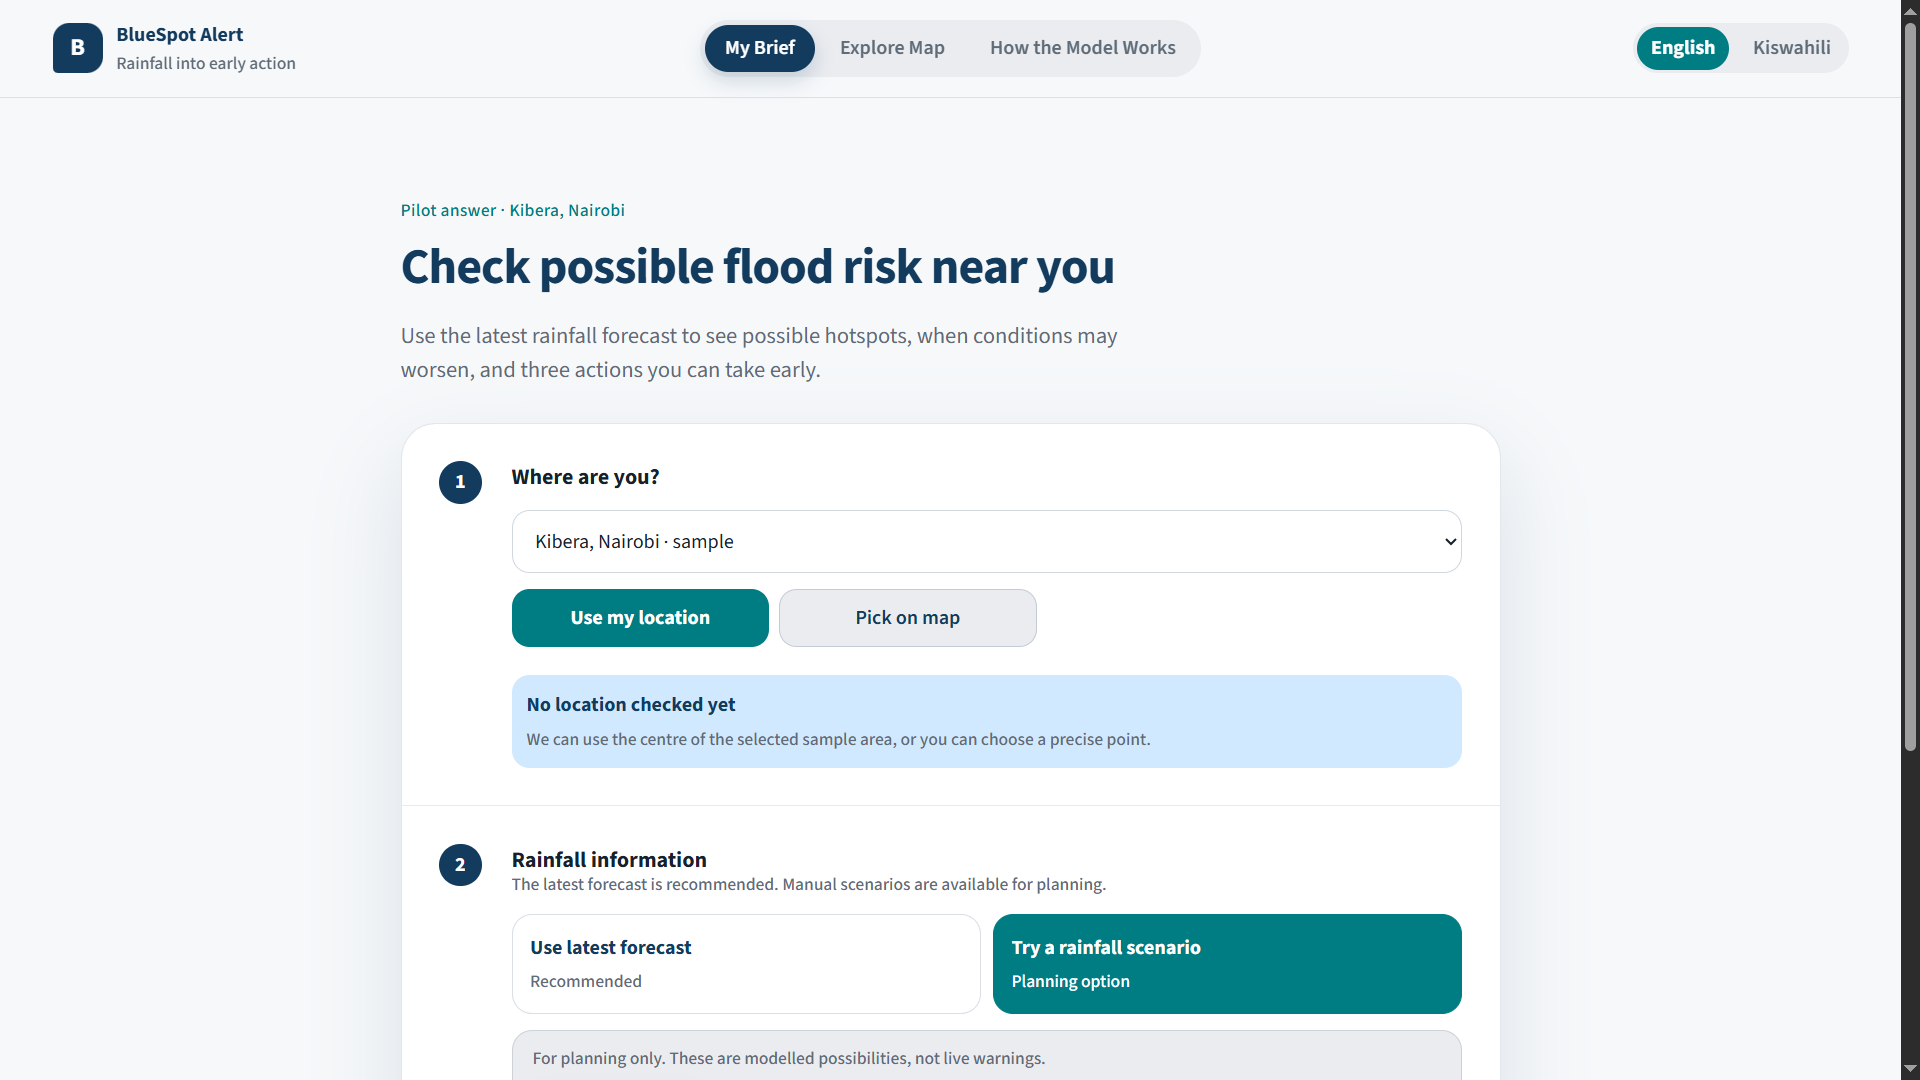
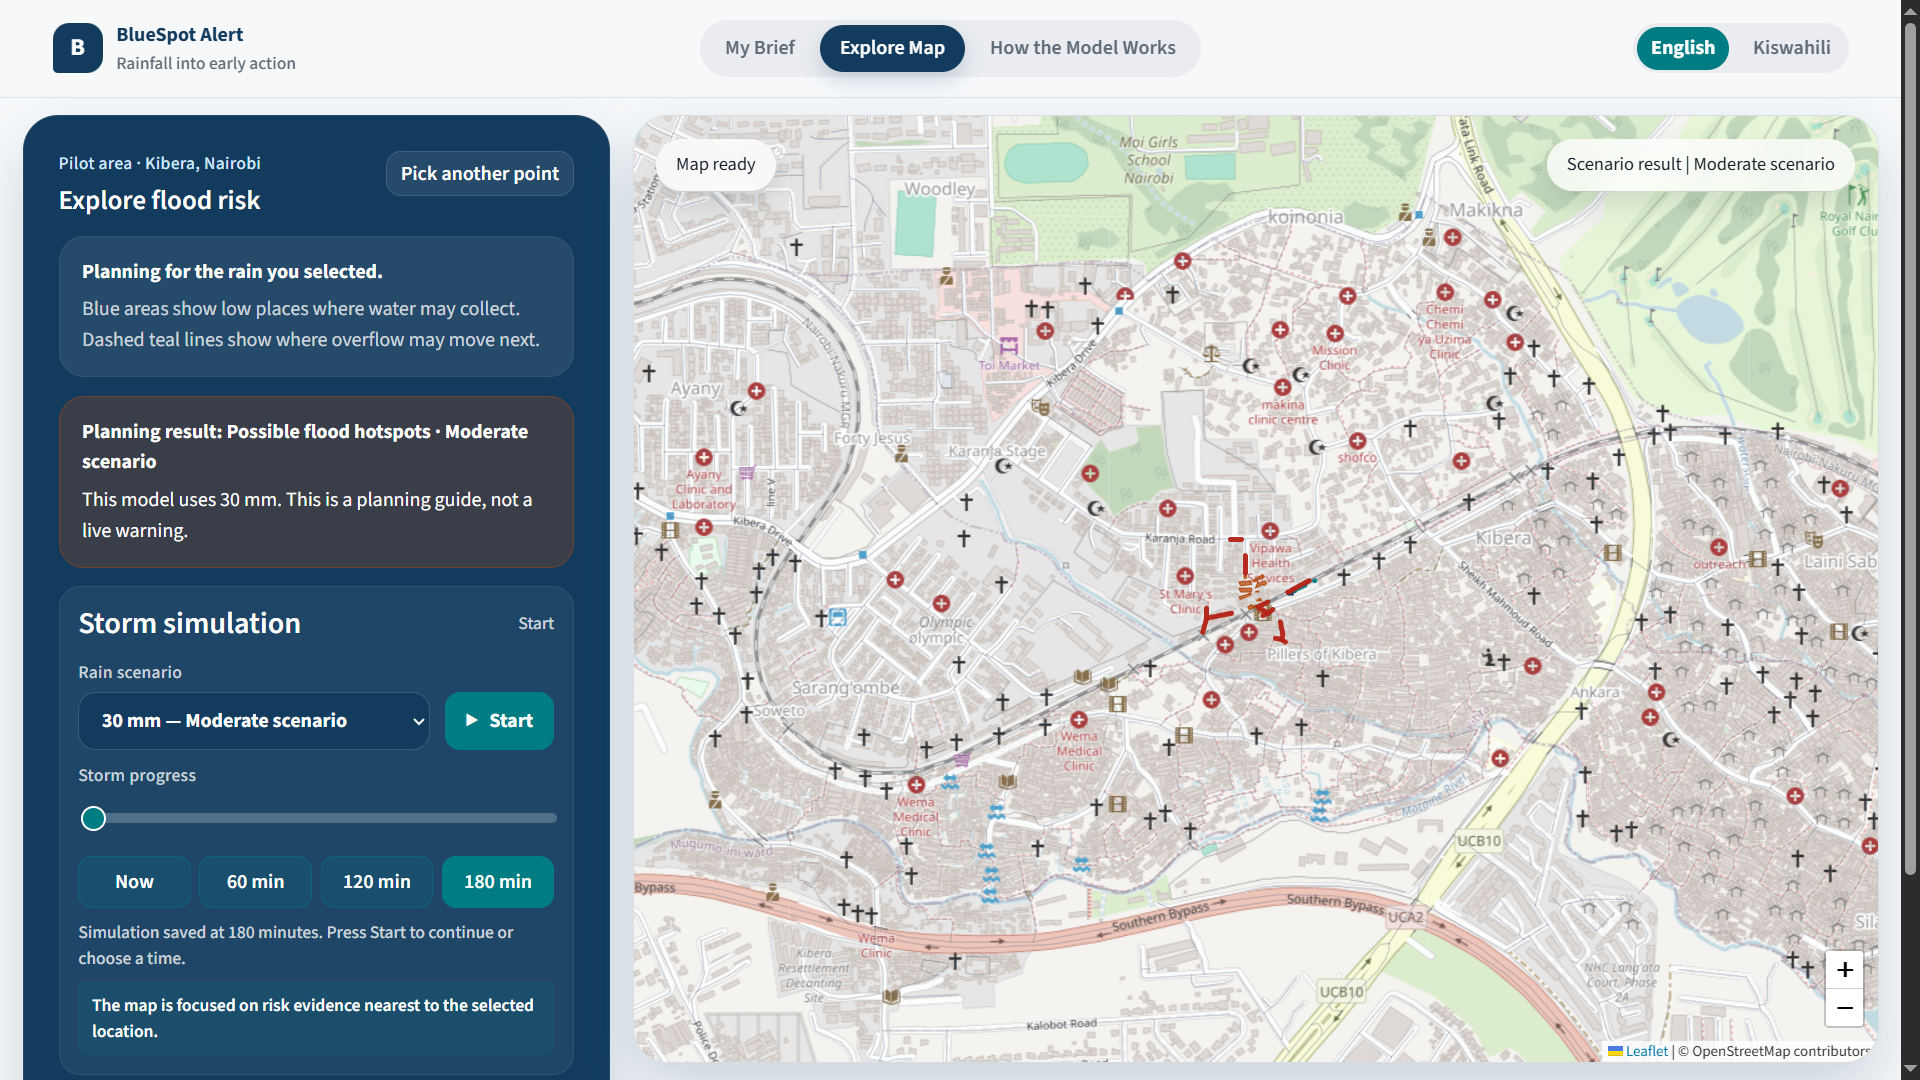
BlueSpot Alert is a map-supported urban flood early-warning and early-action platform that turns forecast rainfall into a location-specific planning brief. Regional forecasts and technical GIS outputs rarely answer the questions residents need immediately: could flooding affect my location, when might conditions worsen, which nearby roads may be unsafe, and what should I do now? The Kibera, Nairobi prototype combines a terrain-based bluespot model with live Open-Meteo rainfall forecasts. It identifies low places where stormwater may collect, likely overflow corridors, exposed buildings and road sections, then communicates three practical actions in English or Kiswahili. Residents can use their device location or choose a point on the map. Community leaders and responders receive role-specific guidance and ranked locations for inspection or drainage clearing. BlueSpot Alert is intentionally brief-first: the answer and actions come before the map, while detailed spatial evidence, storm progression, validation results and model limitations remain available for users who need them. Forecasts and manual scenarios are clearly distinguished from official warnings, and exact user coordinates remain on the device. Kibera is the first sample area, not the platform boundary. The same structure can support other urban catchments when compatible terrain, drainage, building, road and rainfall data are available. The goal is to close the last-mile gap between early-warning information and timely household or community action.
Solution Details
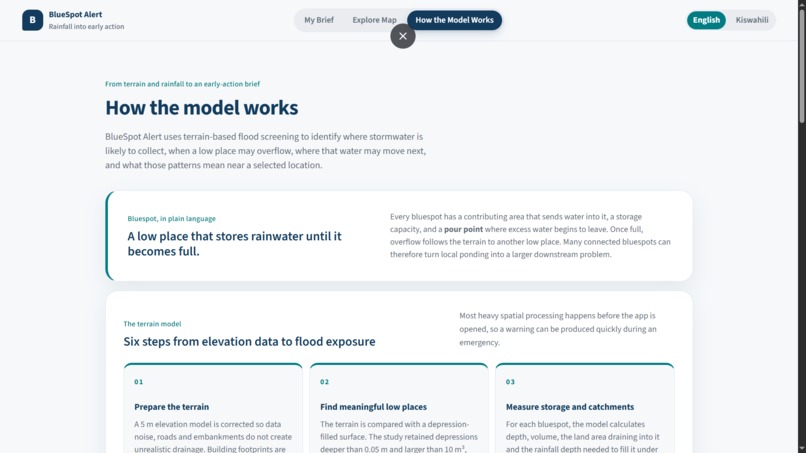
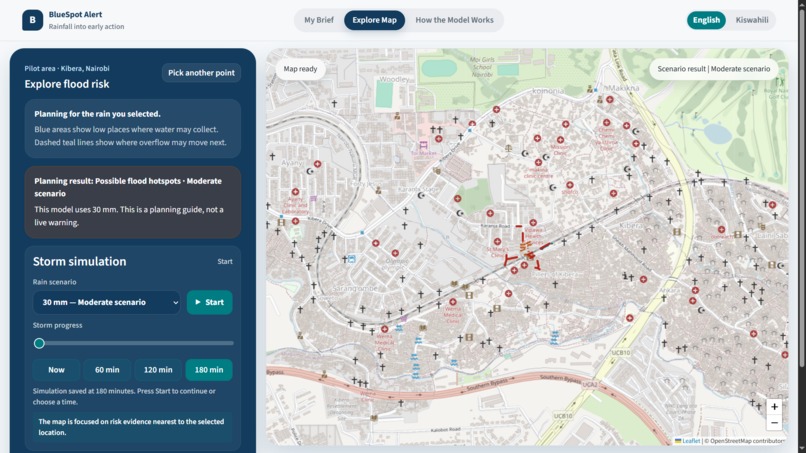
BlueSpot Alert preprocesses terrain, bluespot networks, buildings, roads and historical flood data into lightweight GeoJSON. For each bluespot, rainfall volume and upstream spillover are compared with storage capacity; overflow is passed downstream through connected corridors. Building and road features store first-exposure thresholds, enabling immediate filtering across 80 rainfall scenarios and 80 three-hour timelines. A Node.js service retrieves Open-Meteo forecasts, calculates the wettest rolling three-hour rainfall total within the next 48 hours and conservatively matches it to the next modelled threshold. A deterministic safety engine sets the planning level, affected features and approved actions. The browser interface uses HTML5, CSS3, JavaScript and Leaflet with OpenStreetMap tiles. A service worker caches the app shell and same-origin risk data for resilience. Exact checked coordinates stay on the device, while briefs can be shared through the device share sheet, WhatsApp or clipboard. Key innovations are rainfall-triggered bluespot modelling, location-specific briefs, time-based storm playback, explicit local-versus-area-wide results, and a reusable urban-area data contract. The Kibera package includes 7,943 building footprints, historical comparison events, English/Kiswahili guidance and responder prioritisation. The model is presented as a planning and hotspot-screening tool, with limitations and official-warning checks clearly visible.
Inspiration
Flood forecasts are often regional and technical, while the decisions residents face are immediate and local: Is my home at risk? When should I act? Which road should I avoid? We created BlueSpot Alert to close that last-mile gap. Instead of expecting residents to interpret rainfall charts and complex GIS layers, the platform translates forecast rainfall and flood modelling into a simple, location-specific safety brief.
What it does
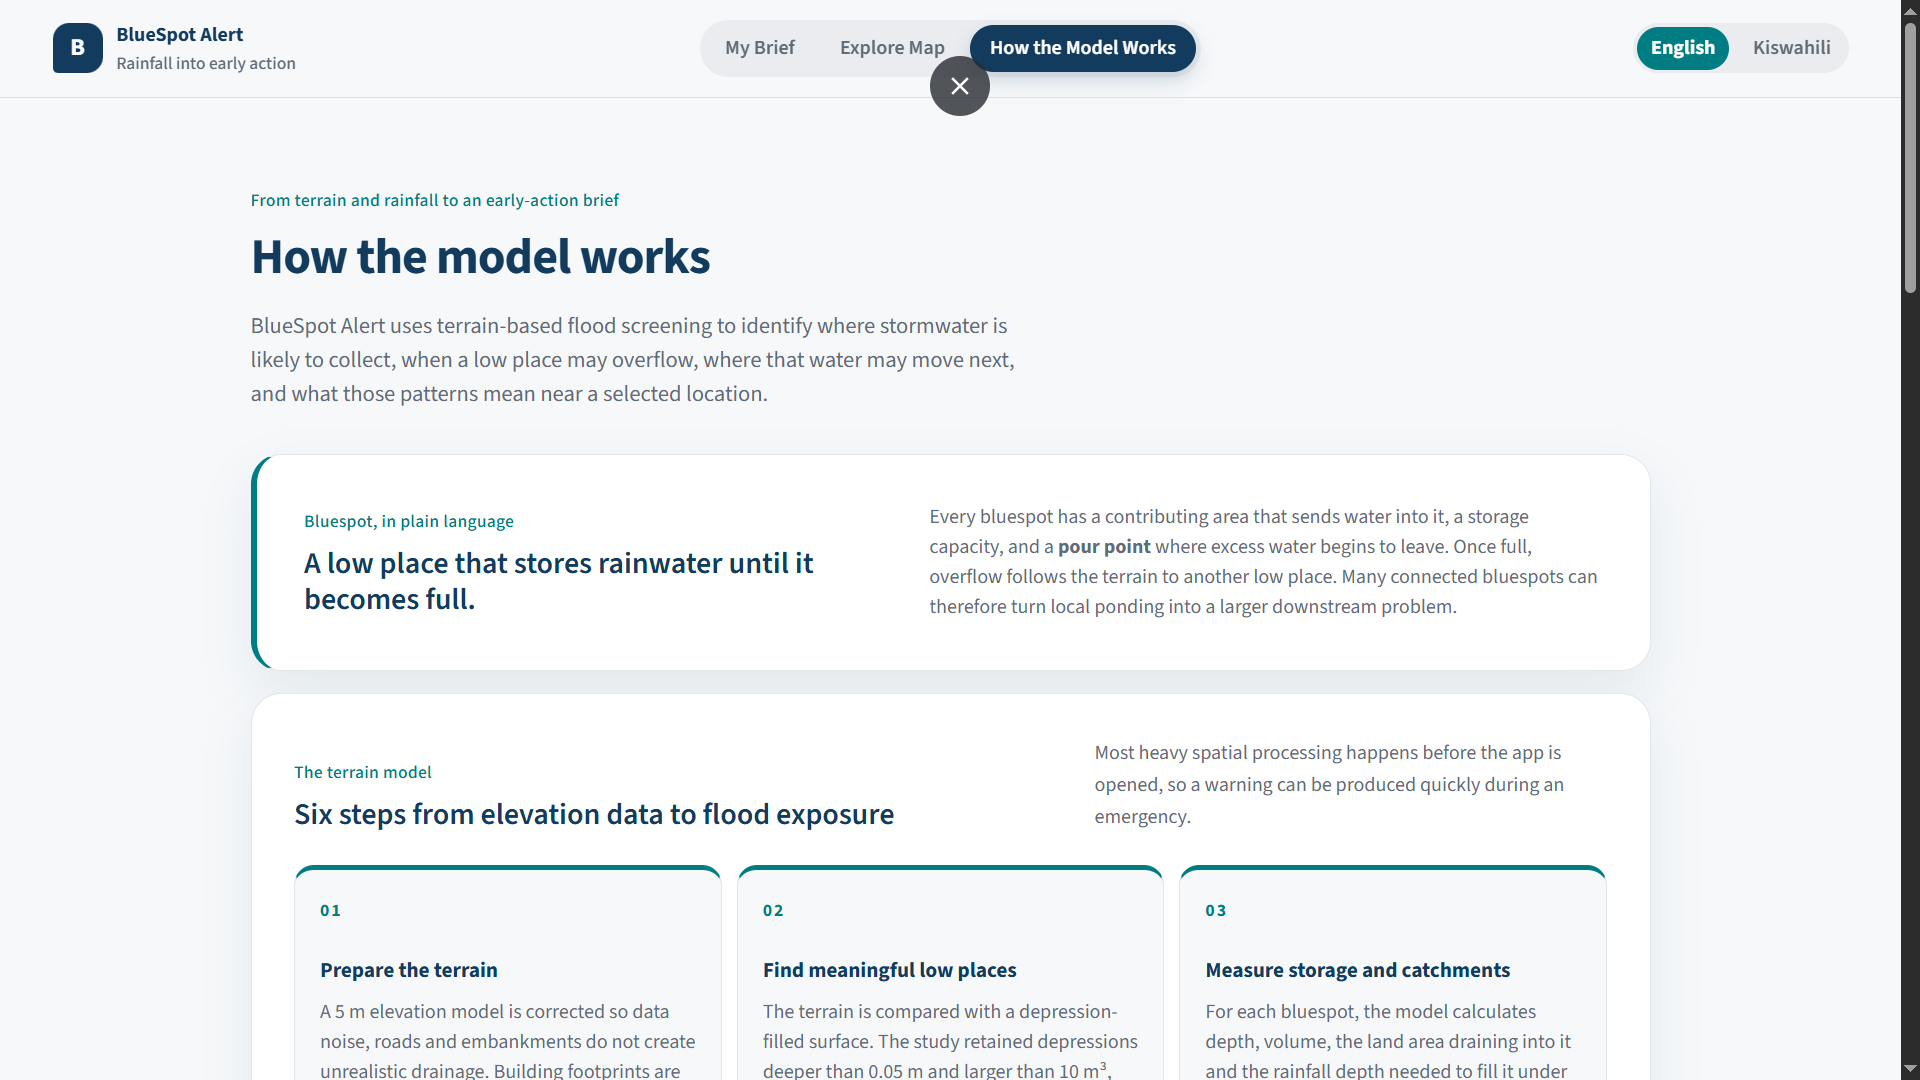
BlueSpot Alert: Checks live forecast rainfall or accepts a manual rainfall scenario. Matches rainfall to a precomputed flood scenario. Identifies likely water-collection areas and overflow paths. Shows nearby exposed buildings and roads. Estimates when a location may become dangerous. Provides three clear early actions. Supports English and Kiswahili. Creates shareable alerts for households and community groups. Provides a focused map for exploration. Shows methodology, limitations, and validation evidence separately. Gives responders ranked areas for inspection or drainage clearing.
How we built it
We processed terrain, bluespot, road, building, and historical flood-event data into lightweight GeoJSON datasets suitable for the web. Building footprints are stored with their first modelled exposure threshold, allowing the browser to filter thousands of features immediately when rainfall changes. A Node.js server retrieves Open-Meteo forecasts and calculates the highest rolling three-hour rainfall total expected within 48 hours. The forecast is matched conservatively to a modelled threshold before the deterministic safety engine produces the user’s risk level and actions. The interface was built with HTML, CSS, JavaScript, Leaflet, and a service worker for resilient caching.
Challenges we ran into
The greatest challenge was translating technically complex flood modelling into guidance that is understandable without oversimplifying risk. We also had to: Keep thousands of building footprints responsive in a browser. Distinguish local risk from area-wide exposure totals. Connect coarse weather forecasts to street-level precomputed scenarios responsibly. Communicate uncertainty without making the warning ineffective. Keep optional AI from changing safety-critical model decisions. Design the platform for both residents and technical evaluators.
Accomplishments we are proud of
We are proud that the result feels like a public safety product rather than a conventional GIS dashboard. BlueSpot Alert now provides a complete pathway from forecast rainfall to a location-specific action brief. It preserves technical depth through optional map and evidence views while keeping the default experience calm and understandable. We also implemented multilingual guidance, private location checking, shareable alerts, forecast provenance, stale-data warnings, manual fallback scenarios, role-based actions, and a reusable structure for adding other urban regions.
What we learned
Early-warning systems are not only data-generation systems; they are decision-support and communication systems. A technically accurate result can still fail if residents cannot understand whether it applies to them. We learned to separate local and area-wide results, make uncertainty visible, provide actions alongside risk, and treat the map as supporting evidence rather than the product itself. We also learned that AI is safest when it explains verified decisions instead of making safety-critical decisions.
What’s next
Next, we plan to: Validate thresholds with residents, community leaders, and responders. Incorporate local rain gauges and official KMD/ICPAC alerts. Add community field reports and drainage-condition updates. Support SMS, WhatsApp, USSD, and low-bandwidth notifications. Improve accessibility and additional local languages. Add safe-route and shelter information using verified official data. Onboard additional Nairobi catchments and other IGAD urban regions. Evaluate warning accuracy, message reach, action time, and avoided exposure.
Built With
- arcpy
- css3
- esri
- geojson
- html5
- javascript
- leaflet.js
- node.js
- open-meteo
- openairesponsesapi
- openstreetmap
- pro
- python

Log in or sign up for Devpost to join the conversation.