-
-
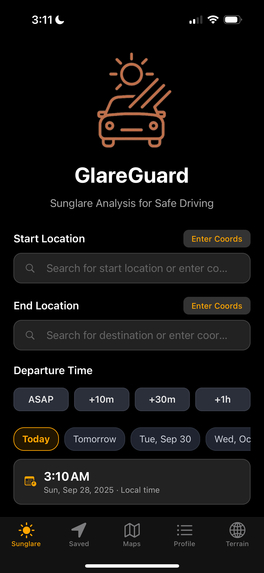
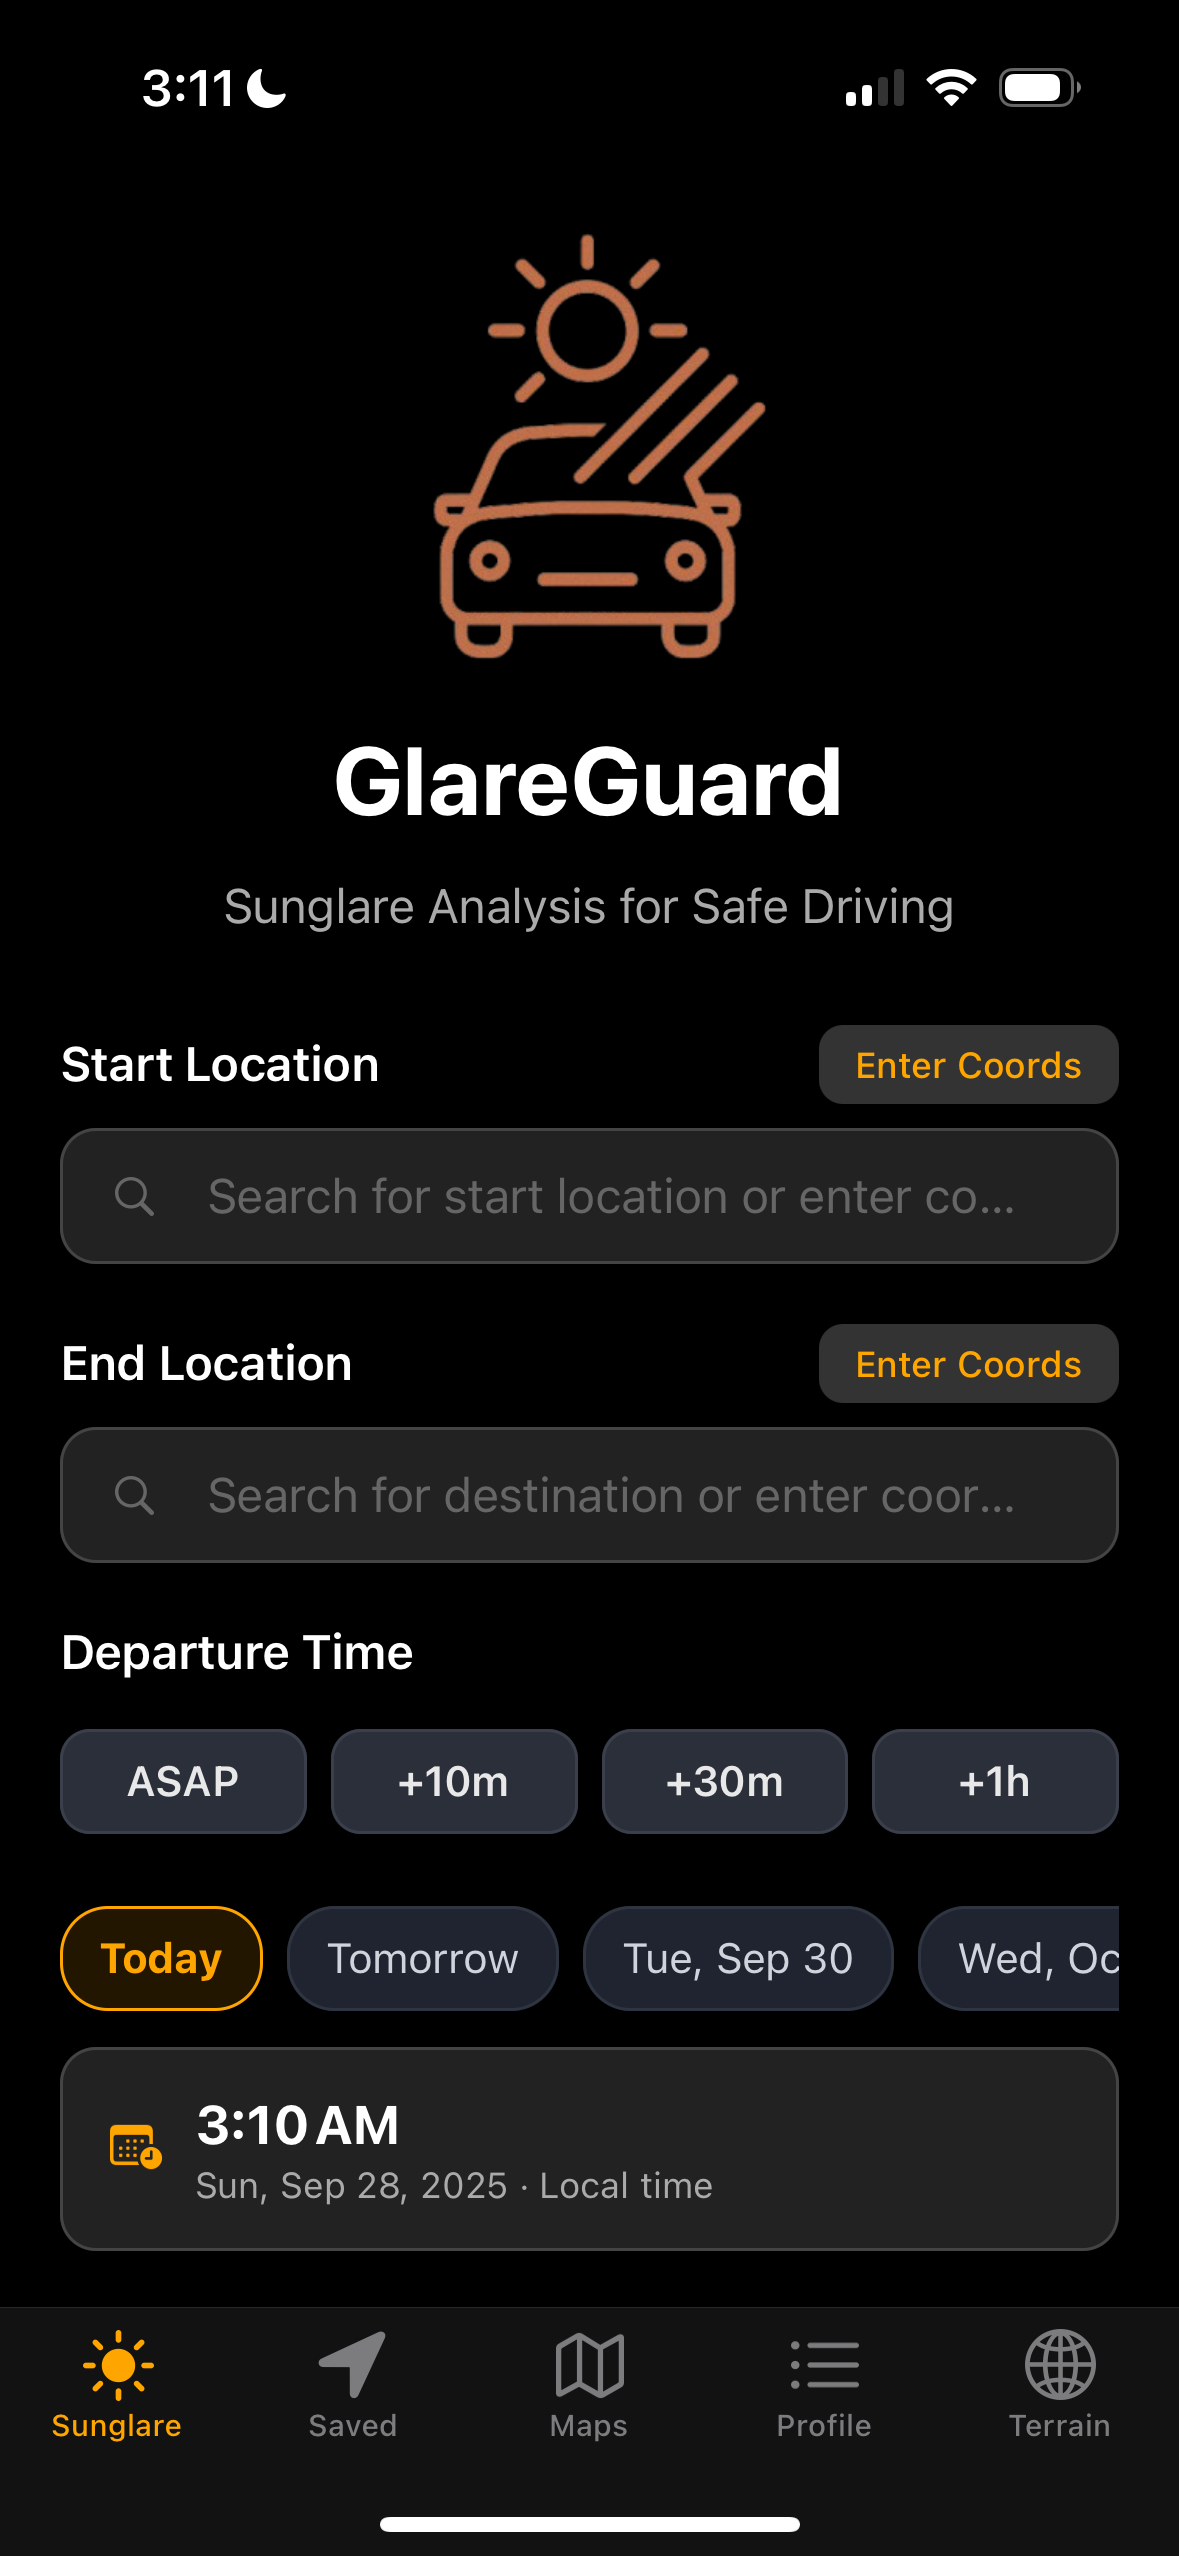
GlareGuard’s homepage lets you set start & destination, choose departure time, analyze sun-glare risk, and save routes for safer driving.
-
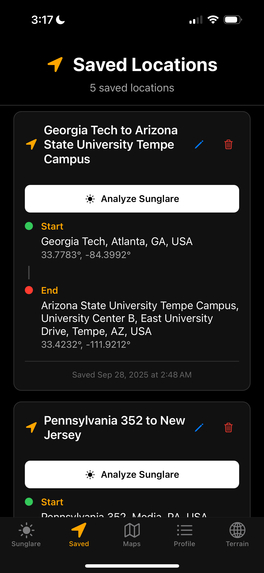
GlareGuard’s Saved Routes page stores all your previously analyzed trips, letting you quickly revisit and compare glare-risk routes anytime.
-

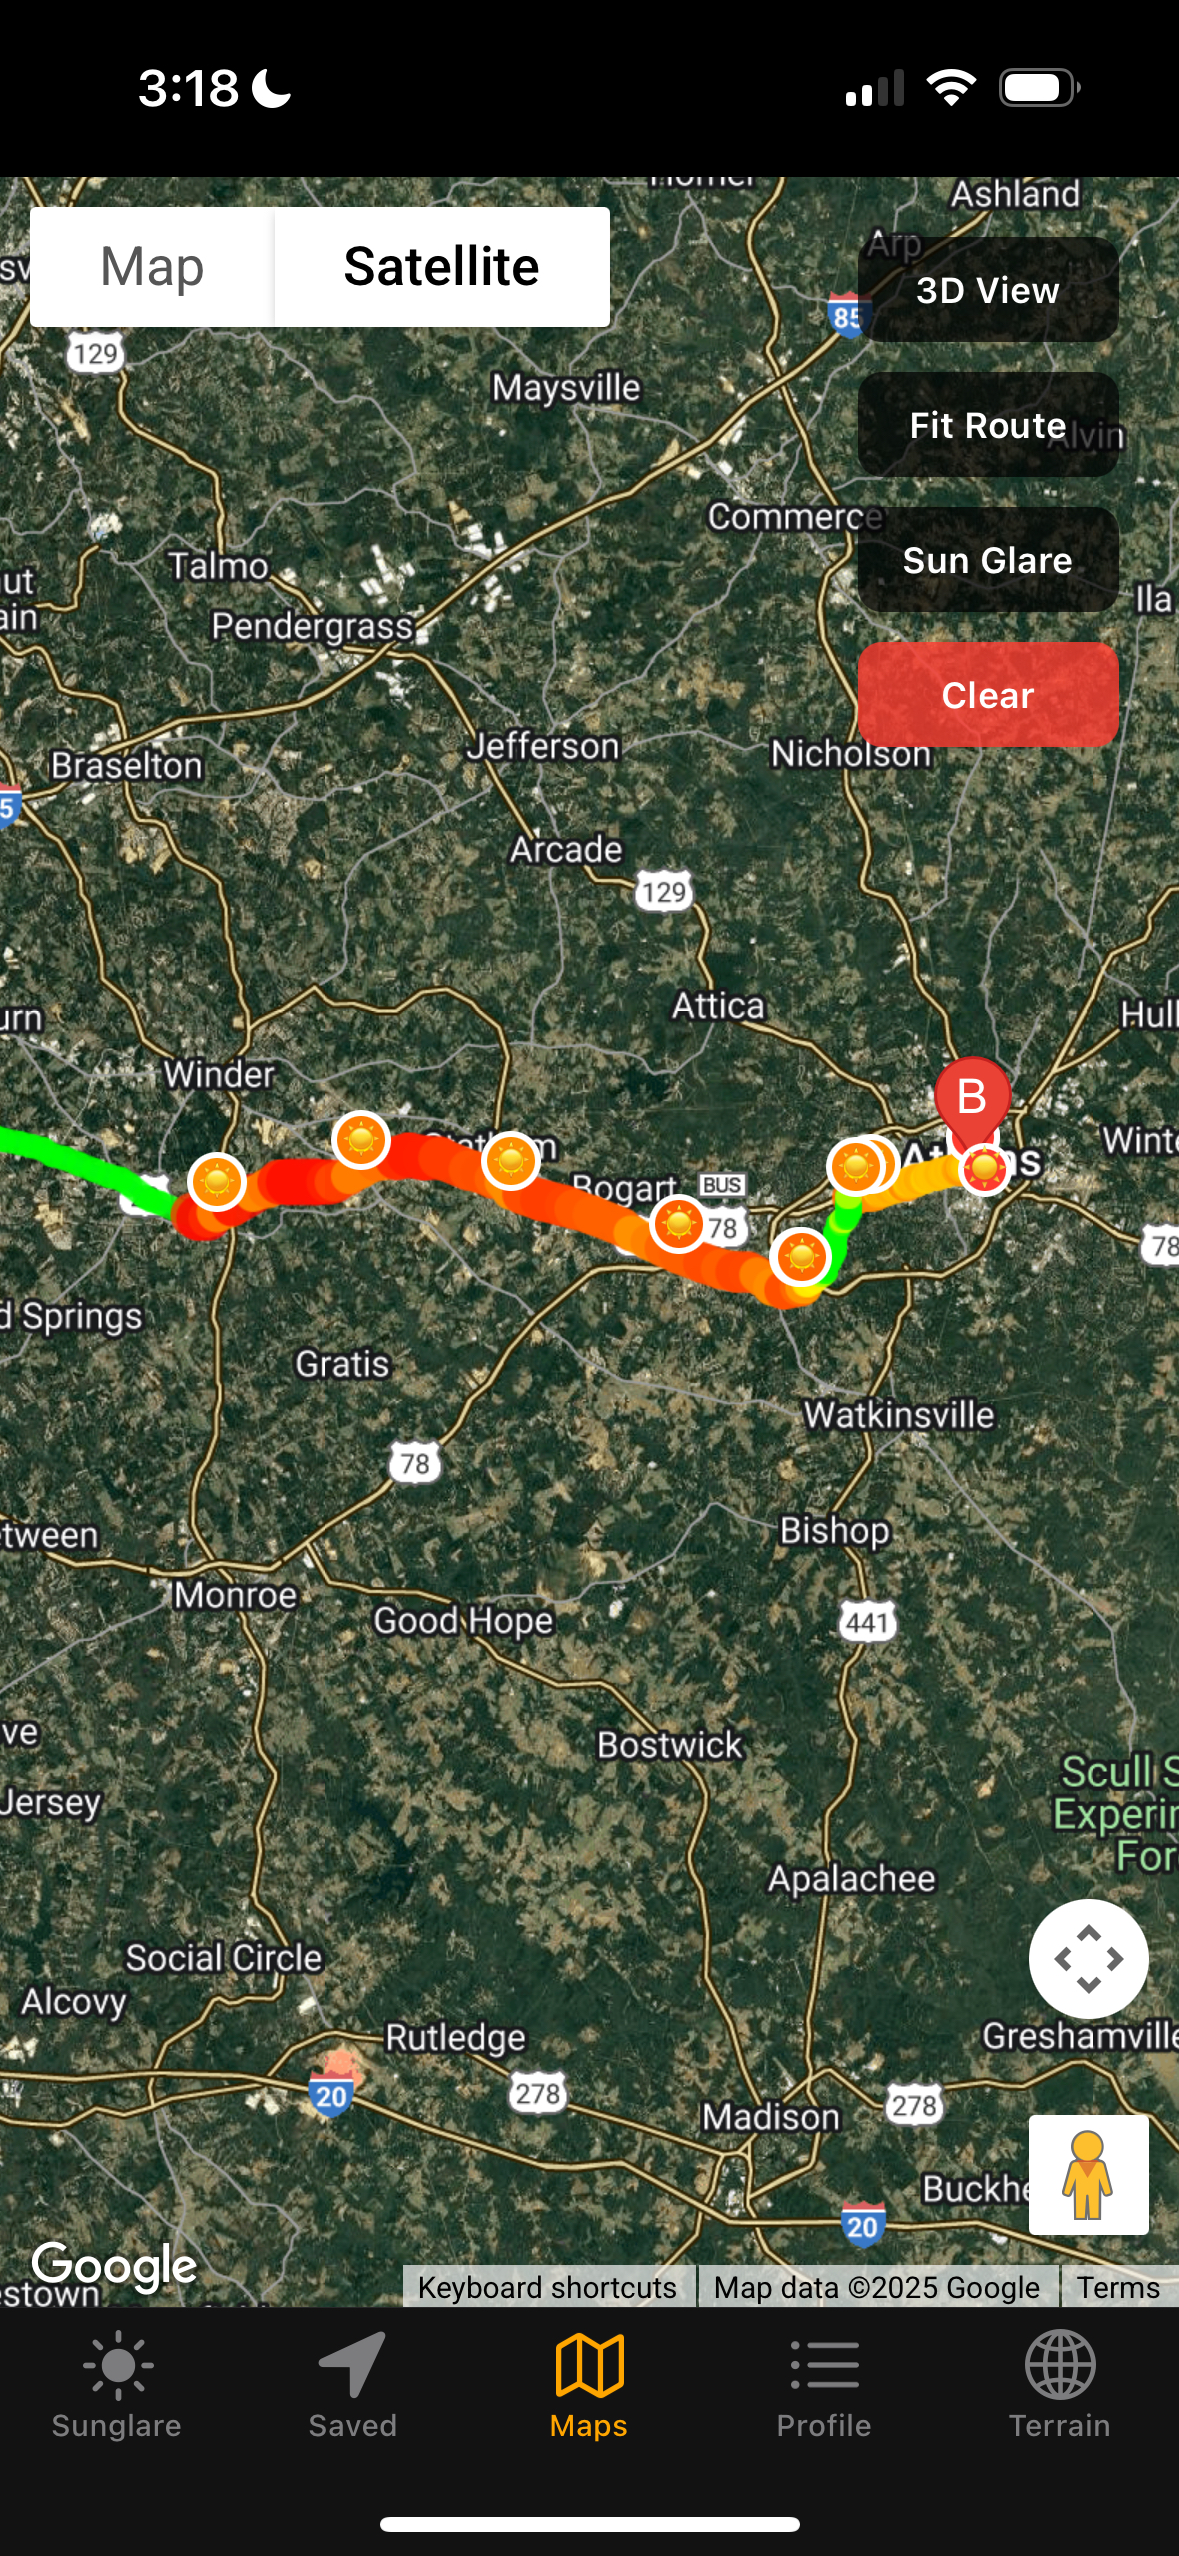
GlareGuard’s map view highlights your route with green, yellow, and red zones, showing glare-risk hotspots to keep you alert and prepared.
-
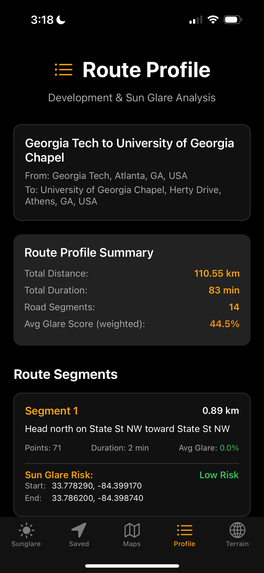
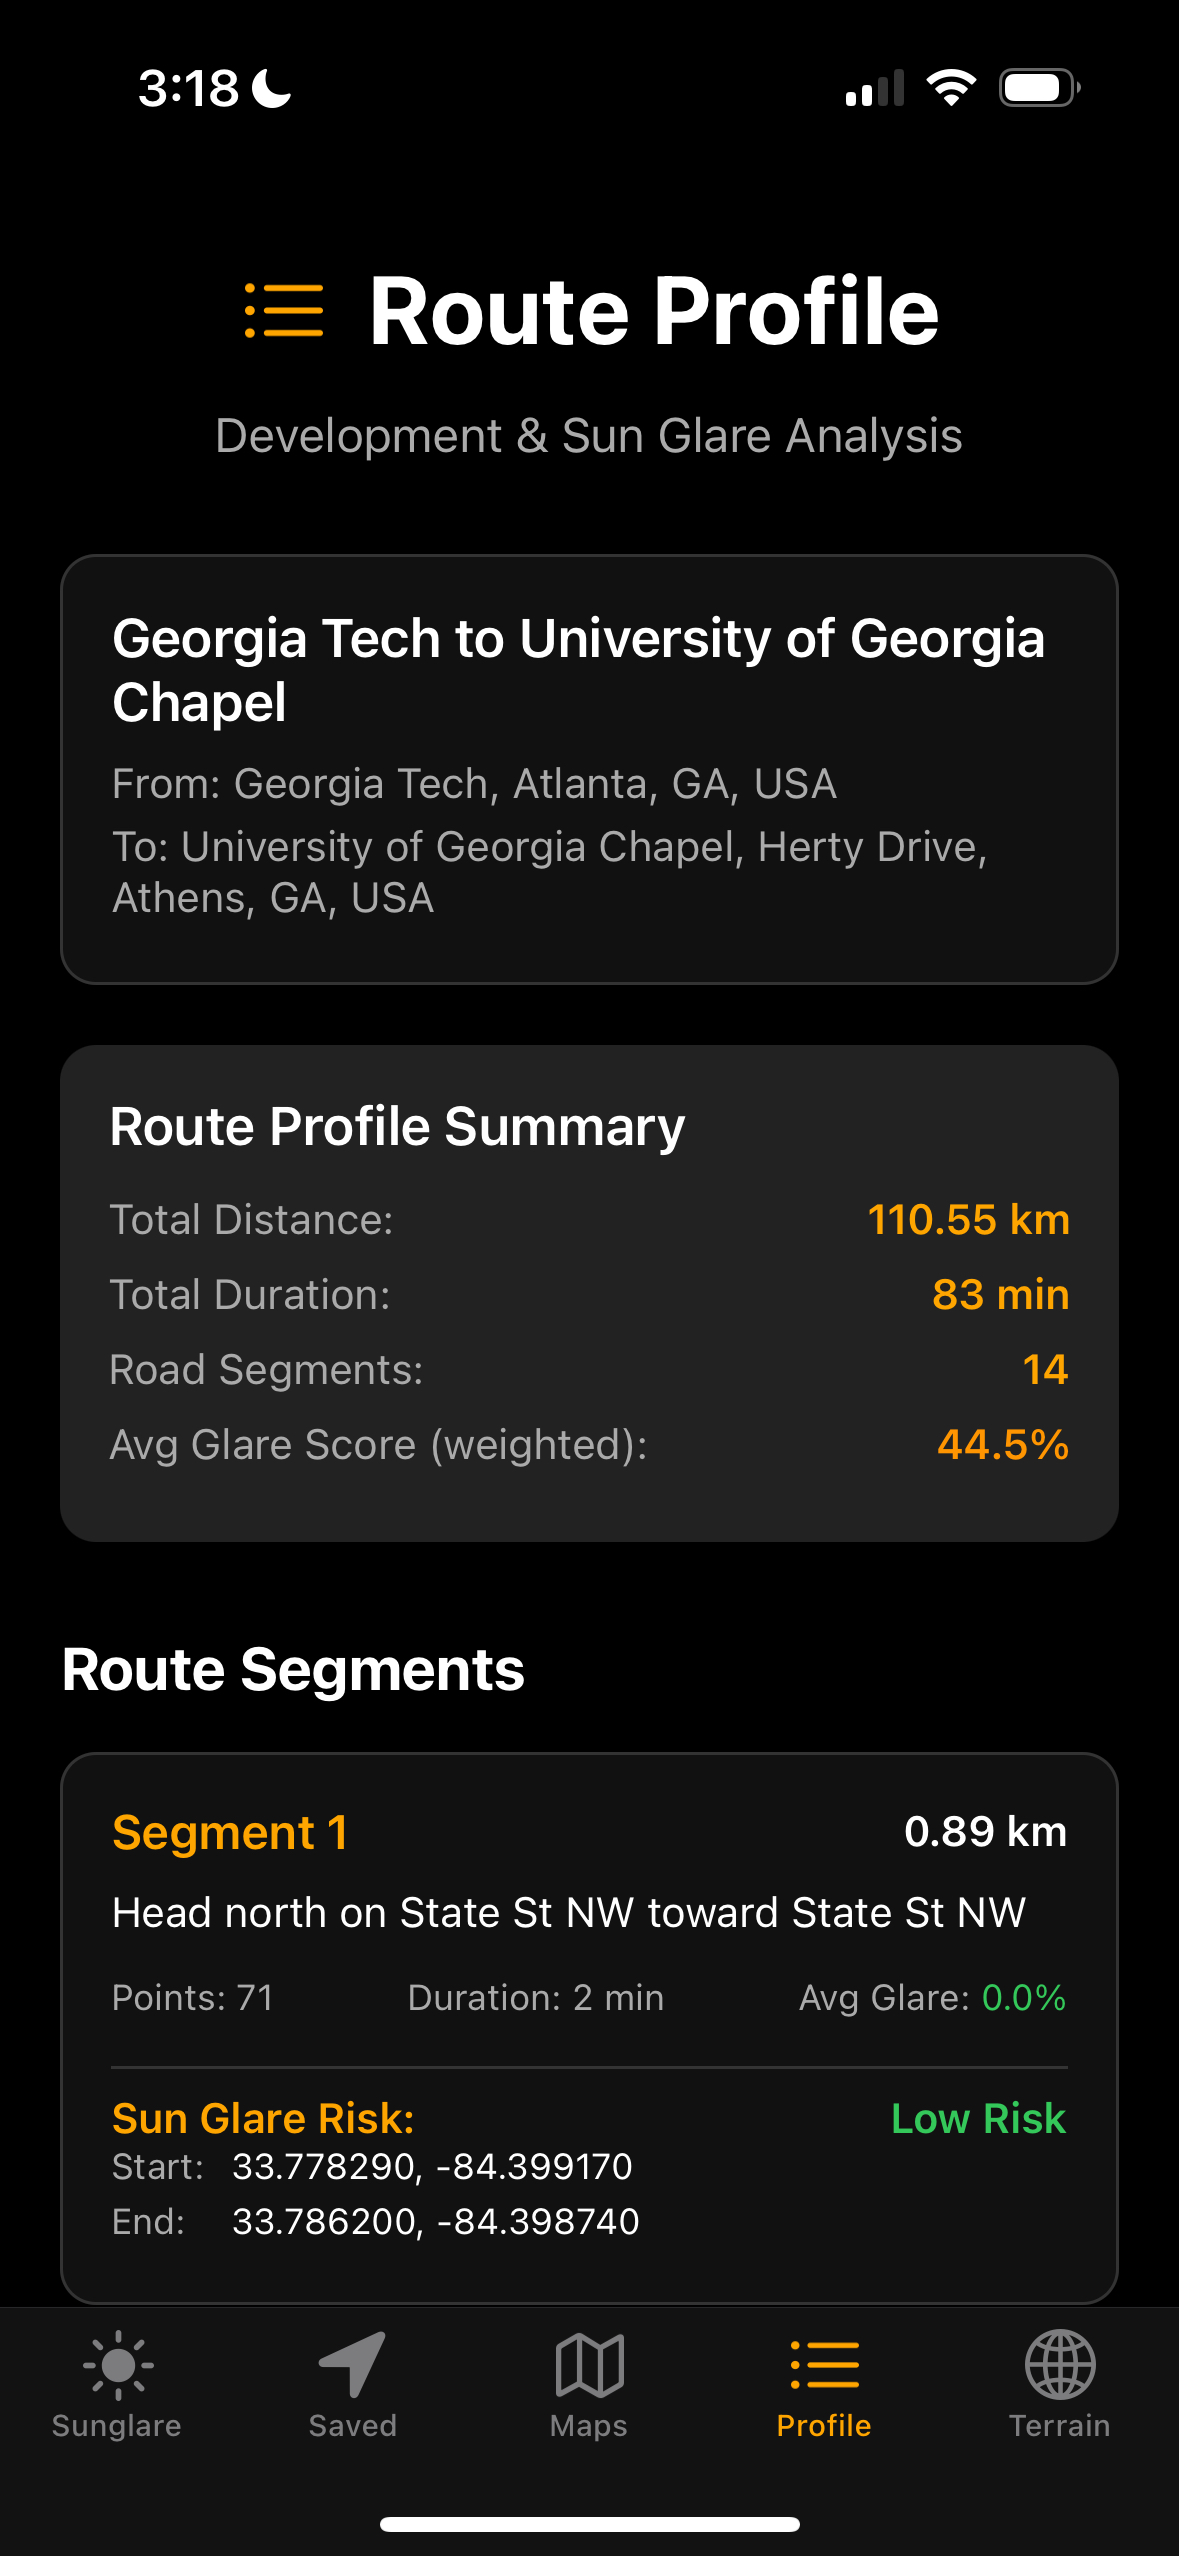
GlareGuard’s ride details page breaks down each turn and road segment, showing glare-risk levels for every part of your journey.
-
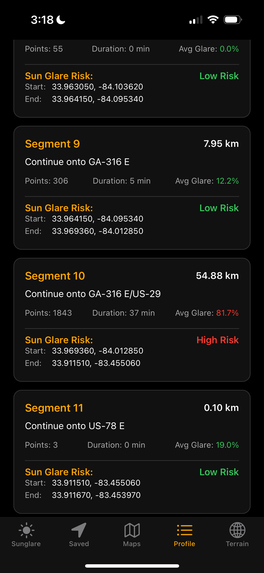
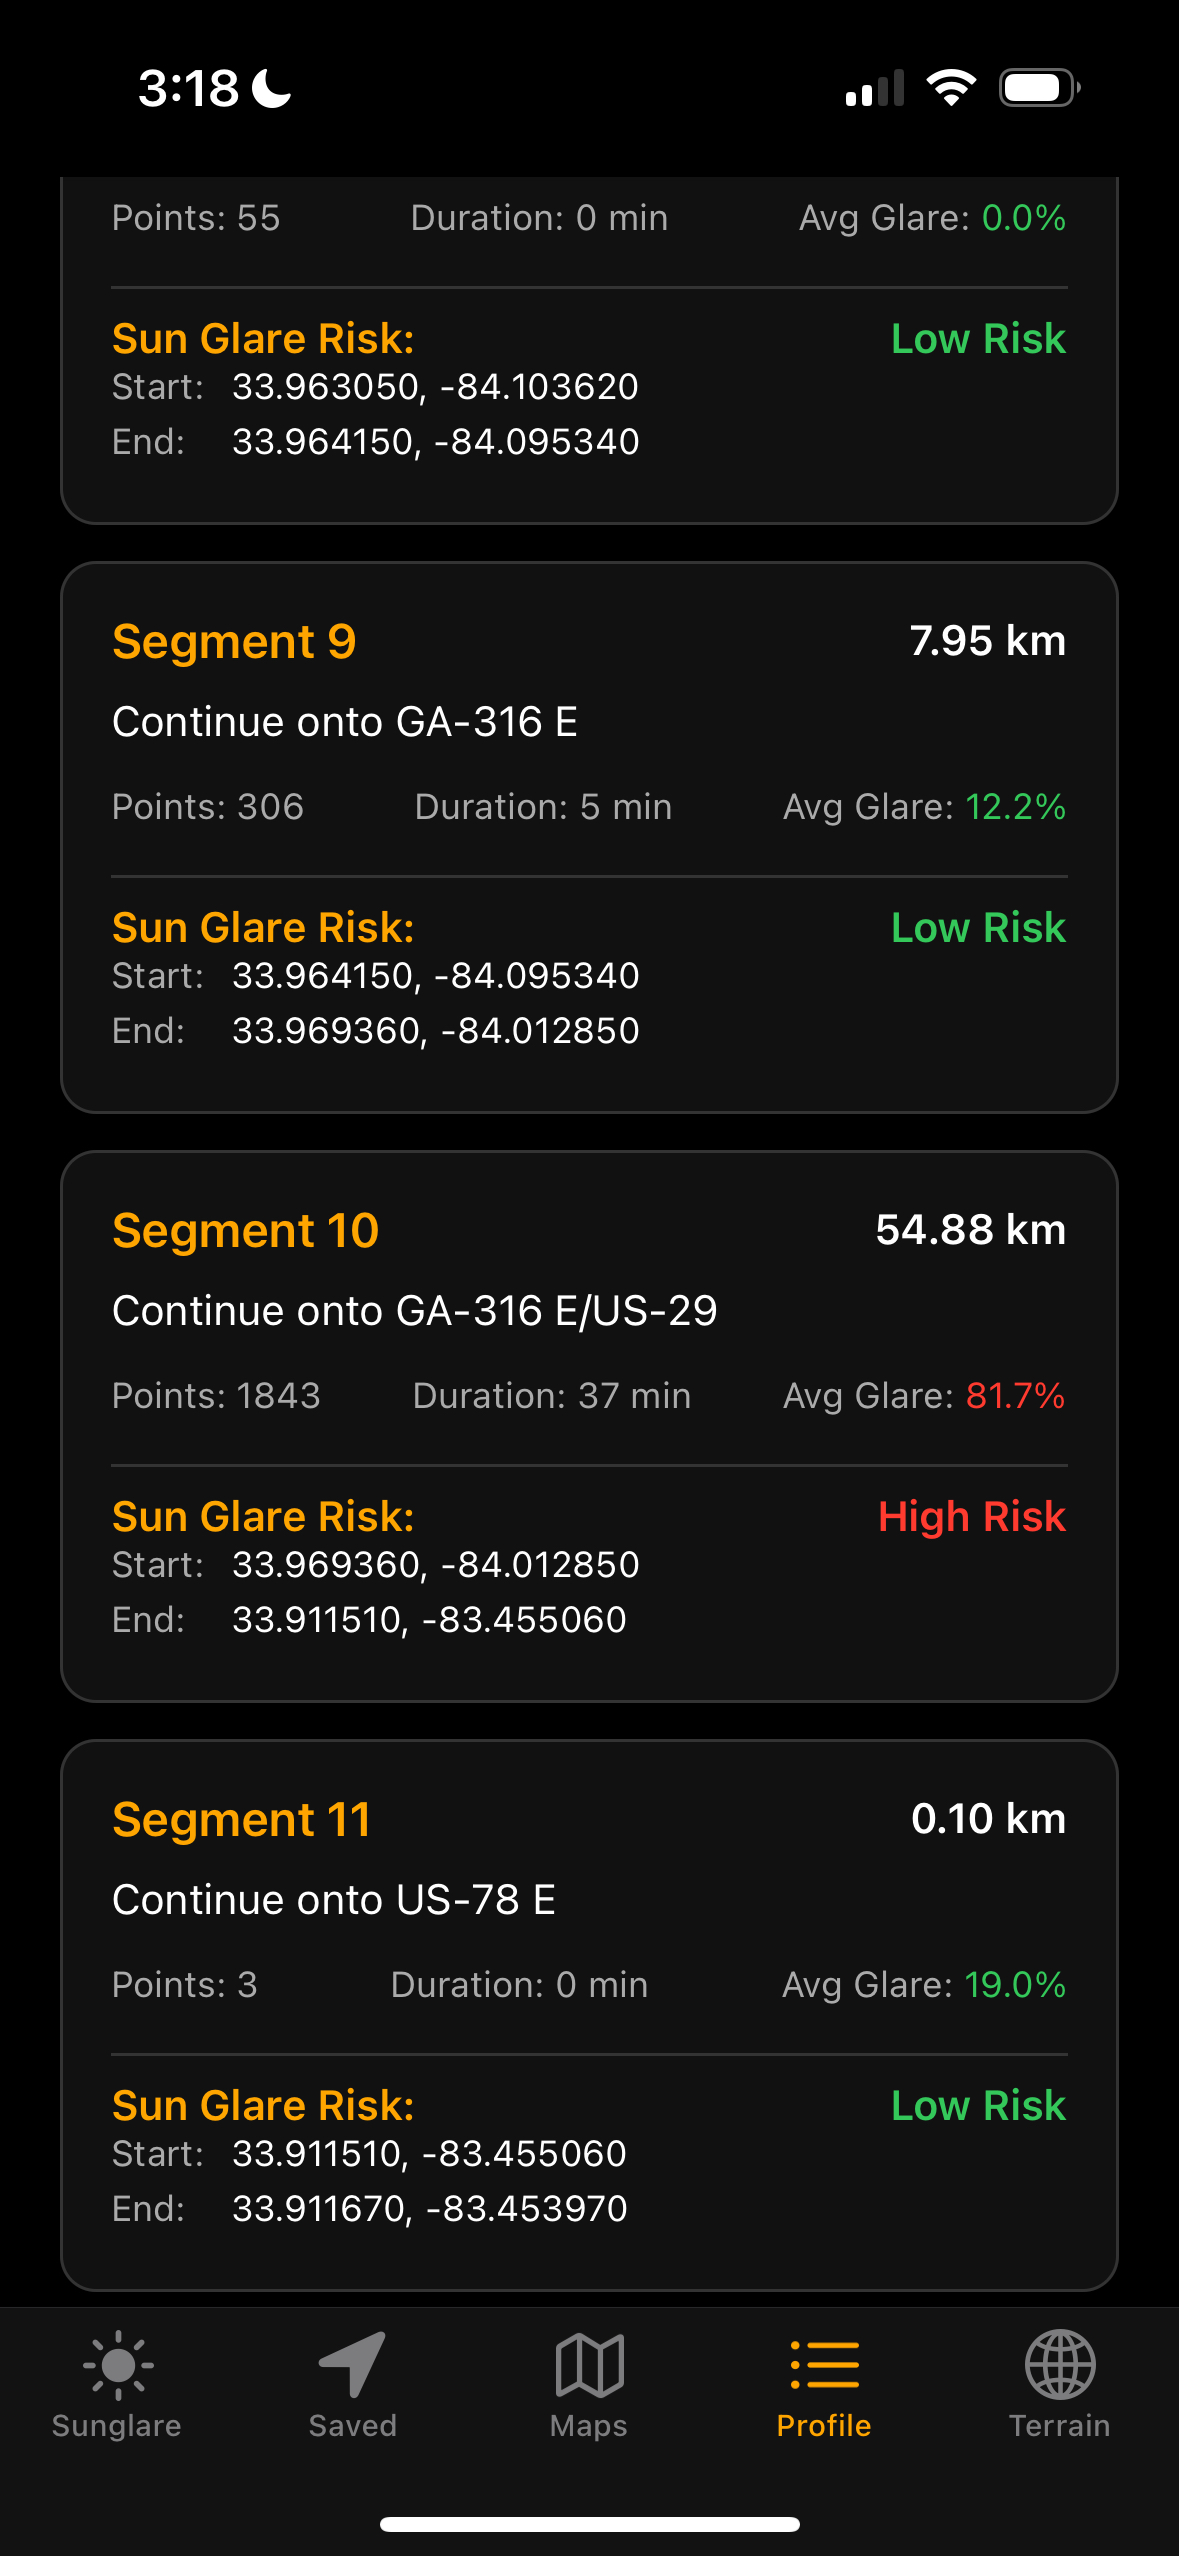
Detailed segment view in GlareGuard highlights a specific stretch of your route, revealing its glare risk level and key safety insights.
-

GlareGuard’s 3D landscape view for terrain and sun position along your route, helping you understand glare risks in real-world context.


Introduction
Drive safely with GlareGuard; the smart navigation assistant that alerts you to when and where sun glare could impair your vision, keeping you prepared and in control.
Inspiration
- Driving into the sun isn’t just annoying; it’s dangerous. Sun glare is the second leading environmental cause of crashes.
- Our goal was to build an end-to-end geospatial pipeline that predicts glare exposure along a planned route by fusing solar-geometry models, terrain DEMs, and urban obstruction data, all delivered in an interactive mobile UI.
What it does
- Computes spatiotemporal glare risk along any driving route by sampling the path at sub-minute intervals.
- Calculates solar azimuth & elevation at each sample point and evaluates relative heading of the vehicle to determine when drivers are facing the sun. -Performs line-of-sight obstruction tests using digital elevation models (SRTM) for terrain and OSM-derived building footprints + heights to determine whether the sun is blocked.
- Produces a continuous glare score [0-1] per sample and aggregates to segment-level risk metrics (avg, max, duration-weighted).
- Renders a color-coded polyline overlay on the map (green -> yellow -> red) and a time-series chart showing glare intensity over the trip.
How we built it
- Frontend:
- React Native (Expo) mobile app for iOS/Android with a MapView-based glare-risk overlay and a profile screen summarizing per-segment metrics.
- Handles route selection, live requests to the backend, and visualization of returned glare data.
- Routing:
- Google Maps Directions API for trip geometry, distances, durations, and polyline decoding.
Backend:
- Python 3 + FastAPI serving REST endpoints.
- PySolar for precise solar angle calculations and ephemeris data.
- OSMnx for building geometries + heights.
- SRTM elevation data for terrain (mountains, hills).
Overview of our glare_score function, to calculate azimuth and elevation values for sun placement, and delta and head values for relation to vehicle position and direction:
def glare_score(lat, lon, when, heading_deg): az, el = _solar(lat, lon, when) elev = _elev_term(el) delta = _angdiff(az, heading_deg) head = _heading_term(delta)- Custom geospatial pipeline that samples points along routes and runs line-of-sight checks to the sun.
- Custom geospatial pipeline that samples points along routes and runs line-of-sight checks to the sun.
Security: All API keys stored server-side, never exposed to the client.
Challenges we ran into
- API key security → solved by using a server proxy for all external requests.
- Geospatial math → had to align different coordinate systems (lat/lon vs projected meters).
- Incomplete OSM building data → added fallback estimates for building heights.
- Performance issues → optimized by adaptive sampling (denser near sunrise/sunset).
Accomplishments that we're proud of
- Built a scientifically accurate glare prediction model that combines solar geometry, terrain, and urban data.
- Validated predictions against known glare trouble spots.
- Designed a secure architecture that prevents key leaks.
- Created a mobile app that makes complex geospatial modeling usable for everyday drivers.
What we learned
- Deep dive into coordinate reference systems and geospatial data handling.
- Learned app development using Expo
- How to combine astronomy libraries with mapping APIs.
- Practical techniques for securing mobile-to-server API communication.
- That even simple user experiences often require bridging multiple technical domains.
What's next for GlareGuard
- Native integration with Google Maps turn-by-turn navigation for real-time glare warnings.
- Push notifications / calendar hooks to warn users about upcoming high-glare trips.
- Crowdsourced feedback to refine obstruction models.
- Long-term vision: AR windshield overlays showing glare risk in real time.
Built With
- docker
- expo.io
- fastapi
- google-cloud
- google-maps
- javascript
- openstreetmap
- osmnx
- pysolar
- python
- react-native
- srtm
- three-geo
- three.js
- uv


Log in or sign up for Devpost to join the conversation.