Devpost
Participate in our public hackathons
Devpost for Teams
Access your company's private hackathons
Grow your developer ecosystem and promote your platform
Drive innovation, collaboration, and retention within your organization
By use case
Blog
Insights into hackathon planning and participation
Customer stories
Inspiration from peers and other industry leaders
Planning guides
Best practices for planning online and in-person hackathons
Webinars & events
Upcoming events and on-demand recordings
Help desk
Common questions and support documentation
Statistics @ UCLA
Our project consists of three main components - an XGBoost machine learning model, a map, and Tableau visualizations. These three components are a powerful set of tools for Chevron stores.
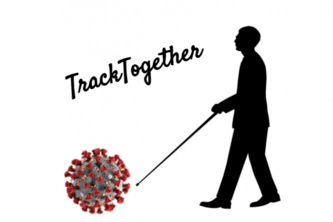
We created a virtual assistant for COVID-19 information for those with visual impairments by using the immense capabilities of speech recognition technology, narration, and deep learning.
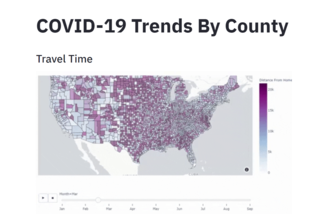
This report provides an analysis and visualizations regarding the correlation between geographic, demographic, social, and political trends and COVID-19 cases and deaths.
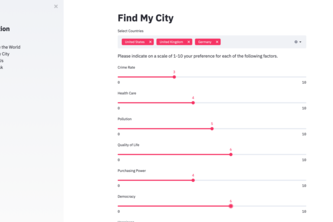
In order to best gauge which city suits an individual we have created an interactive web application involving data/ML techniques to optimize which cities are most desirable from individual tastes.